Why DCA Does Not Work For Short-Term TradersIn this video I go through why DCA (Dollar Cost Averaging) does not work for short-term traders and is more suitable for investors. I go through the pitfalls than come through such techniques, as well as explain how trading should really be approached. Which at it's cost should be based on having a positive edge and using the power of compounding to grow your wealth.
I hope this video was insightful, and gives hope to those trying to make it as a trader. Believe me, it's possible.
- R2F Trading
Community ideas

Exploring the Main Components of a Powerful Trading Journal
In one of the previous posts, we discussed the significance of a trading journal. In the today's article, I will share with you the key elements of a trading journal of a professional trader.
And first, a quick reminder that a trading journal is essential for your trading success. No matter on which level you are at the moment, you should always keep track of your results.
Let's go through the list of the things that you should include in your journal.
1 - Trading Instrument
The symbol where the order is executed.
You need that in order to analyze the performance of trading a particular instrument.
2 - Date
The date of the opening of the position. Some traders also include the exact time of the execution.
3 - Risk
Percentage of the account balance at risk.
Even though some traders track the lot of sizes instead, I do believe that the percentage data is more important and may give more insights.
4 - Entry Reason
The set of conditions that were met to open the trade.
In that section, I recommend to note as much data as possible.
It will be applied in future for the identification of the weaknesses of your strategy.
5 - Risk Reward Ratio
The expected returns in relation to potential risks.
6 - Results
Gain or loss in percentage.
And again, some traders track the pip value of the gain, however,
in my view, the percentage points are more relevant for studying the statistics.
Here is the example of the trade on Gold:
Here is how exactly you should journal the following trade:
Instrumet: Gold (XAUUSD)
Date: 03.07.2023
Risk: 1%
Entry Reason: H&S Pattern Formation,
Neckline Breakout & Retest
R/R Ratio: 1.77
Results: +1.77%
Of course, depending on your trading strategy and your personal goals, some other elements can be added. However, the list that I propose is the absolute minimum that you should track.
❤️Please, support my work with like, thank you!❤️
I am part of Trade Nation's Influencer program and receive a monthly fee for using their TradingView charts in my analysis.

Forex Trend Trading: A Complete Guide for Traders📊 Market Structure: Uptrend vs. Downtrend
🔼 Uptrend Market Structure (Higher Highs & Higher Lows)
Price makes higher highs (HH) and higher lows (HL).
Indicates buyers are in control.
Traders look for buying opportunities at key support levels.
Example Structure:
📍 HH → HL → Higher HH → Higher HL (trend continuation).
🔽 Downtrend Market Structure (Lower Highs & Lower Lows)
Price forms lower highs (LH) and lower lows (LL).
Sellers dominate the market.
Traders look for selling opportunities at resistance levels.
Example Structure:
📍 LL → LH → Lower LL → Lower LH (trend continuation).
📌 Steps to Trade Trends Effectively
1️⃣ Identify the Trend
✅ Use a higher timeframe (H4, D1, W1) to determine the major trend.
✅ Look for HH & HL (uptrend) or LH & LL (downtrend).
✅ Use trendlines, moving averages, and price action for confirmation.
2️⃣ Find Key Support & Resistance Levels
✅ Use previous swing highs and swing lows to mark key levels.
✅ Identify trendline support & resistance zones.
✅ Look for breakouts or retests for entry confirmation.
3️⃣ Use Technical Indicators for Confirmation
🔹 Moving Averages (MA) – 50 EMA & 200 EMA for trend direction.
🔹 RSI (Relative Strength Index) – Overbought (>70) or Oversold (<30) for trend exhaustion.
🔹 MACD (Moving Average Convergence Divergence) – Confirms trend strength & momentum.
4️⃣ Plan Your Entry & Exit Points
✅ Entry Strategy:
Buy at higher lows (HL) in an uptrend.
Sell at lower highs (LH) in a downtrend.
Use candlestick patterns (pin bars, engulfing candles) for confirmation.
✅ Exit Strategy:
Place Stop Loss (SL) below last HL (uptrend) or above LH (downtrend).
Use Take Profit (TP) at key resistance/support levels.
Consider trailing stop losses to maximize gains.
5️⃣ Risk Management & Trade Execution
✅ Risk-to-Reward Ratio (RRR) – Aim for at least 1:2 or higher.
✅ Position Sizing – Risk only 1-2% of your capital per trade.
✅ Monitor Trade – Adjust SL/TP as the trade progresses.
🎯 Trend Trading Strategies
📌 Pullback Trading
Wait for a retracement to a support/resistance level.
Enter at key Fibonacci levels (38.2%, 50%, 61.8%).
Confirm with price action signals.
📌 Breakout Trading
Enter when price breaks a major resistance (uptrend) or support (downtrend).
Wait for a retest of broken structure before entering.
Avoid false breakouts using volume confirmation.
📌 Trendline Trading
Draw trendlines connecting HLs (uptrend) or LHs (downtrend).
Enter when price bounces off the trendline in the direction of the trend.
⚠️ Common Mistakes to Avoid
❌ Trading against the trend without confirmation.
❌ Ignoring risk management and overleveraging.
❌ Entering too late in an extended trend.
❌ Ignoring economic news & fundamental factors.
📌 Final Thoughts
✅ Trend trading is a powerful strategy when used with proper market analysis.
✅ Always confirm trends with technical indicators & price action.
✅ Stick to your plan, manage risk, and stay disciplined for long-term success.
🔹 Happy Trading & Stay Profitable! 🚀📊

[How to] Properly analyzing relative equal levels with orderflow🔑 This is a basic principle and idea overview of why price will behave a certain way around levels where double lows or highs are. Also reviewing what is called Low Resistance Liquidity. This happens when multiple levels are stacked going lower or higher without a stop hunt.
Share this with your trading partner 💪🏽

Momentum Trading Strategies Across AssetsMomentum trading is a strategy that seeks to capitalize on the continuation of existing trends in asset prices. By identifying and following assets exhibiting strong recent performance—either upward or downward—traders aim to profit from the persistence of these price movements.
**Key Components of Momentum Trading:**
1. **Trend Identification:** The foundation of momentum trading lies in recognizing assets with significant recent price movements. This involves analyzing historical price data to detect upward or downward trends.
2. **Diversification:** Implementing momentum strategies across various asset classes—such as equities, commodities, currencies, and bonds—can enhance risk-adjusted returns. Diversification helps mitigate the impact of adverse movements in any single market segment.
3. **Risk Management:** Effective risk management is crucial in momentum trading. Techniques such as setting stop-loss orders, position sizing, and continuous monitoring of market conditions are employed to protect against significant losses.
4. **Backtesting:** Before deploying a momentum strategy, backtesting it against historical data is essential. This process helps assess the strategy's potential performance and identify possible weaknesses.
5. **Continuous Refinement:** Financial markets are dynamic, necessitating ongoing evaluation and adjustment of trading strategies. Regularly refining a momentum strategy ensures its continued effectiveness amid changing market conditions.
**Tools and Indicators:**
- **Relative Strength Index (RSI):** This momentum oscillator measures the speed and change of price movements, aiding traders in identifying overbought or oversold conditions.
- **Moving Averages:** Utilizing short-term and long-term moving averages helps in smoothing out price data, making it easier to spot trends and potential reversal points.
**Common Pitfalls to Avoid:**
- **Overtrading:** Excessive trading can lead to increased transaction costs and potential losses. It's vital to adhere to a well-defined strategy and avoid impulsive decisions.
- **Ignoring Market Conditions:** Momentum strategies may underperform during sideways or choppy markets. Recognizing the broader market environment is essential to adjust strategies accordingly.
By understanding and implementing these components, traders can develop robust momentum trading strategies tailored to various asset classes, thereby enhancing their potential for consistent returns.
Source: digitalninjasystems.wordpress.com
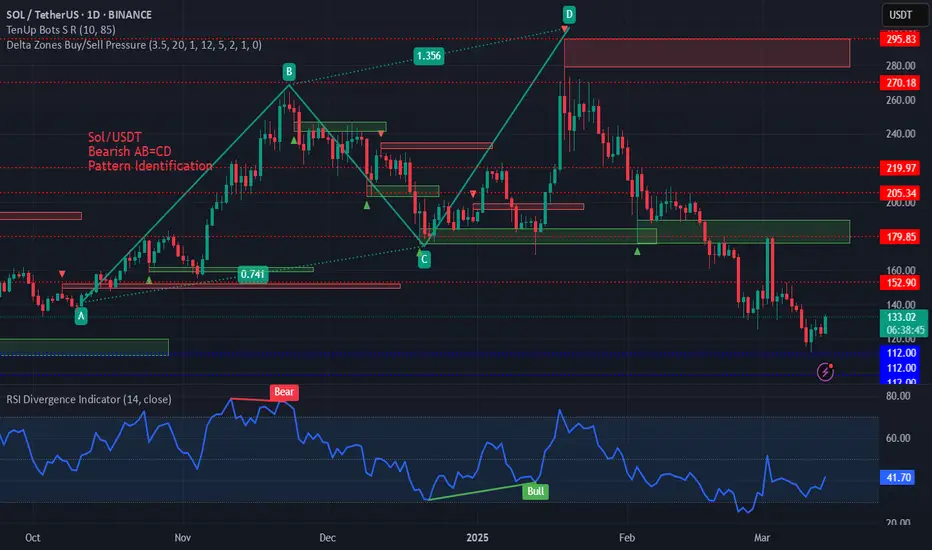
Pattern Identification on SOL/USD AB=CD Pattern on SOL/USDT on daily time frame.
These are harmonic patterns and these can be seen on hourly, 4h, 1day etc. time frames and the trader can take positions in the market according to the trend.
The Two-Faced Market: The Truth Behind Trend Reversals!🎭 The Two-Faced Market: The Truth Behind Trend Reversals! 📊🚀
📢 Ever entered a trade thinking you caught the perfect trend , only to get stopped out as the market reversed?
You're not alone. The market has a way of fooling traders—but if you understand its “two-faced” nature, you can stay one step ahead.
🔥 Why Trends Reverse (and How to Catch It Early!)
Most traders believe trends reverse due to "news" or "randomness." But in reality, the market gives signals long before the turn happens. Here’s what to watch for:
🔹 Momentum Divergence: The price makes a new high, but indicators like RSI/MACD don’t.
🔹 Volume Anomaly: The trend continues, but volume dries up—a sign of weakness.
🔹 Failed Breakouts: Price breaks a key level, only to fall back inside—trapping traders.
🔹 Candlestick Clues: Reversal patterns like engulfing candles or wicks rejecting key levels appear.
🚀 Mastering these signals can put you ahead of 90% of traders.
📊 Real Example: XAU/ USD Trend Reversal in Action
🔎 Breakdown of the setup:
✅ Step 1: Identify a trend (through market structure, trendline or moving average).
✅ Step 2: Look for failed breakouts against the trend
✅ Step 3: Look for trend-following setups
🎯 The Market’s Game: Recognizing The Shift
Trends don’t die suddenly—they fade before reversing. The best traders spot the early signs and position before the crowd.
💡 Have you spotted these reversal signs before? Drop a comment with your experience! 👇🔥
📚 Always follow your trading plan regarding entry, risk management, and trade management.
Good luck!
All Strategies Are Good; If Managed Properly!
~Rich
Disclosure: I am part of Trade Nation's Influencer program and receive a monthly fee for using their TradingView charts in my analysis.

Donchian Channel Strategy like The Turtles TradersThe Turtle Traders strategy is a legendary trend-following system developed by Richard Dennis and William Eckhardt in the 1980s to prove that trading could be taught systematically to novices. Dennis, a successful commodities trader, bet Eckhardt that he could train a group of beginners—nicknamed "Turtles"—to trade profitably using strict rules. The experiment worked, with the Turtles reportedly earning over $100 million collectively. Here’s a detailed breakdown of their strategy, focusing on the core components as documented in public sources like Curtis Faith’s Way of the Turtle and other accounts from the era.
Core Philosophy
Trend Following: The Turtles aimed to capture large price trends in any direction (up or down) across diverse markets—commodities, currencies, bonds, and later stocks.
Systematic Rules: Every decision—entry, exit, position size—was predefined. No discretion allowed.
Volatility-Based: Risk and position sizing adjusted to each market’s volatility, not fixed dollar amounts.
Long-Term Focus: They targeted multi-month trends, ignoring short-term noise.
Two Trading Systems
The Turtles used two complementary breakout systems—System 1 (shorter-term) and System 2 (longer-term). They’d trade both simultaneously across a portfolio of markets.
System 1: Shorter-Term Breakout
Entry:
Buy when the price breaks above the 20-day high (highest high of the past 20 days).
Sell short when the price breaks below the 20-day low.
Skip the trade if the prior breakout (within 20 days) was profitable—avoid whipsaws after a winning move.
Initial Stop Loss:
Exit longs if the price drops 2N below entry (N = 20-day Average True Range, a volatility measure).
Exit shorts if the price rises 2N above entry.
Example: Entry at $100, N = $2, stop at $96 for a long.
Trailing Stop:
Exit longs if the price breaks below the 10-day low.
Exit shorts if the price breaks above the 10-day high.
Time Frame: Aimed for trends lasting weeks to a couple of months.
System 2: Longer-Term Breakout
Entry:
Buy when the price breaks above the 55-day high.
Sell short when the price breaks below the 55-day low.
No skip rule—take every breakout, even after a winner.
Initial Stop Loss:
Same as System 1: 2N below entry for longs, 2N above for shorts.
Trailing Stop:
Exit longs if the price breaks below the 20-day low.
Exit shorts if the price breaks above the 20-day high.
Time Frame: Targeted trends lasting several months (e.g., 6-12 months).
Position Sizing
Volatility (N): N, or “noise,” was the 20-day Average True Range (ATR)—the average daily price movement. It normalized risk across markets.
Unit Size:
Risk 1% of account equity per trade, adjusted by N.
Formula: Units = (1% of Account) / (N × Dollar Value per Point).
Example: $1M account, 1% = $10,000. Corn N = 0.5 cents, $50 per point. Units = $10,000 / (0.5 × $50) = 400 contracts.
Scaling In: Add positions as the trend confirms:
Long: Add 1 unit every ½N above entry (e.g., entry $100, N = $2, add at $101, $102, etc.).
Short: Add every ½N below entry.
Max 4 units per breakout, 12 units total per market across systems.
Risk Management
Portfolio Limits:
Max 4 units in a single market (e.g., corn).
Max 10 units in closely correlated markets (e.g., grains).
Max 12 units in one direction (long or short) across all markets.
Stop Loss: The 2N stop capped risk per unit. If N widened after entry, the stop stayed fixed unless manually adjusted (rare).
Drawdown Rule: If account dropped 10%, cut position sizes by 20% until recovery.
Markets Traded
Commodities: Corn, soybeans, wheat, coffee, cocoa, sugar, cotton, crude oil, heating oil, unleaded gas.
Currencies: Swiss franc, Deutschmark, British pound, yen.
Bonds: U.S. Treasury bonds, 90-day T-bills.
Metals: Gold, silver, copper.
Diversification across 20-30 markets ensured uncorrelated trends.

Don't Confuse "DYOR" with Confirmation Bias in Crypto TradingIn the crypto space, influencers and self-proclaimed crypto gurus constantly tell you to " do your own research " (DYOR) while presenting coins that will supposedly do 100x or become the "next big thing." They always add, " this is not financial advice ," but few actually explain how to do proper research.
On top of that, most influencers copy each other, get paid by projects to promote them, and—whether they admit it or not—often contribute to confirmation bias.
What is confirmation bias? It’s the psychological tendency to look for information that confirms what we already believe while ignoring evidence that contradicts it.
For example, if you want to believe a certain altcoin will 100x, you’ll naturally look for articles, tweets, and videos that say exactly that—while ignoring red flags.
How do you distinguish real research from confirmation bias?
This article will help you:
• Understand confirmation bias and how it affects your investments
• Learn how to conduct proper, unbiased research
• Discover the best tools and sources for real analysis
________________________________________
What Is Confirmation Bias & How Does It Sabotage Your Investments?
Confirmation bias is the tendency to seek, interpret, and remember information that confirms what we already believe—while ignoring evidence to the contrary.
In crypto, this leads to:
✔️ Only looking for opinions that confirm a coin is "going to the moon"
✔️ Avoiding critical discussions about the project’s weaknesses
✔️ Believing "everyone" is bullish because you're only consuming pro-coin content
The result?
• You make emotional investments instead of rational ones
• You expose yourself to unnecessary risk
• You develop unrealistic expectations and are more vulnerable to FOMO
________________________________________
How to Conduct Proper Research & Avoid Confirmation Bias
1. Verify the Team & Project Fundamentals
A solid crypto project must have a transparent, experienced team. Check:
• Who are the founders and developers? Are they reputable or anonymous?
• Do they have experience? Have they worked on successful projects before?
• Is the code open-source? If not, why?
• Is there a strong whitepaper? It should clearly explain the problem, the solution, and the technology behind it.
Useful tools:
🔹 GitHub – Check development activity
🔹 LinkedIn – Verify the team's background
🔹 CoinMarketCap / CoinGecko – Check market data and tokenomics
2. Analyze Tokenomics & Economic Model
A project can have great technology but fail due to bad tokenomics.
Key questions to ask:
• What’s the maximum supply? A very high supply can limit price growth.
• How are the tokens distributed? If the team and early investors hold most of the supply, there’s a risk of dumping.
• Are there mechanisms like staking or token burning? These can impact long-term sustainability.
Useful tools:
🔹 Token Unlocks – See when tokens will be released into circulation
🔹 Messari – Get detailed tokenomics reports
3. Evaluate the Community Without Being Misled
A large, active community can be a good sign, but beware of:
• Real engagement vs. bots. A high follower count doesn’t always mean real support.
• How does the team respond to tough questions? Avoid projects where criticism is silenced.
• Excessive hype? If all discussions are about "Lambo soon" and "to the moon," be cautious.
Where to check?
🔹 Twitter (X) – Follow discussions about the project
🔹 Reddit – Read community opinions
🔹 – See how the team handles criticism
4. Verify Partnerships & Investors
Many projects exaggerate or fake their partnerships.
• Is it listed on major exchanges? Binance, Coinbase, and Kraken are more selective.
• Are the investors well-known VCs? Funds like A16z, Sequoia, Pantera Capital don’t invest in just anything.
• Do the supposed partners confirm the collaboration? Check their official sites or announcements.
Where to verify?
🔹 Crunchbase – Check a project's investors
🔹 Medium – Many projects announce partnerships here
5. Watch the Team's Actions, Not Just Their Words
• Have they delivered on promises? Compare the roadmap to actual progress.
• What updates have they released? A strong project should have continuous development.
• Are they selling their own tokens? If the team is dumping their coins, it’s a bad sign.
Useful tools:
🔹 Etherscan / BscScan – Track team transactions
🔹 DefiLlama – Check total value locked (TVL) in DeFi projects
________________________________________
Final Thoughts: DYOR Correctly, Not Emotionally
To make smart investments in crypto, you must conduct objective research—not just look for confirmation of what you already believe.
✅ Analyze the team, tokenomics, and partnerships.
✅ Be skeptical of hype and verify all claims.
✅ Use on-chain data, not just opinions.
✅ Don’t let FOMO or emotions drive your decisions.
By following these steps, you’ll be ahead of most retail investors who let emotions—not facts—guide their trades.
How do you do your own research in crypto? Let me know in the comments!

5 Most Popular Momentum Indicators to Use in Trading in 20255 Most Popular Momentum Indicators to Use in Trading in 2025
Want to master the art of momentum trading? Look no further. In this FXOpen article, we’ll explore how to use momentum indicators, the signals they generate, and five most popular momentum indicators for trading in 2025.
What Is a Momentum Indicator?
Momentum in technical analysis refers to the rate at which an asset's price accelerates or decelerates, helping traders identify potential trend continuations or reversals.
A momentum indicator is a tool used in technical analysis to measure the speed and strength of an asset’s price movements. By analysing changes in price over a specific period, these indicators provide insights into the underlying force driving market trends.
Momentum indicators do not focus on the direction of the price movement itself, but rather the strength behind it. Traders use these tools to gauge whether the market is overbought, oversold, or losing momentum, which helps determine entry or exit points. A stock momentum indicator like the Relative Strength Index (RSI), for instance, may indicate that stocks are currently bought or sold too heavily and their price is due for a reversal.
The Significance of Momentum Technical Indicators
Momentum indicators do not focus on the direction of the price movement, but rather on the strength behind it. They’re able to quantify and represent hidden clues about the future market direction in an easily interpretable way. By learning to read momentum indicators, traders can develop effective trading strategies, identify potential opportunities, and manage risk more efficiently.
Momentum tools produce a range of signals that offer traders an edge over the markets. Let’s take a look at some of the most common momentum signals.
Overbought and Oversold Conditions
These signals indicate when an asset's price has moved too far in one direction without sufficient support from fundamental or technical factors and is likely to reverse. For example, RSI generates overbought signals when the reading rises above 70 and signals oversold conditions when the reading falls below 30.
Divergence
Divergence occurs when the price of an asset moves in the opposite direction of the indicator, suggesting an upcoming reversal. For instance, when the price is making higher highs, but RSI is making lower highs, this indicates a bearish divergence that increases the likelihood of a downward move.
Crossover
These signals are generated when the indicator's lines cross each other or a certain threshold. A common example is the MACD, where traders look for crossovers between the fast MACD line and the slower signal line to spot potential entry and exit points.
Top Five List of Momentum Indicators for Technical Analysis
Now that we understand the types of signals that momentum tools produce, let’s break down five of the most popular with a momentum indicators list.
1. Relative Strength Index (RSI)
The RSI is one of the most popular and well-documented momentum indicators. It measures the speed and change of price movements by comparing the average gain to the average loss over a specified period, usually 14.
RSI is an oscillator, moving between 0 and 100. Values above 70 reflect overbought conditions, while values below 30 indicate oversold conditions. When the RSI moves out of overbought or oversold territory, many traders interpret this as a reversal confirmation. Sustained movements above or below the midpoint (50) can also be used to confirm a bullish or bearish trend, respectively. Moreover, traders look for divergence between the RSI and price to identify weakening trends and possible reversals.
2. Average Directional Index (ADX)
The ADX is a momentum indicator used to determine a trend’s strength. Unlike most other tools, its reading doesn’t move according to the direction of price action, i.e. it doesn’t move up if bullish or down when bearish. Instead, it ranges from 0 to 100, with values above 25 indicating a strong trend and below 25 suggesting a weak or non-trending market.
ADX is commonly used in combination with other tools, as it simply confirms the trendiness of a market. For example, traders might use a leading indicator like RSI to anticipate bullishness and confirm the trend when ADX crosses over 25.
3. Commodity Channel Index (CCI)
The CCI is a versatile momentum indicator. It uses a constant in its calculation to ensure that 75% of values fall between +/- 100, with moves outside of the range generally indicating a trend breakout or continuation. It can also show extreme overbought or oversold conditions when its value exceeds +/- 200.
The CCI requires a more nuanced approach than other tools and is typically used to confirm a trader’s directional bias and to identify potential opportunities. For instance, a visually identifiable bullish trend can be confirmed by looking at the CCI. If its value is skewed toward 100+, traders can be confident in their observation. When the market cools off, CCI will fall below 100. Traders can then confirm a pullback entry with a move back into the +/- 100 range.
4. Moving Average Convergence Divergence (MACD)
The MACD is a highly regarded trend-following momentum indicator that shows the relationship between two moving averages of an asset's price. It’s used in technical analysis to identify the relationship between two moving averages of a security’s price. It helps traders understand the trend’s strength, direction, and duration, as well as possible reversal points.
Traders use crossovers between the MACD and signal lines as potential entry and exit signals. Additionally, when the MACD histogram crosses above or below the zero line, it can indicate bullish or bearish momentum in the market. Lastly, it’s also possible to spot divergences between price and the indicator’s peaks and troughs, similar to how divergences are identified with RSI.
5. Momentum (Mom)
The Momentum indicator is a simple yet potentially effective tool that measures the rate of change in an asset's price over a specific period. The value of the Momentum depends on the market it’s applied to. For example, using the Momentum indicator in stocks will result in a fluctuating value typically between +/- 20, depending on the stock’s price. For forex pairs, its range may look more like +/- 0.02.
The common feature across all markets, however, is the zero line. Generally speaking, positive Momentum values indicate upward price movement, while negative values suggest downward movement. It can also show overbought and oversold conditions, but its lack of defined boundaries means this can be tricky. However, Momentum is especially useful for identifying divergences.
Advantages of Momentum Indicators
Momentum indicators are valuable tools in technical analysis, helping traders assess the strength and speed of price movements. They offer several benefits that enhance trading strategies and decision-making:
- Identify Trends Early: Market momentum indicators can reveal the start of a new trend and the end of the old trend, allowing traders to enter trades at opportune moments.
- Objective Analysis: They provide quantifiable data, reducing reliance on subjective analysis and emotional decision-making.
- Spot Overbought and Oversold Conditions: Momentum tools help traders identify when an asset is overbought or oversold, signalling potential reversals and exit points.
- Confirm Trade Signals: Combining momentum indicators with other technical tools enhances the accuracy of trade signals, providing stronger confirmation for trading decisions.
- Adaptable Across Markets: They can be applied to various assets, including stocks, forex, and commodities, making them versatile tools for traders.
Things to Consider When Trading Momentum Indicators
While momentum indicators can be an effective addition to any trader’s arsenal, there are a few things to be aware of:
- Trade with the Trend: Trends often last longer than you may think, and constantly looking for trend reversals will only end in frustration. Look for bullish signals during an uptrend and bearish signals in a downtrend.
- Use Multiple Indicators: Relying on a single tool can lead to false signals. Many traders combine a lagging indicator, like MACD, with a leading indicator, like RSI. Combining two or three tools can help confirm signals and improve trade accuracy.
- Beware of False Signals: Momentum indicators can sometimes generate false signals, especially in sideways or choppy markets. Being patient and waiting for confirmation before entering a trade is vital.
- Don’t Rely Too Heavily on Indicators: While momentum indicators can be helpful, relying solely on them without considering price action, market structure, or fundamental aspects can lead to poor trading decisions. Use these indicators alongside other tools for a momentum indicator strategy.
Final Thoughts
Now that you have a comprehensive overview of momentum indicators and the signals they produce, it’s time to put your knowledge into practice. After experimenting with a few tools and settling on your favourites, you can open an FXOpen account. You’ll be able to trade over 600+ markets with low costs and ultra-fast execution speeds while partnering with one of the world’s fastest-growing forex brokers. Good luck!
FAQ
How to Use Momentum Indicators?
With momentum indicators, traders monitor the rate of price changes to assess whether it is gaining or losing strength. Traders look for overbought or oversold conditions, divergences, and crossovers to determine potential entry and exit points.
What Is the Best Period for a Momentum Indicator?
If we are talking about the Momentum indicator, the best period depends on your trading style. For short-term traders, 7 and 10 periods are common, while long-term traders may prefer 14 and 21 periods. Testing various periods based on asset volatility can improve results.
What Is the Best Momentum Indicator for Scalping?
There is no best momentum indicator for scalping but the Relative Strength Index (RSI) is often favoured by scalpers due to its ability to quickly identify overbought or oversold conditions. Its responsiveness helps scalpers make rapid decisions in fast-moving markets.
What Is the Difference Between Momentum and Trend Indicators?
Momentum trading indicators measure the speed of price changes, while trend indicators assess the direction and persistence of price movements. To put it simply, momentum focuses on strength, while trend indicators focus on the overall direction.
Is MACD a Momentum Indicator?
Yes, the Moving Average Convergence Divergence (MACD) is one of the most popular momentum indicators, especially in stock trading. It reveals changes in momentum and helps identify potential trend reversals.
This article represents the opinion of the Companies operating under the FXOpen brand only. It is not to be construed as an offer, solicitation, or recommendation with respect to products and services provided by the Companies operating under the FXOpen brand, nor is it to be considered financial advice.

Europe - America War, Impact on Forex
Hello, my name is Andrea Russo and today I want to talk to you about an important issue that is shaking up the international market: the trade war between the European Union and the United States. Recently, the European Union responded to the duties imposed by the United States on steel and aluminum with countermeasures worth 26 billion euros. In response, US President Donald Trump threatened to impose 200% duties on all wines, champagnes and spirits from France and other countries represented by the EU2.
This escalation of trade tensions will certainly have a significant impact on the FOREX market. Let's see together what the consequences could be:
Market Volatility: Trade tensions between two of the world's largest economies will increase the volatility of the FOREX market. Investors will seek safe havens, such as the Swiss Franc (CHF) and the Japanese Yen (JPY), increasing the demand for these currencies.
Euro (EUR) depreciation: The euro could come under downward pressure due to concerns about the economic impact of tariffs on key EU sectors, such as wine. The reduction in exports of wine and other alcoholic products could negatively impact the EU's trade balance.
US dollar (USD) appreciation: The dollar could strengthen further, as investors view the US as a safe haven in times of economic uncertainty. However, the increase in tariffs could also lead to higher inflation in the US, complicating the Federal Reserve's decisions regarding interest rates.
Impact on the currencies of wine exporting countries: The currencies of major European wine exporters, such as the euro (EUR) and the Swedish krona (SEK), could come under downward pressure due to the decrease in exports to the US.
In conclusion, the tariff war between the European Union and the US will have a significant impact on the FOREX market. Investors will need to monitor developments closely and adjust their trading strategies accordingly. Stay tuned for more updates and market analysis!
Happy trading to all!
Learn To Invest: Global Liquidity Index & BitcoinGlobal Liquidity Index & BitCoin:
🚀 Positive Vibes for Your Financial Journey! 🚀
BITSTAMP:BTCUSD
Look at this chart! It's the Global Liquidity Index , a measure of how much extra money is flowing through the world's financial systems.
Why is this important? Because when this index is high, it often means good things for investments like #Bitcoin! 📈
Think of it like this: when there's more money flowing, people are often more willing to take risks and invest in things like Bitcoin.
See those "BullRun" boxes? That means things are looking bright! It's showing that money is flowing, and that's often a good sign for potential Bitcoin growth. 🌟
Even if you're not a pro, it's easy to see the good news here. Understanding these trends can help you make smarter decisions.
Let's all aim for growth and success! 💪

O kurwa! Curvature in Technical Analysis: What Does It Tell Us?Curvature in TA is trading approach where curved lines are used instead of traditional straight trendlines. Curved lines help to visualize how trends evolve and can provide insights into potential reversals or trend continuations.
One of the known methods that utilize curvature is the MIDAS (Market Interpretation/Data Analysis System). This system was developed by physicist Paul Levine in 1995 and uses curved support and resistance lines based on Volume-Weighted Average Price (VWAP). The curves adapt dynamically as price and volume change, helping to identify trend shifts and potential reversals.
💡 Why should we use Curvature?
Dynamic Support and Resistance: Curved lines adapt to price changes, unlike static horizontal lines.
Reversal Signals: They can signal potential trend shifts earlier than traditional methods.
Better Trend Visualization: They are particularly useful for parabolic or exponential price movements.
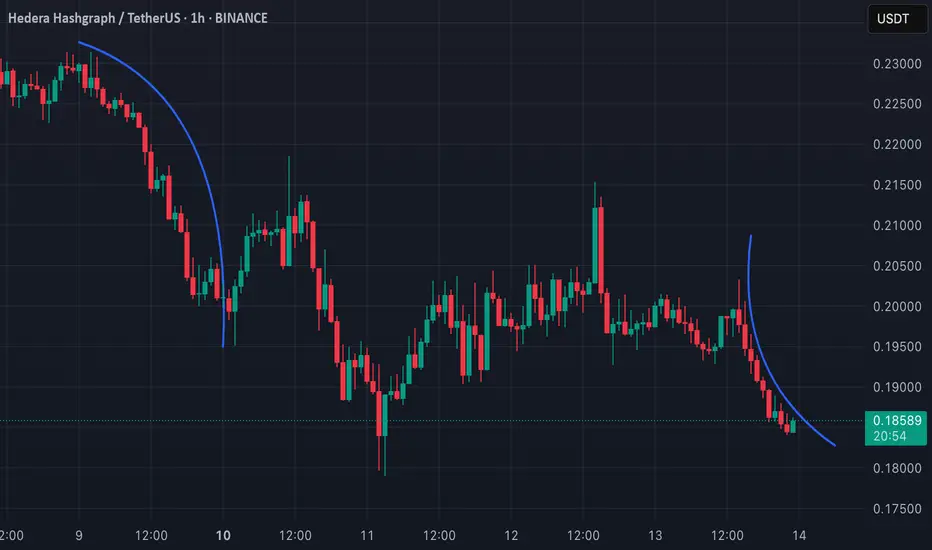
📊 Applying Curvature to HBAR (1H TF)
There are two curves on my chart. Both of them shows a curvature pattern forming on the 1-hour timeframe.
L: The curve on left side indicates a strong downward move, and the price appears to be following this curve closely.
R: On the other hand I have drawn curve on the right side, which is alligned as downward curve as well, but it has different angle.
This post is meant to test my theory on real life example.
🔑 Key Points:
Breaks away from the curvature could indicate a potential trend reversal or consolidation.
Combining this analysis with volume and momentum indicators can improve accuracy when predicting possible bounce or breakdown scenarios. Let's see how it works!
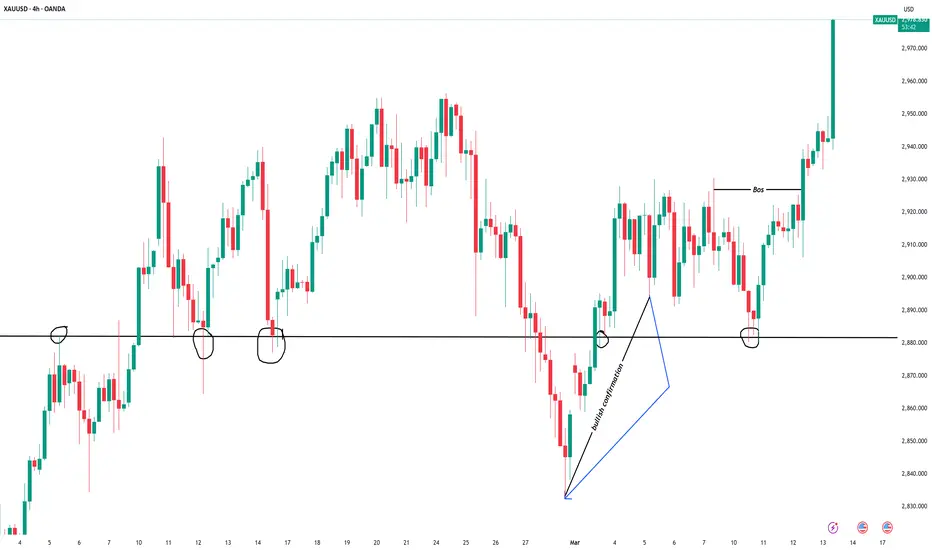
MARKET TREND/STRUCTURE USING XAUUSDTRADEWITHKENNY
EDUCATIVE : The trendline drawn above highlights the bullish confirmation on the 4-hour timeframe at the 2,890 support level , following a fake breakout . The 2,880 level acted as a key support zone and was retested multiple times , as shown on the chart before continuing the trend .
It’s always advisable to perform a top-down analysis , starting from the weekly timeframe down to the hourly and minute timeframes , to refine entries at key levels for better trade execution.
Disclaimer : This is my personal view and should not be considered financial advice.
Quarterly Theory "QT"
Introduction to Quarterly Theory (QT)
Time must be divided into quarters for a proper interpretation of market cycles.
Combining QT (Quarterly Theory) concepts with basic ICT concepts leads to greater accuracy.
Understanding QT allows you to be flexible. It adapts to any trading style as it is universal across all time frames.
QT eliminates ambiguity by providing specific time-based reference points to look for when entering trades
.
THE CYCLE
Annual Cycle - 3 quarters each
Monthly Cycle - 1 week each
Weekly Cycle - 1 day each*
Daily Cycle - 6 hours each
Session Cycle - 90 minutes each
*Monday to Thursday, Friday has its own specific function .
Annual Cycle:
Q1 JANUARY - MARCH
Q2 APRIL - JUNE
Q3 JULY - SEPTEMBER
Q4 OCT - DECEMBER
Monthly Cycle**:
Q1 FIRST WEEK
Q2 SECOND WEEK
Q3 THIRD WEEK
Q4 FOURTH WEEK
Weekly Cycle*:
Q1 MONDAY
Q2 TUESDAY
Q3 WEDNESDAY
Q4 THURSDAY
Daily Cycle:
Q1 ASIA
Q2 LONDON
Q3 NEW YORK
Q4 AFTERNOON
**Monthly Cycle starts with the first full week of the month.
*Friday has its own cycle, which is why it is not listed.
Q1 indicates the quarters that follow.
If Q1 expands, Q2 is likely to consolidate.
If Q1 consolidates, Q2 is likely to expand.
TRUE OPENS
True price opens are the beginning of Q2 in each cycle. It validates key levels.
What are the true opens?
Yearly: First Monday of April (Q2)
Monthly: Second Monday of the month (Q2)
Weekly: Second daily candle of the week
Daily: Start of the London session (6 hours after the open of the daily candle)
Asia - London - NY - Evening: 90 minutes after the open of the 6-hour candle.
DIAGRAM:
Q1 (A) Accumulation - Consolidation.
Q2 (M) Manipulation - Judas Swing (Trade this).
Q3 (D) Distribution (Trade this).
Q4 (X) Continuation - Reversal of the previous quarter.
Q1 (X) Continuation - Reversal of the previous quarter.
Q2 (A) Accumulation - Consolidation.
Q3 (M) Manipulation - Judas Swing (Trade this).
Q4 (D) Distribution (Trade this).
ANNUAL CYCLE:
MONTHLY CYCLE:
WEEKLY CYCLE:
DAILY CYCLE:

UNDERSTANDING CHART/CANDLESTICK PATTERNSTRADEWITHKENNY
EDUCATIVE : The circled hammer candlestick on the chart confirms strong buying pressure on XAUUSD . As shown, the market broke through the key resistance level at 2,923.22 , continuing its upward movement.
I’ll be watching for buy opportunities on a retest of the previous key level at 2,923 . However, if the price breaks below this zone, it could move lower toward the key levels where the hammer candlestick initially formed.
KEY LEVELS : 2,923.22 , 2,911.85 , 2,906.77
CONCLUSION : Understanding chart patterns and market structure is crucial for trading success. Learning the market requires consistency, regardless of the losses you may encounter along the way.
Disclamer : This is my personal view and should not be considered financial advice.

How to manage your money in a way to get out of a bull traplet's say for example you bought 50 shares of BITX (bitcoin 2X bullish) on March 07, at Pivot for $45.50, and now you along with a lot of other longs are trapped.
Each time the market rallies other bulls get out at a loss on every rally. Causing another downturn.. trapping you further.
IF Your strategy is like mine so you won't close the trade in a loss, but you are wasting valuable time.
Also suppose you have 30 or 40% of your overall portfolio that is reserved for shorting.
When you take profits on the shorts, instead of saving the money for yor next short, you buy 50 more shares at the current market price of 37.
Now you can get out halfway to your original target, at $41 by selling both, at the same time. you made money on your long, enough to eliminate the loss if you sold the first lot below your original target.
In this example you can sell at $41, which is a lot easier to reach than $45 which might take another week. To determine the level you an get out simply add the two prices and divide by 2.

Breaking the Trading Matrix: Lessons from The Matrix MovieThe Matrix is more than just a movie—it’s a mind-expanding experience that continues to offer new insights, no matter how many times you watch it. Beyond its philosophical depth and action-packed sequences, the film carries powerful lessons that can be applied to trading.
Just like in The Matrix, financial markets blur the line between reality and illusion. Success in trading requires a shift in perception, a willingness to embrace harsh truths, and the ability to decode the underlying structure of the market.
Let’s break down the key trading lessons inspired by The Matrix.
🕶️ Building Confidence: The Neo Path
Remember Neo’s journey? He started as Thomas Anderson—doubtful and uncertain—before transforming into the confident savior of humanity. This mirrors a trader’s evolution:
• You start hesitant and unsure.
• Greed and ego take over.
• The market humbles you with losses.
• You develop an edge, learning from experience.
• Over time, confidence and resilience grow.
Like Neo, every trader faces setbacks. But every setback is a setup for a comeback. Persistence and adaptation are key.
🏃♂️ Confirmation Bias: Dodging the Bullet
One of the most iconic scenes in The Matrix is Neo dodging bullets, bending reality to his advantage. Traders must do the same by reshaping their biases.
If you only seek confirmation for your trades, you’ll ignore critical counter-signals. To avoid this trap:
✅ Develop a trading system based on logic, not emotion.
✅ Seek diverse viewpoints instead of reinforcing your bias.
✅ Accept that the market moves on probabilities, not personal beliefs.
Dodge the confirmation bias bullet, and you’ll become a more objective and adaptable trader.
🔴 Take the Red Pill: Embrace Reality
In The Matrix, the red pill symbolizes awakening to the truth. In trading, taking the red pill means accepting the realities of the market:
❌ Traders who take the blue pill:
• Chase high win rates.
• Refuse to accept losses.
• Gamble with oversized positions.
✅ Traders who take the red pill:
• Accept risk as part of the game.
• Prepare for inevitable losses.
• Understand that past performance does not guarantee future results.
Those who ignore market realities are doomed to fail. Take the red pill and see the market for what it truly is.
🥄 There Is No Spoon: The Power of Perspective
In the famous "There is no spoon" scene, Neo learns that reality is shaped by perception. The same applies to trading:
• The market isn’t your enemy—your perception of it is.
• Stop trying to “bend” the market to your will.
• Instead, bend your mind to adapt to market conditions.
Traders who develop flexibility thrive, while those who resist change break.
🔢 Understand the Code – Understand the Matrix
Neo eventually sees the code behind The Matrix. Similarly, traders must understand the market’s underlying structure:
📊 Price Action
📈 Volume
📉 Probabilities
Markets move up, down, and sideways. Your job is to recognize patterns and decode them. The more you understand the code, the more clarity you gain in your trades.
👨💼 Agent Smith and Market Manipulators
Just as Agent Smith was a virus in The Matrix, market manipulators exist to exploit uninformed traders. Beware of:
🚨 Extreme volatility
📉 Unusual price gaps
❌ Pump-and-dump schemes
Stay vigilant and avoid manipulated markets that can drain your capital.
🏋️ Training Simulation: Practice Makes Perfect
Before Neo fought in the real world, he trained in simulated battles. Traders should do the same before risking real money:
✅ Backtest strategies to refine your edge.
✅ Use demo accounts to practice execution.
✅ Paper trade to gain confidence before going live.
Mistakes in training are free. Mistakes in live trading cost money. Train smartly.
🕶️ Morpheus’s Faith: Belief in Yourself
Morpheus believed in Neo before Neo believed in himself. Traders must also develop unwavering self-belief:
✔️ Trust your analysis.
✔️ Stick to your system.
✔️ Make decisions with confidence.
Doubt and hesitation lead to poor execution. Confidence, backed by preparation, leads to success.
🏛️ The Architect’s Plan: Strategy is Key
The Architect had a plan for The Matrix—every possible outcome was accounted for. Traders need the same level of structure:
📝 Develop a clear trading strategy.
🎯 Stick to your plan, even when emotions flare up.
⚖️ Adjust when necessary, but never trade impulsively.
Without a plan, you’re just another gambler in the market.
🧘 Free Your Mind: Emotional Control
Neo’s final test was to free his mind. In trading, emotional control is the ultimate skill:
✅ Backtest your system to understand market behavior.
✅ Risk less until you're comfortable with losses.
✅ Trade small before increasing position sizes.
Your worst enemies in trading?
❌ Ego
❌ Fear
❌ Greed
Master them, or the market will master you.
🔥 Final Words: The Path to Financial Awakening
Trading, like The Matrix, is a journey of self-discovery, discipline, and adaptation. If you want to break free from the illusion of quick riches and truly understand the market, you must:
📌 Develop confidence and resilience.
📌 Avoid confirmation bias and seek objective perspectives.
📌 Accept the harsh realities of trading.
📌 Adapt to market conditions instead of resisting them.
📌 Learn to read price action, volume, and probabilities.
📌 Stay vigilant against market manipulation.
📌 Practice before going live.
📌 Believe in yourself and your system.
📌 Have a structured plan and execute with discipline.
📌 Master your emotions to make rational decisions.
The real question is: Are you ready to free your mind and take control of your trading destiny?

Trading Psychology or Technical Analysis—When Mind Meets MatterThere’s an age-old battle in trading that makes the bull vs. bear debate look like a game of pickleball (no offense, finance bros). It’s the clash between the traders who swear by their charts and the ones who insist it’s all about mindset.
The technicals versus the psychologicals. Fibonacci retracements versus fear and greed. RSI versus your racing heart.
TLDR? Both matter—a lot. But knowing when to trust your indicators, when to trust yourself, and when to blend both is the fine line that separates those who thrive from those who rage-quit.
⚔️ The Cold, Hard Numbers vs. the Soft, Messy Brain
Think of technical analysis as your sometimes inaccurate GPS in trading. It’s structured, predictable, and gives you clear entry and exit points—until it doesn’t. Because markets, much like a GPS in a tunnel, don’t always cooperate.
That’s where psychology creeps in. Your mind is the ultimate trading algorithm, but it’s often running outdated software. Fear of missing out? That’s just your brain throwing a tantrum. Revenge trading? A glitch in emotional processing. Overconfidence after three wins in a row? Well done, you genius.
Technical analysis gives you signals, but trading psychology determines how you act on them.
🤷♂️ When the Chart Says One Thing, and Your Brain Says Another
Picture this: You’ve mapped out the perfect setup. The moving averages align, volume confirms the breakout, and everything screams BUY .
But then your brain whispers, What if it reverses? What if this is a trap? What if I’m about to donate my account balance to the market gods?
You hesitate. The price moves without you. Now, frustration kicks in, and suddenly, you’re clicking BUY at the worst possible moment—just in time for a pullback.
Sometimes, the best trade is the one you don’t take. And sometimes, trusting the chart over your overthinking brain is the only way forward.
🔥 The Big Guys and Their Choices
Legendary investors have picked their sides in this debate. Howard Marks, the co-founder of Oaktree Capital, has long been a big believer in market psychology. He argues that understanding investor sentiment is more valuable than any chart pattern because markets are driven by cycles of greed and fear.
On the other hand, Paul Tudor Jones—one of the greatest traders of all time—leans on technicals, famously saying, “The whole trick in investing is: ‘How do I keep from losing everything?’ If you use the 200-day moving average rule, you get out. You play defense.”
Both approaches work. The question is: Are you the type who deciphers market mood swings, or do you trust that a well-placed moving average will tell you when to cut and run?
🌀 Overtrading: The Technical Trap and the Psychological Spiral
Overtrading usually starts with a good trade, a small win, and a rush of dopamine that convinces you you’ve cracked the code. So, you take another trade. Then another. And before you know it, you’re firing off entries like a caffeinated gamer, except your PnL is the one taking the damage.
Technical traders fall into this trap because they see too many setups. Every candlestick pattern, every little bounce, every “potential” breakout becomes a reason to trade.
Psychological traders, on the other hand, may overtrade out of boredom, frustration, or the need to “make back” losses.
The result? An emotional rollercoaster that ends with an account balance you don’t want to check the next morning.
The fix? Trade selectively. The best setups don’t come every five minutes, and forcing trades is like forcing a bad joke—it just doesn’t land.
💪 Fear, Greed, and the Art of Holding Your Ground
Every trader knows the feeling: You’re in profit, but instead of letting the trade play out, you close early because profit is profit, right?
Wrong.
Fear of losing profits is what keeps traders from maximizing their wins. And greed—the evil twin of fear—is what makes traders hold losing trades, hoping for a miracle. It’s the classic “let winners run, cut losers short” rule in reverse.
Technical traders know where their stops and targets are. The problem? They often ignore them when emotions take over. Psychological traders “feel” the market but get crushed when that gut feeling betrays them.
The best traders find the balance—using technicals to set logical targets and psychology to actually stick to the plan.
🤝 The Solution? A System That Checks Both Boxes
So, what’s the verdict? Do you put matter over mind or mind over matter?
The truth is, great traders do both. They develop strategies based on technicals but manage execution with discipline. They respect risk management rules not just because the chart says so, but because they know how destructive emotions can be.
Here’s what the best do differently:
✅ They journal trades —not just the setups but how they felt during the trade.
✅ They stick to a trading plan so they can trust their system over impulse.
✅ They set rules that help them to properly bounce back from losses .
✅ They know the value of knowledge and never stop learning. (We’ve got you covered here, too. Go check the Top Trading Books if you’re a trader and stop by the Top Books on Investing if you’re an investor).
💚 Final Thoughts: Mind and Market in Harmony
In the end, trading is never just one or the other. It’s not pure math, and it’s not pure mindset. It’s a dance between structure and instinct, strategy and psychology. The ones who get it right aren’t just great at reading charts—they’re great at reading themselves.
Fair Value Gaps vs Liquidity Voids in TradingFair Value Gaps vs Liquidity Voids in Trading
Understanding fair value gaps and liquidity voids is essential for traders seeking to navigate the complexities of the financial markets. These concepts, deeply rooted in the Smart Money Concept (SMC), provide valuable insights into the dynamics of supply and demand, helping to identify potential price movements. In this article, we’ll delve into both ideas, exploring their characteristics, differences, and use in trading.
Fair Value Gap (FVG) Meaning in Trading
A fair value gap, also known as an imbalance or FVG, is a crucial idea in Smart Money Concept that sheds light on the dynamics of supply and demand for a particular asset. This phenomenon occurs when there is a significant disparity between the number of buy and sell orders for an asset. They occur across all asset types, from forex and commodities to stocks and crypto*.
Essentially, a fair value gap in trading highlights a moment where the market consensus leans heavily towards either buying or selling but finds insufficient counter orders to match this enthusiasm. On a chart, this typically looks like a large candle that hasn’t yet been traded back through.
Specifically, a fair value gap is a three-candle pattern; the middle candle, or second candle, features a strong move in a given direction and is the most important, while the first and third candles represent the boundaries of the pattern. Once the third candle closes, the fair value gap is formed. There should be a distance between the wicks of the first and third candles.
Fair value gaps, like gaps in stocks, are often “filled” or traded back through at some point in the future. They represent areas of minimal resistance; there is little trading activity in these areas (compared to a horizontal range). Therefore, they are likely to be traded through with relative ease as price gravitates towards an area of support or resistance.
Liquidity Void Meaning in Trading
Liquidity voids in trading represent significant, abrupt price movements between two levels on a chart without the usual gradual trading activity in between. These are essentially larger and more substantial versions of fair value gaps, often encompassing multiple candles and FVGs, indicating a more pronounced imbalance between buy and sell orders.
While FVGs occur frequently and reflect the day-to-day shifts in market sentiment, liquidity voids signal a rapid repricing of an asset, typically following significant market events (though not always).
These voids are visual representations of moments when the market experiences a temporary absence of balance between buyers and sellers. This imbalance leads to a sharp move as the market seeks a new equilibrium price level. Such occurrences are not limited to specific times; they can happen after major news releases, during off-market hours, or following large institutional trades that significantly move the market with a single order.
Liquidity voids are especially noteworthy on trading charts due to their appearance as particularly sharp moves. Though they appear across all timeframes, they’re most obvious following major news events when the market rapidly adjusts to new information, creating opportunities and challenges for traders navigating these shifts.
Fair Value Gap vs Liquidity Void
Fair value gaps and liquidity voids are effectively the same thing in practice; a fair value gap is simply a shorter-term liquidity void. Both indicate moments of significant imbalance between supply and demand. At the heart of both phenomena is a situation where one significantly outweighs the other, leading to strong market movements with minimal consolidation. The distinction between them often comes down to scale and timeframe.
An FVG is typically identified by a specific three-candle pattern on a chart, signalling a discrete imbalance in order volume that prompts a quick price adjustment. These gaps reflect moments where the market sentiment strongly leans towards buying or selling yet lacks the opposite orders to maintain price stability.
Liquidity voids, on the other hand, represent more pronounced movements in a given direction, often visible as substantial price jumps or drops. They can encompass multiple FVGs and extend over larger portions of the chart, showcasing a significant repricing of an asset.
This distinction becomes particularly relevant when considering the timeframe of analysis; what appears as a series of FVGs on a lower timeframe can be interpreted as a liquidity void. On a higher timeframe, this liquidity void may appear as a singular fair value gap. This can be seen in the fair value gap example above.
For traders, it’s more practical to realise that both FVGs and liquidity voids highlight a key market phenomenon: when a notable supply and demand imbalance occurs, it tends to create a vacuum that the market is likely to fill at some future point. Therefore, it’s important to recognise that both these types of imbalances can act as potential indicators of future price movement back towards these unfilled spaces.
Trading Fair Value Gaps and Liquidity Voids
Trading strategies that leverage fair value gaps and liquidity voids require a nuanced approach, as these concepts alone may not suffice for a robust trading strategy. However, when integrated with other aspects of the Smart Money Concept, such as order blocks and breaks of structure, they can contribute significantly to a comprehensive market analysis framework.
Primarily, both FVGs and liquidity voids signal potential areas through which the price is likely to move rapidly to reach more significant zones of trading activity, such as order blocks or key levels of support and resistance.
This insight suggests that initiating positions directly within an FVG or a liquidity void may not be effective due to the high likelihood of the price moving swiftly through these areas. Instead, traders might find it more strategic to wait for the price to reach areas where historical trading activity reflects stronger levels of buy or sell interest.
Additionally, these market phenomena can inform the setting of price targets. If there is an FVG or liquidity void situated before a key area of interest, targeting the zone beyond the gap—where substantial trading activity is expected—could prove more effective than aiming for a point within the gap itself.
It's also useful to note the relative significance of these features when they appear on the same timeframe. An FVG, being generally smaller and indicating a discrete order imbalance, is more likely to be filled before a liquidity void. This is because liquidity voids represent more considerable and pronounced market movements that can set market direction, marking them as less likely to be filled within a short space of time.
Limitations of Fair Value Gaps and Liquidity Voids
While fair value gap trading strategies and the analysis of liquidity voids offer insightful approaches to understanding market dynamics, they come with inherent limitations that traders need to consider:
- Market Volatility: High volatility can unpredictably affect the filling of fair value gaps and liquidity voids, sometimes leading to incorrect analysis or false signals.
- Timeframe Relativity: The significance and potential impact of gaps and voids can vary greatly across different timeframes, complicating analysis.
- Incomplete Picture: Relying solely on these phenomena for trading decisions may result in an incomplete market analysis, as they do not account for all influencing factors.
- Expectations: There is no guarantee that a FVG/void will be filled soon or at any point in the near future.
The Bottom Line
As we conclude, it's essential to remember that while fair value gap and liquidity void strategies provide valuable insights, they’re part of a broader spectrum of SMC tools available to traders. They’re best combined with other analytical techniques to form a comprehensive approach to trading.
For those looking to delve deeper into trading strategies and enhance their market understanding, opening an FXOpen account can be a step toward accessing a wide array of resources and tools designed to support your trading journey.
FAQs
What Is a Fair Value Gap?
A fair value gap occurs when there's a significant difference between the buy and sell orders for an asset, indicating an imbalance that can influence market prices.
What Are Fair Value Gaps in Trading?
In trading, fair value gaps reflect moments where market sentiment strongly favours either buying or selling, creating potential price movement opportunities.
What Is the Difference Between a Fair Value Gap and a Liquidity Void?
The main difference lies in their scale: a fair value gap is typically a smaller, discrete occurrence, while a liquidity void represents a larger, more pronounced price movement.
How to Find Fair Value Gaps?
Traders identify fair value gaps by analysing trading charts for areas where rapid price movements have occurred. A FVG consists of three candles, where the second one is the largest and the first and third serve as barriers. The idea of the FVG is that it leads to a potential retracement to fill the gap in the future.
Is a Fair Value Gap the Same as an Imbalance?
Yes, a fair value gap is the same as an imbalance in the Smart Money Concept.
*Important: At FXOpen UK, Cryptocurrency trading via CFDs is only available to our Professional clients. They are not available for trading by Retail clients. To find out more information about how this may affect you, please get in touch with our team.
This article represents the opinion of the Companies operating under the FXOpen brand only. It is not to be construed as an offer, solicitation, or recommendation with respect to products and services provided by the Companies operating under the FXOpen brand, nor is it to be considered financial advice.

Predicting sell off, 30"++ in advance of a head and shouldersLet's examine how a head and shoulders is usually formed by a wave 4 and 5 and an A & B wave, the C wave is the sell off after the head and shoulders.
I use this pattern to predict a head and shoulders AT THE RIGHT NECKLINE. In this case 90 minutes in advance.. So 6 X 15 minute candles in advance we can predicted a H & S and a selloff, sound valubale?
if you understand this concept please give a thumbs up.
To go over price action again, we are going up on 5 waves. Wave 4 creates the left shoulder. After wave 5 we come down on an A wave, that is the right neckline.
This is where You can predict an B wave UP, and if it doesn't go higher than the previous wave 5, we will get a typical head and shoulder sell off after the wave B up.

TradeCityPro Academy | Dow Theory Part 3👋 Welcome to TradeCityPro Channel!
Welcome to the Educational Content Section of Our Channel Technical Analysis Training
We aim to produce educational content in playlist format that will teach you technical analysis from A to Z. We will cover topics such as risk and capital management, Dow Theory, support and resistance, trends, market cycles, and more. These lessons are based on our experiences and the book The Handbook of Technical Analysis.
🎨 What is Technical Analysis?
Technical Analysis (TA) is a method used to predict price movements in financial markets by analyzing past data, especially price and trading volume. This approach is based on the idea that historical price patterns tend to repeat and can help traders identify profitable opportunities.
🔹 Why is Technical Analysis Important?
Technical analysis helps traders and investors predict future price movements based on past price action. Its importance comes from several key benefits:
Faster Decision-Making: No need to analyze financial reports or complex news—just focus on price patterns and trading volume.
Better Risk Management: Tools like support & resistance, indicators, and chart patterns help traders find the best entry and exit points.
Applicable to All Markets: Technical analysis can be used in Forex, stocks, cryptocurrencies, commodities, and even real estate.
In the previous session, we explained Principles 3 and 4 of the Dow Theory. Be sure to review and study them, and if you have any questions, let us know in the comments.
📑 Principles of Dow Theory
1 - The Averages Discount Everything (Not applicable to crypto)
2 - The Market Has Three Trends
3 - Trends Have Three Phases
4 - Trend Continues Until a Reversal is Confirmed
5 - The Averages Must Confirm Each Other
6 - Volume Confirms the Trend
📈 Principle 5: Trends Persist Until a Clear Reversal Signal Appears
Full Explanation:
Dow Theory says that once a market picks a direction—like going up (bullish trend) or down (bearish trend)—it keeps moving that way until something big and obvious says, “Nope, we’re turning around!” Think of it like momentum: the market’s lazy and sticks to its path unless it gets a solid reason to switch.
What’s a Trend? It’s the market’s overall direction. Uptrend means higher highs and higher lows (prices keep climbing). Downtrend means lower highs and lower lows (prices keep dropping). Sideways means it’s stuck in a range.
What’s a Reversal Signal? In an uptrend, if prices stop making new highs and start forming lower highs and lows, plus break a key level (like support), that’s a sign the trend’s flipping. In a downtrend, it’s the opposite—higher highs and lows plus breaking resistance mean it’s turning up.
Why Does This Happen? Markets reflect crowd behavior. When everyone’s buying or selling, the trend builds steam and doesn’t stop until the crowd’s mood shifts big-time.
Key Point: Small dips or spikes don’t count. A little drop in an uptrend? Normal. You need a clear pattern or a big break to call it a reversal.
Practical Use: Traders use this to avoid panic-selling on tiny moves and wait for strong signals before jumping ship.
Simple Example:
It’s like riding a bike downhill—you keep rolling fast until you hit a wall or slam the brakes.
📊 Principle 6: Trends Must Be Confirmed by Volume
Full Explanation:
This principle says a trend isn’t legit unless trading volume backs it up. Volume is how much is being bought or sold. If the trend’s real, volume should match it—high volume means lots of people are in on it, low volume means it might be fake or weak.
Uptrend: Prices rising with growing volume? That’s a strong bull run—buyers are all in. Prices up but volume’s tiny? Could be a fluke or manipulation.
Downtrend: Prices falling with big volume? Sellers mean business—bear trend’s solid. Falling prices with low volume? Might just be a quick dip, not a real crash.
How Volume Confirms: It’s like a lie detector for trends. Big volume says, “This move’s for real!” Low volume says, “Eh, don’t trust it yet.”
Extra Detail: In an uptrend, if volume starts dropping, it’s a warning—buyers might be losing steam. In a downtrend, low volume could mean sellers are running out of ammo, hinting at a bounce.
Why It Matters? Dow believed volume shows the market’s true energy. No crowd, no power—simple as that.
Practical Use: Traders check tools like OBV (On-Balance Volume) or volume bars. If a stock jumps but volume’s dead, they might skip it it’s a trap.
Simple Example:
It’s like a party if tons of people show up dancing, it’s a real vibe. If just two guys are there, it’s probably lame.
🎉 Conclusion
We’ve reached the end of today’s educational segment! We’ll start by explaining all of Dow Theory’s principles, and in the future, we’ll move on to chart analysis and the strategy I personally use for trading with Dow Theory. So, make sure you fully grasp these concepts first so we can progress together in this learning journey!
💡 Final Thoughts for Today
This is the end of this part, and I must say we have a long journey ahead. We will continually strive to produce better content every day, steering clear of sensationalized content that promises unrealistic profits, and instead, focusing on the proper learning path of technical analysis.
⚠️ Please remember that these lessons represent our personal view of the market and should not be considered financial advice for investment.

Two Stock Market Crashes explained in one chart(ELLIOTT)The first is the Dot-Com Bubble that happened in Early 2000. This was the end of Wave 1(Black) and a retest was on the horizon. The market corrected with a zigzag marked in Red late in March 2000. What followed was a sharp drop Wave A(Red), B correction, and a 5 Wave move to complete Wave C of the zigzag. The 5 Wave move to Red Wave C is supported by Math as it retests at exactly at the 423% of the Fibonacci and 161.8% of Red Wave A on a Monthly time frame.
The second Stock Market Crash is the Financial Crisis of 2008 which by the way is the largest Stock Market Crash in the last 80 yrs. Historically, it is only second to the Great Depression of 1929. Can it be explained in terms of Elliott Wave? Yes. It was part of Wave 5 after Green Wave C ended. In fact, from Blue Wave 4/C there is a clear 5 wave move with a zigzag as its first correction and a flat as its second. The Financial Crisis is Wave 5 after the mentioned second flat but is called a Stock Market Crash!!
All this is avoidable.
