Understanding Turtle Soup: A Dive Into Liquidity Raids📍 Turtle Trading
Turtle Soup is a distinctive trading strategy developed by Linda Bradford Raschke, as detailed in her acclaimed book, “Street Smarts: High Probability Short-Term Trading Strategies.” This strategy draws inspiration from another well-known approach called Turtle Trading, which gained prominence in the early 1980s through legendary traders Richard Dennis and William Eckhardt.
The term "Turtles" refers to a group of traders who participated in an ambitious experiment conducted by Dennis and Eckhardt in 1983. Dennis affectionately dubbed his students “turtles,” inspired by the turtle farms he visited in Singapore. This charming nickname symbolized his belief that, just like the turtles in those farms, he could help his traders grow rapidly and efficiently within the competitive landscape of the financial markets. Together, these strategies reflect innovative approaches to trading that continue to influence market participants today.
📍 Essence of the Turtle Trading Strategy
The essence of the Turtle Trading strategy lies in trend following. This approach is articulated through a set of straightforward rules:
Long Positions: Traders consider entering long positions when the price breaks above a predefined high. This break signals a potential upward trend, prompting traders to capitalize on upward momentum.
Short Positions: Conversely, traders look to enter short positions when the price breaks below a predefined low. This break indicates a potential downward trend, allowing traders to profit from falling prices.
These simple yet effective rules enable traders to identify and take advantage of trending markets, helping them make informed trading decisions based on price action. The Turtle Trading strategy has become a cornerstone in the world of systematic trading.
📍 Turtle Soup Strategy
Linda Raschke's Turtle Soup strategy takes a contrarian approach to the traditional Turtle Trading method. While the classic Turtle Trading strategy advocates for going long after a breakout above a recent high and shorting after a breakout below a recent low, Turtle Soup implements a reversal of this idea, focusing on "false breakouts."
📍 Key Elements of Turtle Soup:
Long Positions: The strategy suggests opening a long position when the price breaks below the 20-day low. This might initially appear counterintuitive, as it involves buying after a dip. However, the premise is that a breakout may attract sellers, and once prices decrease sufficiently, the market could reverse, allowing traders to profit from a bounce back upwards.
Short Positions: Conversely, a short position is initiated when the price breaks above the 20-day high. In this case, the idea is that many breakouts fail to sustain momentum. Following the initial price surge above resistance, sellers might step in, leading to a price reversal, thus creating an opportunity for a profitable short position.
The Turtle Soup strategy is based on the observation that breakouts do not always result in continued price movement in the breakout direction. Many breakouts can be "false," meaning that after an initial push, prices trend back in the opposite direction. By capitalizing on these potential reversals, traders using Turtle Soup hope to benefit from the corrections that often follow breakouts.
📍 Smart Money
ICT methodology emphasizes a strategic approach often referred to as "smart money." This approach involves leveraging liquidity in the market, specifically through stop orders strategically placed behind price swings to establish trading positions.
Here's how the process unfolds: liquidity situated just beyond recent highs—known as Buy Stops or Buyside Liquidity—is typically utilized to initiate short positions. Conversely, liquidity positioned below recent lows, referred to as Sell Stops or Sellside Liquidity, is exploited to trigger long positions.
This sophisticated trading strategy is versatile and applicable not only in short-term trading scenarios but also during breakouts above the 20-day highs and minima. Furthermore, it can be effectively employed in intraday trading, scalping, and various other trading methodologies, thanks to the fractal nature of price action in the markets.
Examplse
📍 Strategy Application
A key distinction in applying this trading strategy lies in the differing approaches of notable traders. Linda Raschke emphasizes the pursuit of liquidity within a 20-day timeframe, focusing solely on the movements of recent highs and lows.
In contrast, smart money practitioners implement this methodology across shorter timeframes, enhancing their strategy with liquidity zones. ICT has further refined this approach, broadening its scope and elucidating the rationale behind price behavior through the lens of market efficiency. By doing so, ICT provides traders with a deeper understanding of how to navigate and capitalize on market dynamics effectively.
Traders, If you liked this educational post🎓, give it a boost 🚀 and drop a comment 📣
Fundamental Analysis

Must-Read Investing Books: The Top 5 for Every InvestorWelcome to Part 2 of our must-read book series. Last time, we took a deep dive into the fast-paced world of trading, giving you the trading must-reads to sharpen your short-term, high-risk market chops.
Now it's time to slow down and shift into a lower gear. Trading is a thrill, but investing is where the long game pays off. While trading is about timing, investing is about patience—and, some might even say, good investing is boring. So let’s be real, mastering both is how you dominate.
In this Idea, we’re focusing on the timeless art of investing. Whether you’re gunning for that Warren Buffett-level compound interest or just looking to stack up some dividends, these five books will teach you how to think like an investor. Grab your coffee and your notepad—let’s dive in.
📖 1. The Intelligent Investor
✍️ by Benjamin Graham
We’re kicking things off with the granddaddy of all investing books. Benjamin Graham’s The Intelligent Investor is the Bible of value investing. Benjamin Graham is the father of value investing, and his no-nonsense approach to buying undervalued stocks and waiting for the market to catch up is the gold standard. Graham teaches you how to analyze companies for their intrinsic value, while cautioning against the emotional rollercoaster of market volatility. It’s all about buying low, staying patient, and letting time do its thing.
🔑 Key Insight : Ignore market noise and buy undervalued assets with a long-term view. Stick to your strategy and let time do its thing.
📖 2. Common Stocks and Uncommon Profits
✍️ by Philip Fisher
Philip Fisher introduces growth investing with a focus on buying quality companies. In Common Stocks and Uncommon Profits , Fisher explains his "scuttlebutt" approach—researching a company thoroughly, from its management to its industry (think investigative journalism on a stock). This book is a must-read for those looking to spot the next Apple AAPL or Amazon AMZN before they become household names.
🔑 Key Insight : Invest in great companies with solid growth potential. Deep research is your key to success.
📖 3. The Most Important Thing
✍️ by Howard Marks
Howard Marks is a legend in the world of risk management and value investing, and The Most Important Thing is essentially his playbook. Marks dives deep into risk, market cycles, and contrarian thinking—he teaches you how to avoid getting wrecked by the market’s irrationality. This isn’t your typical book on the topic of investing; it's a mindset shift and an eye-opener—everyone is a genius when markets rise. But what defines the true investing skill is how you perform in tough times.
🔑 Key Insight : Success in investing is more about managing risk than chasing returns. Protect the downside, and the upside will take care of itself.
📖 4. The Little Book of Common Sense Investing
✍️ by John C. Bogle
John Bogle—the finance genius who invented the index fund—drops some serious knowledge in The Little Book of Common Sense Investing . This book strips away the complicated jargon and exclusivity surrounding Wall Street and keeps it simple: low-cost index funds will beat active management in the long run. Bogle’s philosophy is all about minimizing fees and letting compounding work miracles over time.
🔑 Key Insight : Keep it simple. Low fees and long-term compounding are the keys to building wealth.
📖 5. The Essays of Warren Buffett: Lessons for Corporate America
✍️ by Warren Buffett and Lawrence Cunningham
Okay, we all know Warren Buffett is the GOAT when it comes to investing. The Essays of Warren Buffett is a collection of his legendary letters to Berkshire Hathaway BRK.A shareholders, curated and organized to offer a behind-the-curtain insight on everything from corporate governance to value investing. Buffett has a knack for simplifying complex financial ideas, making this book an invaluable resource for investors of any level.
🔑 Key Insight : There’s no better teacher than Buffett when it comes to long-term, value-based investing. His wisdom is timeless and actionable—invest in solid companies with long-term growth prospects, and don’t get distracted by short-term market swings.
📚 Bonus Picks: The Investor’s Library Expansion Pack
Looking for even more wisdom? Here are a few more titles to round out your investing education:
📖 The Snowball by Alice Schroeder
A biography of Warren Buffett, The Snowball takes you inside the mind of the Oracle of Omaha, showing how his investment philosophy developed and how he built his fortune. It’s part investing guide, part life lesson, and all-around a fascinating read.
📖 The Psychology of Money by Morgan Housel
This book explores how our emotions, biases, and behaviors affect our financial decisions. The Psychology of Money breaks down complex financial concepts into easily digestible stories that reveal how investors can avoid the psychological traps that lead to poor decision-making.
📖 One Up on Wall Street by Peter Lynch
Legendary investor Peter Lynch shares his strategy of finding "tenbaggers"—stocks that increase tenfold in value. Lynch teaches that sometimes the best investment ideas are right in front of you—pay attention to the businesses you love and understand.
📖 A Random Walk Down Wall Street by Burton Malkiel
Random Walk argues that trying to time the market is a fool’s errand. Instead, Malkiel promotes the idea of efficient markets, where it’s almost impossible to outperform the market consistently without taking on substantial risk. It's an excellent guide for those who believe in passive investing and long-term strategies.
📖 Mastering the Market Cycle by Howard Marks
Another essential from Howard Marks, Mastering the Market Cycle teaches you how to recognize the ups and downs of the market and adjust your strategy accordingly. Timing the market may be impossible, but understanding its cycles will give you an edge.
And there you have it—five more powerhouse reads to add to your investing library. These aren’t just books; they’re roadmaps from some of the sharpest minds in finance. Whether you’re looking for market cycles with Howard Marks or tapping into Warren Buffett’s timeless wisdom, each of these picks will help you get better in the long game.
The best investors aren’t just lucky—they’re educated, patient, and, most importantly, they’re always learning. So grab a book, dive in, and start stacking knowledge that compounds just like your portfolio should.
💎 Got any personal favorites that didn’t make the list? Drop them in the comments—we’re always down to discover more investing wisdom!

7 Ways to Optimize Your Trading Strategy Like a ProYou’ve got a trading strategy—great. But if you think that’s where the work ends, think again. A good strategy is like a sports car: It’s fast, fun, and dangerous… unless you keep it tuned and under control. And given how volatile modern trading is, yesterday’s strategy can quickly become tomorrow’s account-drainer. So, how do you keep your trading strategy sharp and in profit mode? Let’s dive into seven ways to fine-tune your setup like a pro.
1️⃣ Backtest Like Your Profits Depend on It (Spoiler: They Do)
Before you let your strategy loose in the wild, backtest it against historical data. It’s not enough to say, “This looks good.” Run the numbers. Find out how it performs over different time frames, market conditions, and asset classes — stocks , crypto , forex , and more. If you’re not backtesting, you run the risk of trading blind — use the sea of charting tools and instruments around here, slap them on previous price action and see how they do.
💡 Pro Tip : Make sure to backtest with realistic conditions. Don’t cheat with perfect hindsight—markets aren’t that kind.
2️⃣ Optimize for Risk, Not Just Reward
Everyone gets starry-eyed over profits, but the best traders obsess over risk management. Adjust your strategy to keep risk in check. Ask yourself: How much are you willing to lose per trade? What’s your win-loss ratio? A strategy that promises massive returns but ignores risk is more like a ticking time bomb than a way to pull in long-term profits.
💡 Pro Tip : Use a risk-reward ratio of at least 2:1. It’s simple: risk $1 to make $2, and you’ve got a buffer against losses. Want to go big? Use 5:1 or why not even 15:1? Learn all about it in our Asymmetric Risk Reward Idea.
3️⃣ Diversify Your Strategy Across Markets
If you’re only trading one asset or market, you’re asking for trouble (sooner or later). Markets move in cycles, and your strategy might crush it in one but flop in another. Spread your strategy across different markets to smooth out the rough patches.
💡 Pro Tip : Don’t confuse this with over-trading. You’re diversifying, not chasing every pop.
4️⃣ Fine-Tune Your Time Frames
Your strategy might be solid on the 1-hour chart but struggle on the 5-minute or daily. Different time frames bring different opportunities and risks. Test your strategy across multiple time frames to see where it shines and where it stumbles.
💡 Pro Tip : Day traders? Shorten those time frames. Swing traders? Stretch ’em out. Find the sweet spot that aligns with your trading style.
5️⃣ Stay Agile with Market Conditions
No strategy is perfect for every market condition. What works in a trending market could blow up in a range-bound one. Optimize your strategy to adapt to volatility, volume, and trend shifts. Pay attention to news events , central bank meetings, and earnings reports — they can flip the script fast.
💡 Pro Tip : Learn to identify when your strategy isn’t working and take a step back. Not every day is a trading day.
6️⃣ Incorporate Multiple Indicators (But Don’t Go Overboard)
More indicators = more profits, right? Wrong. It’s easy to fall into the trap of loading up your charts with a dozen indicators until you’re drowning in lines and signals. Keep it simple — combine 3 to 5 complementary indicators that confirm your strategy’s signals, and ditch the rest.
💡 Pro Tip : Use one indicator for trend confirmation and another for entry/exit timing.
7️⃣ Keep Tweaking, But Don’t Blow Out of Proportion
Here’s the rub: There’s a fine line between optimization and over-optimization. Adjusting your strategy too much based on past data can lead to overfitting — your strategy works perfectly on historical data but crashes in live markets. Keep tweaking, but always test those tweaks in live conditions to make sure they hold up.
💡 Pro Tip : Keep a trading journal to track your tweaks. If you don’t track it, you won’t know what’s working and what’s not. Get familiar with the attributes of a successful trading plan with one of our top-performing Ideas: What’s in a Trading Plan?
💎 Bonus: Never Stop Learning
The market’s constantly changing and your strategy needs to change with it. Keep studying, keep testing, and keep learning. The moment you think you’ve mastered the market is the moment it humbles you.
Optimizing a trading strategy isn’t a one-and-done deal—it’s an ongoing process. By fine-tuning, testing, and staying flexible, you can keep your strategy sharp, profitable, and ahead of the curve. Optimize smart, trade smart!

Creating a Balanced Investment PortfolioCreating a Balanced Investment Portfolio
In the vast realm of trading, where platforms like FXOpen play a pivotal role, strategy and skill stand paramount. As the age-old adage goes, 'Don't put all your eggs in one basket.' In the context of trading, this underscores the significance of diversification. Enter the concept of a balanced investment portfolio - an excellent balanced portfolio example, which emerges as an oasis of hope amidst the unpredictable dunes of market volatility.
Understanding the Importance of a Balanced Investment Portfolio
To achieve a balanced investment portfolio, it's crucial to consider the balance of individual components, especially forex, CFDs, stocks, and bonds. For example, a stock portfolio balance refers to the proportion of stocks in relation to other investment types. This balance is pivotal, as stocks often carry higher risks but also higher potential rewards. By understanding their own risk tolerance and learning how to balance portfolio assets effectively, traders can determine the ideal portfolio balance that meets their specific objectives.
Building the Foundation: Investment Basics
Every experienced trader knows that the world of investments is vast, presenting myriad opportunities. Some of the primary investment types include:
- Stocks: These signify ownership in a company and constitute a claim on a fraction of its assets and earnings.
- Bonds: Essentially, when you invest in bonds, you're loaning your money, either to a corporation or the government, in exchange for periodic interest payments plus the return of the bond's face value when it matures.
- Real Estate: Investing in tangible land, buildings, or housing. Given its physical nature, it often acts as a hedge against more volatile markets.
- Mutual Funds: These funds pool money from several investors to invest in a diversified portfolio of stocks, bonds, or other securities.
Central to investment basics is the risk-return tradeoff. Essentially, it highlights that the potential return on any investment is directly proportional to the risk associated with it. In this matrix, diversification emerges as the most effective strategy, helping to spread and, in turn, mitigate risk.
Asset Allocation Strategies
Asset allocation might seem like a complex term, but at its core, it's about ensuring that your portfolio reflects your investment portfolio balance, harmonising your desired risk and reward.
1. Modern Portfolio Theory (MPT)
Introduced by the visionary economist Harry Markowitz in the 1950s, the Modern Portfolio Theory (MPT) has since established itself as a seminal concept in portfolio management. Groundbreaking for its time and still influential today, MPT hinges on a principle that feels intuitive yet was revolutionary upon its debut: diversifying investments to maximise returns while judiciously managing the associated market risk. Central to the MPT is the construct of the 'Efficient Frontier'.
This captivating concept represents a boundary in the risk-return space where portfolios lie if they offer the highest expected return for any given level of risk. In essence, any portfolio residing on the Efficient Frontier is deemed optimal, reflecting a balance where no additional expected return can be achieved without accepting more risk.
2. Strategic Asset Allocation
Here, traders establish a base policy mix — a proportional combination of assets based on expected rates of return for each asset class. It’s a long-haul game, adjusting the portfolio as long-term goals or risk tolerance evolve.
3. Tactical Asset Allocation
A more active management portfolio strategy, this method tries to exploit short-term market conditions. It involves shifting percentage holdings in different categories to take advantage of market pricing anomalies or strong market sectors.
Diversification
In the complex world of investing, understanding how to balance a portfolio is key. Diversification is the guardian against unpredictability. It is the art of spreading investments across various assets or sectors, ensuring that potential adverse events in one area won't unravel the entire portfolio's performance. Essentially, diversification is the protective shield that buffers against market volatility, offering a more stable and consistent growth path for traders.
Geographical Diversification
Globalisation has knit economies closer than ever before, yet each retains unique characteristics influenced by internal and external events. By diversifying investments across continents and countries, traders can leverage these unique attributes.
Sector Diversification
Beyond geography, the global market is segmented into various sectors — technology, healthcare, and finance, to name a few. Each has its growth trajectory, impacted by different factors. Spreading investments across sectors can hedge against unforeseen adversities.
Individual Asset Selection
The keystone of a robust portfolio is the judicious choice of individual assets. Beyond the broad strokes of diversification, the meticulous selection of each asset determines the portfolio's potential success. It's where profound understanding meets strategic decision-making, ensuring that every asset, be it a stock, bond, or commodity, is handpicked to serve the trader's overarching goals and vision. Proper research, encompassing financial performance, management quality, growth potential, and market trends, provides insight, reducing the chances of unwelcome surprises.
Risk assessment is another crucial part of individual asset selection. Risk is an inherent part of investing. However, with rigorous risk assessment, traders can anticipate potential pitfalls. Evaluating the risk associated with each asset and its correlation with others in the portfolio helps in achieving the desired balance.
Monitoring and Rebalancing
In the dynamic dance of markets, continuous oversight and timely adjustments keep a portfolio's rhythm and harmony intact.
- Regular Portfolio Review. The world doesn't stand still, nor do the markets. Regular reviews ensure that the portfolio aligns with the trader's goals and market realities.
- Rebalancing Strategies. Over a period of time, certain investments will experience more rapid growth than others. This can shift the portfolio’s balance, necessitating rebalancing. Rebalancing, whether by reinvesting dividends or selling assets that have appreciated to buy those that have declined, ensures alignment with the desired risk levels and asset allocation strategy.
Conclusion
Crafting a balanced trading portfolio is an art backed by science, strategy, and due diligence. It's an ongoing process requiring constant monitoring and fine-tuning. By keeping a finger on the pulse of global trends, understanding risks, and staying committed to their goals, traders can navigate the choppy waters of global markets effectively. For those eager to embark on or deepen their trading journey, FXOpen offers the platform and tools. To initiate this exciting endeavour, you can open an FXOpen account and explore the dynamic offerings of the TickTrader platform.
This article represents the opinion of the Companies operating under the FXOpen brand only. It is not to be construed as an offer, solicitation, or recommendation with respect to products and services provided by the Companies operating under the FXOpen brand, nor is it to be considered financial advice.

EMOTIONS! Chapter-2In trading, emotions can easily become your biggest enemy, and it's crucial to understand that “you are your own opponent.” The market isn’t against you—it’s neutral, driven by global forces like supply and demand, economic policies, and geopolitical events. It doesn’t care whether you win or lose. The real battle is internal, and your success depends on your ability to manage your emotional responses. Emotions like fear, greed, frustration, and overconfidence are powerful forces that, if left unchecked, can lead to impulsive decisions and costly mistakes. The key to thriving in the forex market is learning how to control those emotions, because if you don’t, they will control you.
I learned this lesson the hard way back in 2016. At the time, I had just started gaining confidence after a string of successful trades. That confidence quickly turned into greed. I started taking bigger risks, convinced that I was riding a winning streak. Then, things turned. The market shifted, and I began losing trades. Instead of stepping back and re-evaluating, I panicked. I felt this urgent need to recover my losses, so I started chasing the market. Every time I saw an opportunity, I jumped on it without thinking, trading out of desperation rather than strategy. I kept telling myself I could make it all back with just one more trade, but the more I tried, the deeper I sank into losses. It felt like the market was conspiring against me, but the truth was, I was sabotaging myself. I was letting my emotions dictate my decisions, and that was the real problem.
Fear took over when I lost, and greed controlled me when I won. I wasn’t sticking to my trading plan, and I wasn’t thinking rationally. Instead of approaching the market with a clear, calm mindset, I was reacting emotionally to every price movement. It was a vicious cycle—each loss made me more desperate to win, and each win made me more overconfident. I was chasing quick fixes, but in reality, I was only digging a deeper hole. That experience was a painful reminder that in forex trading, the market isn’t there to beat you—it’s neutral. *You beat yourself* by letting emotions cloud your judgment and control your actions.
After that tough period in 2016, I knew something had to change. I realized that emotional control was not just a skill—it was a necessity if I wanted to succeed. I had to stop reacting impulsively and start trading with discipline. The first step was getting back to basics: sticking to my trading plan no matter what. I began to follow my risk management rules strictly, using stop-loss orders to protect myself from the emotional urge to "let a trade ride" in the hope of recovery. I also limited the amount of risk I was willing to take on each trade. Instead of chasing profits, I focused on preserving capital and managing risk.
One of the biggest changes I made was learning to step away when my emotions were running high. If I felt myself getting anxious, frustrated, or overexcited, I would close my trading platform and take a break. This gave me the space to regain perspective and come back with a clearer mind. I also started keeping a trading journal, documenting not just my trades but also how I felt during them. This helped me recognize emotional patterns—like when I was more prone to making impulsive decisions—and take steps to prevent them.
Over time, I developed a deeper understanding of how emotions influence trading. I came to realize that *success in forex isn’t about controlling the market—it’s about controlling yourself.* The market will always be unpredictable, but how you respond to that unpredictability determines your outcome. You can’t let fear make you exit a trade too early, nor can you let greed push you into taking unnecessary risks. By learning to control your emotions, you can make decisions based on logic and strategy rather than impulse. I also learned to embrace patience. Trading is a marathon, not a sprint. The best traders are those who wait for the right opportunities and don’t feel the need to constantly be in the market.
Looking back, that difficult year taught me a vital lesson: the market isn’t out to get you; it’s indifferent. You are the only one who can stand in your own way. By mastering your emotions, you can avoid self-sabotage and make rational, calculated decisions that will lead to long-term success. Now, when I trade, I do so with the understanding that my biggest challenge isn’t the market—it’s keeping my emotions in check. Trading with a clear, calm mind has made all the difference, and I know that no matter what the market throws at me, my success or failure depends on how well I manage myself.
Happy Trading!
-FxPocket

IMPORTANT Macroeconomics: What is the trade balance?IMPORTANT Macroeconomics: What is the trade balance?
The trade balance is an important economic indicator that can have a significant influence on the stock markets.
Here is a simple explanation of this concept and its potential impact:
What is the trade balance?
The trade balance represents the difference between the value of a country's exports and imports over a given period.
In other words:
- If a country exports more than it imports, its trade balance is in surplus (positive).
- If a country imports more than it exports, its trade balance is in deficit (negative).
Impact on the stock markets
The influence of the trade balance on the stock markets can vary depending on whether it is in surplus or deficit:
Trade balance surplus
A trade surplus can generally have a positive impact on the stock markets:
- It indicates strong competitiveness of domestic companies in international markets.
- It can strengthen the value of the national currency, which can attract foreign investors.
-Exporting companies may see their shares increase in value.
Trade deficit
A trade deficit can have a negative impact on stock markets:
-It can indicate a weakness in the domestic economy or a loss of competitiveness.
-It can weaken the domestic currency, which can discourage foreign investors.
-The shares of companies dependent on imports may be negatively affected.
Important nuances
It is crucial to note that the impact of the trade balance on stock markets is not always direct or predictable:
-Overall economic context: Other economic factors can attenuate or amplify the effect of the trade balance.
-Investor perception: The reaction of the markets often depends on how investors interpret the trade balance figures in relation to their expectations.
-Specific sectors: Some sectors may be more affected than others by changes in the trade balance.
In conclusion, although the trade balance is an important indicator, its influence on stock markets must be seen in the broader context of the economy and investor sentiment.

How to Trade Gap Up and Gap Down Opening? Full Guide
What is gap up and gap down in trading?
In this article, I will teach you how to trade gap up and gap down opening . You will learn a simple and profitable gap trading strategy that works perfectly on Forex, Gold or any other financial market.
First, let's start with a theory .
A gap up after the market opening is the situation when the market opens higher than it was closed without any trading activity in between.
Above you can see the example a gap up after the market opening on EURGBP.
The price level where the market closed is called gap opening level.
The price level where the market opened is galled gap closing level.
A gap down after the market opening is the situation when the market opens lower than it was closed without trading activity in between.
Here is the example of a gap down after the market opening on WTI Crude Oil.
Why such gaps occur?
There are various reasons why opening gaps occur.
One of the most common one is the release of positive or negative news while the market was closed.
The market opening price will reflect the impact of such news, causing a formation of the gap.
What gap opening means?
Gap openings reflect the sudden change in the market sentiment.
Gap up will indicate a very bullish sentiment on the market while
a gap down will imply very bearish mood of the market participants.
However, the markets do not like the gaps.
With a very high probability, the gaps are always filled by the market very soon.
We say that the gap is filled, when the price returns to the gap opening level.
Above, you can see that after some time, EURGBP successfully closed the gap - returned to gap opening level.
Such a pattern is very reliable and consistent among different financial markets. For that reason, it can provide profitable trading opportunities for us.
You can see that a gap down on WTI Crude Oil was quickly filled and the price returned to the gap opening level.
How to trade gap opening?
Gap Up Trading Strategy
Once you spotted a gap up after the market opening, you should wait for a bearish signal before you sell.
You should look for a sign of strength of the sellers.
One of the most accurate signals is a formation of a bearish price action pattern:
Double top,
Triple top,
Inverted Cup and Handle,
Head and Shoulders,
Symmetrical or Descending Triangle,
Rising Wedge...
Bearish breakout of a trend line / neckline of the pattern will be your signal to sell.
Look at a price action on EURGBP before it filled the gap.
At some moment, the price formed a double top pattern and broke its neckline. That is our signal to sell.
Your stop loss should lie above the highs of the pattern.
Take profit - gap opening level.
Safest entry is on a retest of a broken neckline/trend line of the pattern.
Safest entry point on EURGBP is the retest of a broken neckline of a double top pattern. Stop is lying above its highs. TP - gap opening level.
Gap Down Trading Strategy
Once you spotted a gap down after the market opening, you should wait for a bullish signal before you sell.
You should look for a sign of strength of the buyers.
One of the most accurate signals is a formation of a bullish price action pattern:
Double bottom,
Triple bottom,
Cup and Handle,
Inverted Head and Shoulders,
Symmetrical or Ascending Triangle,
Rising Wedge...
Bullish breakout of a trend line / neckline of the pattern will be your signal to buy .
Let's study the price action on WTI Crude Oil before it filled the gap.
You can see that the price formed a cup and handle pattern.
Bullish breakout of its neckline is a strong bullish signal.
Safest entry is on a retest of a broken neckline/trend line of the pattern.
Your stop loss should lie above the lows of the pattern.
Take profit - gap opening level.
Following this strategy, a nice profit was made.
Always remember that probabilities that the gap will be filled are very high. However, it is not clear WHEN exactly it will happen.
For that reason, you should carefully analyze a price action and wait for a signal, before you open the trade.
That will be your best gap opening trading strategy.
❤️Please, support my work with like, thank you!❤️

The British Pound Is Stronger than the US DollarThe British Pound Is Stronger than the US Dollar: Understanding the Reasons
GBP/USD is the third most actively traded currency pair on the foreign exchange market, after EUR/USD and USD/JPY. It is also one of the oldest pairs traded on forex. The British pound continues to cost more than the US dollar, despite the dollar overtaking it as the global reserve currency.
Why is the British pound stronger than the US dollar? In this FXOpen article, we look at the GBP/USD pair and the factors that keep the British pound strong to help you understand how to trade it.
What Is the GBP/USD Pair?
Currencies are always traded in pairs on foreign exchange markets. GBP/USD refers to the value of the British pound sterling against the US dollar – specifically, how many US dollars traders need to buy one pound. For example, if the GBP/USD exchange rate is 1.28, a trader would need $1.28 to buy £1. How come the British pound is always stronger than the US dollar? The answer is rooted in history.
A Brief History of the GBP/USD Pair
Until World War I, the British pound was the global reserve currency, accounting for over 60% of the world’s debt holdings. It was valued at just under $5. After the war, the US dollar began to strengthen, and by 1944, when the Bretton Woods system was introduced, the pound was pegged at $4.03. The Bretton Woods system fixed the US dollar to the gold price and established it as the unofficial global reserve currency.
After World War II, the value of the USD began to rise, and it overtook GBP as the primary currency used in international trade. The Bretton Woods system began to slowly collapse after 1971, and both the GBP and USD became free-floating, with the US dropping the gold standard. This has resulted in the value of the GBP gradually sliding over the following decades.
The free-float rate made the GBP/USD pair highly volatile.
The pound sterling reached a high of 2.08 against the dollar in 2007 during the global financial crisis, as higher UK inflation raised expectations that the Bank of England would raise interest rates.
In June 2016, the UK’s vote to leave the European Union drove the value of the pound down to the 1.20–1.25 area overnight. That was its lowest level since the collapse of the exchange rate mechanism in 1985 and the largest one-day decline since the end of Bretton Woods. The GBP/USD pair has since largely traded between 1.20-1.40. A notable exception was the start of the COVID-19 pandemic, when investors flocked to the safe haven US dollar amid uncertainty about the economic impact, and the pound fell to 1.16 against the USD.
COVID-19 shutdowns and the loss of European trade following Brexit have weighed on the prospects for the UK economy. At the same time, geopolitical tensions such as the US-China trade war and the Russia-Ukraine conflict have lifted the value of the dollar, as have rising interest rates.
In 2022, the Bank of England was forced to intervene as the value of sterling fell close to a record low of 1.035 against the dollar in response to a crisis of confidence in the UK government, high inflation and unemployment rates, and concerns regarding the domestic economy. However, by April 2023, the pound had recovered and became the best-performing G-10 currency of the year. According to Forbes, the British pound is the world’s fifth strongest currency, while the US dollar is the 10th strongest. The GBP/USD pair has primarily been trading around 1.20-1.30 so far in 2023. Why is the pound still stronger than the dollar?
Is GBP Stronger than USD?
Why is the pound more expensive than the dollar? The value of the GBP against the USD in forex doesn’t solely determine the strength of the US and UK economies. Analysts consider other factors that can question the strength of the pound.
Nominal Value
A currency’s nominal value refers to its value against another currency in forex. As was mentioned above, the nominal value of both currencies changed significantly over time. Although GBP was always more expensive than the US dollar, this conclusion is relatively arbitrary. Also, it’s worth considering the lower number of British pounds in circulation, which is worth £81 billion, compared to $2.33 trillion US dollars, which contributes to the higher value of GBP as of May 2023.
Relative Strength
The strength of a particular currency against another at any point in time is also relative, as it could actually be weaker against other currencies. For example, GBP could rise in value against USD but fall against EUR, AUD and JPY, which would suggest that the relative value of the pound is weaker – just not as weak as the USD. This is because the relative strength is determined not only by the value of one currency against another but by economic data, including inflation, economic growth, and the trade balance, which determine the strength of the overall economy.
To gauge a currency’s real strength, analysts track its value in relation to multiple currencies over time. For instance, the Dollar Index (DXY) measures the value of the USD against a basket of currencies from its key trading partners and competitors, as this is a more accurate measure of its value than a single pair.
Quoting Conventions
The use of GBP/USD as the quoting convention reflects the pound’s strength. For instance, a GBP/USD quote of 1.25 signifies that $1.25 is needed to buy £1.
This quoting convention originated in the late 1900s during the British Empire when the UK had a larger economy than the US. Despite the subsequent shift in economic power, this convention has endured. Since World War I, the US economy has surpassed the UK economy in terms of size.
Modifying quoting conventions is challenging, given how entrenched they are in the financial industry. However, the tradition of quoting GBP/USD in itself does not determine the value of the pound and the dollar.
Purchasing Power Parity (PPP)
While the GBP/USD trading value suggests the pound is stronger, the purchasing power parity (PPP) fluctuates. PPP indicates how much a currency is worth based on the value of a basket of goods. In these terms, the dollar can be stronger than the pound.
The concept underlying PPP is that the exchange rate should equalise the purchasing power of each currency within its respective country. For instance, if a basket of items costs £100 in the UK with a GBP/USD exchange rate of 1.15, the PPP would suggest that the equivalent cost of the same basket in US dollars should be $115.
In practice, exchange rates frequently diverge from their PPP levels. The degree to which a currency such as GBP or USD deviates from its PPP indicates its relative strength or weakness against another currency.
Global Economy
Although the US economy is stronger than that of Great Britain, sterling’s history as the former global reserve currency and political and economic power have contributed to its strength. The pound is one of the world’s oldest currencies, having been introduced in the 1400s. The UK remains a major global financial centre, and the Bank of England continues to participate in international economic developments.
What Factors Affect GBP/USD
There are several factors that affect the value of the British pound and US dollar:
- US Federal Reserve monetary policy
- Bank of England monetary policy
- Inflation rate, which has a strong impact on the interest rates
- Employment data, which influences government fiscal policy
- Geopolitical events
- Other economic indicators, including retail sales and industrial production
Does It Matter If GBP/USD Falls Below Parity?
A weaker sterling could support UK exports, but it would also increase the cost of imported goods and drive up inflation. The Bank of England would be forced to intervene to contain inflation. As seen in 2022, there is also a risk that a sharp drop in the pound’s value could become disorderly, which could create political and economic turmoil.
However, if the value of the pound fell below the dollar, it would be a psychological milestone for the UK, but it would not have a major impact on the forex market.
Conclusion
The British pound sterling has traditionally maintained a higher value against the US dollar because of historical convention. However, the US dollar is stronger overall as it is the world's reserve currency and has larger trading volumes. The GBP/USD exchange rate has been in a long downtrend. Therefore, there are risks that GBP will soon lose its nominal premium.
Understanding how the British pound is stronger than the US dollar can help you to form strategies to trade the GBP/USD forex pair. By observing economic indicators, you can take a view on how you expect the market to move.
If you are looking to trade forex markets, you can open an FXOpen account. The TickTrader platform allows you to analyse live price charts and trade a range of currency pairs.
This article represents the opinion of the Companies operating under the FXOpen brand only. It is not to be construed as an offer, solicitation, or recommendation with respect to products and services provided by the Companies operating under the FXOpen brand, nor is it to be considered financial advice.

MINDSET! Chapter-1In trading, mindset is arguably one of the most critical factors that can determine whether a trader succeeds or fails over time. While many beginners focus intensely on mastering technical analysis, reading charts, or understanding fundamental market data, experienced traders recognize that none of this knowledge matters without the right mental approach. Forex trading is unique due to its high leverage and volatility, which can lead to large, quick gains but also equally substantial losses. The constant price fluctuations and 24-hour nature of the forex market mean that traders need to be mentally prepared to deal with a dynamic, often unpredictable environment. Therefore, cultivating a strong and resilient mindset is essential for achieving consistent results.
A key aspect of a forex trading mindset is emotional control . Markets are driven by the emotions of participants, and it is easy for novice traders to get caught up in the emotional rollercoaster of trading. Greed , fear , and impatience are the three most dangerous emotions for a trader. Greed can cause a trader to hold on to a winning position for too long, hoping for even bigger profits, only to watch those profits evaporate as the market reverses. Fear can paralyze a trader or cause them to exit trades prematurely, preventing them from realizing potential gains. Impatience, on the other hand, can lead to overtrading, where a trader enters too many positions in an attempt to recover losses or chase profits, often resulting in reckless decisions and further losses. Forex traders with a strong mindset learn to recognize these emotions, manage them, and make decisions based on logic and strategy rather than feelings.
Discipline is another crucial element of a successful trading mindset. Having a solid trading plan or strategy is important, but sticking to that plan with unwavering discipline is what separates professional traders from amateurs. Many traders know the importance of risk management, such as setting stop-loss orders and adhering to a specific risk-to-reward ratio, but when emotions take over, they may abandon their plans in the heat of the moment. For example, after a series of losing trades, a trader might be tempted to increase their position size to "make up" for their losses, often leading to larger risks and bigger losses. Alternatively, after a string of wins, a trader might become overconfident and take on more risk than their strategy allows, which can result in devastating losses when the market turns against them. A disciplined mindset ensures that a trader remains consistent, following their predefined rules no matter the market conditions or emotional state.
Patience is also a cornerstone of the forex trading mindset. Currency markets can be incredibly volatile in the short term, but successful traders understand that profits are generated over time, not by chasing every market move. In forex, it’s common to experience periods of drawdowns or market stagnation, where nothing seems to be happening. During such times, traders who lack patience may become frustrated and enter trades impulsively, often leading to mistakes and unnecessary losses. Those with a patient mindset , however, understand that waiting for high-probability setups is essential for long-term success. They accept that there will be times when it is better to sit on the sidelines than force a trade in unfavorable conditions. Patience also allows traders to wait for the market to confirm their trading ideas, rather than jumping in prematurely based on speculation or hope.
A growth mindset is particularly beneficial in forex trading, as it helps traders continuously improve their skills and adapt to market conditions. A trader with a fixed mindset might view losses as failures and feel discouraged, leading them to give up or stop learning from their mistakes. In contrast, a trader with a growth mindset understands that every trade, whether successful or not, is a learning opportunity. They review their trades, identify what went wrong or right, and adjust their strategy accordingly. This mindset fosters resilience, as traders understand that losses are inevitable in forex trading but can be valuable lessons if approached with the right attitude. Growth-minded traders also seek out continuous education, always looking for ways to refine their techniques, expand their knowledge, and improve their decision-making processes.
Adaptability is another essential trait of a strong forex trading mindset. The foreign exchange market is influenced by a wide range of factors, from global economic indicators to geopolitical events and central bank policies. This means that no single strategy or approach works all the time, and traders must be willing to adjust their tactics as market conditions change. Rigidly sticking to a strategy that worked in a particular market environment can lead to poor performance when those conditions shift. Traders with a flexible mindset remain open to evolving their strategies, using new tools, and experimenting with different approaches while maintaining a disciplined and patient approach.
Developing a successful mindset in forex trading is about much more than just controlling emotions or having a strategy. It involves cultivating discipline, emotional resilience, patience, and a commitment to continuous learning and adaptability. Traders who are able to master their mindset are better equipped to handle the volatility and challenges of the forex market, allowing them to make more rational decisions and, ultimately, achieve long-term profitability. While the technical and analytical aspects of forex trading are important, it is the psychological mastery that often determines who thrives and who struggles in the world of currency trading. By focusing on mindset, traders can improve not only their trading results but also their overall experience in navigating the ups and downs of the forex market.
Within the next few days we will discuss on more of the topics above.
Happy Trading!
-FxPocket

Automated Trading vs Manual TradingAutomated Trading vs Manual Trading
In the modern world of trading, two distinct methodologies exist: manual trading vs algorithmic trading. Both these approaches aim at the same goal - to optimise profit and minimise losses in the financial markets. However, they vary significantly in their operation, the level of involvement required, and the nature of decision-making processes. In this FXOpen article, you will find the key differences between the approaches and their advantages and limitations that may help you to choose the right approach for you.
Definition of Manual Trading
Manual trading signifies the traditional approach to trading. In this method, a trader is actively involved in all aspects of the process. This includes conducting market research, analysing market trends, making buying or selling decisions, and placing trades. The manual approach relies heavily on the trader's skills, knowledge, and experience.
The manual trader uses various tools and methods, including technical and fundamental analyses, to make informed decisions. These methods involve studying past market data, economic indicators, company financials, and market news to predict future market movements. Despite being time-consuming, many traders prefer this approach as it allows them to control their trading activities and make adjustments based on their instincts and experience.
You can test manual trading at the free TickTrader platform.
Definition of Automated Trading
In contrast to human-based investing, automated trading, also known as algorithmic or robo trading, involves the use of computer programs or algorithms to analyse markets and place trades. These algorithms are designed to make trading decisions based on predefined rules and conditions. They can process large volumes of market data, identify market opportunities, and place trades quickly and precisely, something beyond human capability.
Robots can be programmed to follow various strategies based on technical analysis, quantitative analysis, and other principles. These algorithms are typically developed using programming languages and require a high degree of technical expertise.
However, many platforms now offer user-friendly tools for creating and testing algorithms, making auto-trading more accessible to the average trader. Also, some traders ask program developers to create a robot based on their requirements.
Advantages and Disadvantages of Manual Trading Systems
Despite being more traditional, manual investments hold their own advantages and disadvantages.
Advantages:
- The primary advantage of manual trading is the trader’s experience and ability to analyse markets. Unlike robotic systems, human traders can make intuitive decisions based on their experience and understanding of the market. In this case, the results of a duel between robot trading vs manual systems would end up beneficial to humans.
- Another advantage of the manual approach is the flexibility it offers. Manual traders can adjust their strategies and risk tolerance levels based on the changing market conditions, economic news, and their personal comfort level. The manual approach also provides a deeper understanding of the markets, as traders are actively involved in trading.
Disadvantages:
- Self-trading is not without its challenges. It necessitates a substantial commitment of time and focus. Manual traders need to monitor the markets continuously, conduct thorough market analyses, and make decisions. Manual execution of trades may also be emotionally taxing; emotional decisions can often lead to poor trading outcomes.
- In addition, human error can impact trading results. Unlike automated systems, manual traders cannot process large amounts of data quickly and accurately. This limitation can lead to missed trading opportunities or inaccurate decision-making.
Advantages and Disadvantages of Automated Trading Over Manual Trading
Advantages:
- Automated trading offers several advantages over the manual variety. Some of the most significant benefits are speed and accuracy. Automated systems can analyse market data and place trades in milliseconds, which is impossible for humans. Also, algo trading allows for 24/7 activity, as human factors like fatigue or emotions do not constrain it. In this case, the algorithms win in a duel of algo trading vs manual trading.
- Automated systems can handle multiple markets and securities simultaneously, allowing traders to diversify their portfolios more efficiently. By removing the emotional element from speculation, automated systems can help traders stick to their plans and avoid impulsive decisions.
Disadvantages:
- However, the automated approach also has its disadvantages. One of them is the need for a high level of technical expertise to set up and maintain the algorithms. Auto systems also have the risk of over-optimisation, where a system is fine-tuned to perform well based on past data but may not perform well in real market conditions.
- Another challenge with automated trading is its inability to adapt to sudden market changes that a human trader could intuitively understand and respond to. For instance, traders may adjust their strategies accordingly in case of significant economic news or events, but an algorithm might not be capable of such adaptability.
- Lastly, automated systems also carry the risk of technical glitches or system failures, which can lead to significant losses. It is, therefore, essential to regularly monitor and update automated systems.
Does Algo Trading Beat Manual Trading?
The question of "Does algo trading beat manual trading" is a matter of debate. The effectiveness of each trading method depends on various factors, such as the trader's skills and experience, the nature of the market, and the specific strategy used. Some traders may find success with robotics systems due to their speed and accuracy, while others might prefer the control and adaptability offered by manual solutions.
In the world of manual trading vs automated trading in forex, it's essential to consider that FX markets are highly volatile and operate 24/7. This nature of forex markets makes them ideal for automated investing. However, the use of automated systems in FX also requires careful consideration of factors such as market volatility, liquidity, and technical glitches.
Conclusion
Ultimately, the choice between manual and automated investment boils down to personal preference, goals, risk tolerance, and technical expertise. Both methods have their own merits and challenges, and understanding these may help traders make informed decisions.
Whether you are interested in manual or automated trading, platforms like FXOpen provide a robust and user-friendly environment for both.
To get started on your investment journey, you can open an FXOpen account. Regardless of your trading method, remember that success requires a well-developed strategy, continuous learning, and effective risk management. So, keep learning, keep improving, and happy trading!
This article represents the opinion of the Companies operating under the FXOpen brand only. It is not to be construed as an offer, solicitation, or recommendation with respect to products and services provided by the Companies operating under the FXOpen brand, nor is it to be considered financial advice.

Shatter the Comparison Trap: Elevate Yourself Through Self-FocusComparing yourself to others can actually be a beneficial emotion. It's a desire to improve yourself, a drive to strive for excellence, and a way to compete with the best in the field. This can inspire traders to develop their skills, explore new ideas and approaches, take calculated risks, and optimize their time and actions effectively.
However, not everyone knows how to manage their emotions properly. At some point, comparing yourself to others can shift from a motivational force to a detrimental state. Instead of fostering self-improvement, it can lead to what we can call “self-beating up,” where traders become overly critical of themselves. This shift can hinder personal growth and create a cascade of problems.
In this post, we will explore strategies for managing the tendency to compare yourself to others in trading, transforming what can be a potential obstacle into a powerful catalyst for personal and professional growth. Let’s dive into how to effectively harness this emotional state and turn it into a positive driving force on your trading journey.
📍 Causes And Consequences
Comparing your self to others in trading is a common emotion that can emerge when a trader witnesses the success of their peers, often resulting in feelings of resentment or disappointment regarding their own performance. This sentiment can be particularly intense when traders measure themselves against friends, acquaintances, or even anonymous traders in online trading communities. As a result, the pressure to match the achievements of others can lead to negative self-reflection and hinder personal growth in the trading journey.
📍 When Do We Start Comparing Our Trading Journey To Someone Else's ?
🔹 Social Media and Forums: The rise of social media and online forums has made it incredibly easy for traders to share their successes. Seeing others post about their impressive gains or profitabe trades can be discouraging, especially when traders feel that their own results are lacking in comparison.
🔹 Comparing Results: Many traders fall into the habit of constantly measuring their performance against that of others. Witnessing peers excel can lead to dissatisfaction with their own progress and foster a distorted view of their own abilities.
🔹 Novice Success: It's often particularly frustrating to observe newcomers achieve quick success, seemingly with minimal effort. This can breed resentment among more experienced traders and leave them questioning their own skills and strategies.
🔹 Lack of Progress: When traders perceive stagnation or a lack of significant success, they may turn to others for comparison. If they feel they're not advancing as expected, they might increasingly look to peers who appear to be making strides.
🔹 Exaggerated Expectations: Many traders set ambitious targets, such as aiming for a specific percentage of profits within a certain timeframe (e.g., 10% per month). Failing to reach these goals—especially in light of others' apparent successes—can lead to feelings of frustration and inadequacy.
📍 Constantly Comparing Yourself To Others Can Hinder Your Trading Journey
🔹 Overestimating Other People's Strategies: Observing the success of others might prompt traders to impulsively alter their strategies in an attempt to replicate those results. This can result in inconsistency in their trading approach and hinder genuine growth, as they may abandon their own tested methods for strategies that might not align with their trading style.
🔹 Negative Emotions: Consistent comparison can generate negative feelings such as resentment and frustration when faced with another's accomplishments. These emotions can cloud judgment and adversely affect decision-making processes, potentially leading to poor trading choices and increased risk-taking behavior.
🔹 Social Isolation: In some cases, the act of comparison may prompt traders to withdraw from social interactions with more successful peers. This distancing can limit opportunities for collaboration, learning, and mentorship within the trading community, which are crucial for personal and professional development.
🔹 Discussing Other People's Successes: Focusing on and discussing the achievements of others—often in a negative or envious light—can distract traders from recognizing and valuing their own progress. This ongoing comparison can breed a cycle of negativity that diminishes motivation, as traders might overlook their own achievements while fixating on the successes of others.
📍 Constantly Comparing Yourself To Others In Trading Can Harm Your Long-term Success
🔹 Impulsive Decisions: Constantly measuring yourself against others can lead to a desire to catch up or replicate another's success. This urgency may cause traders to take unnecessary risks and make impulsive decisions that deviate from their strategies. Such behavior often results in losses and undermines long-term success.
🔹 Decreased Focus: When traders become fixated on comparisons, they tend to lose sight of their individual trading strategies and personal goals. This distraction can detract from their analytical effectiveness and compromise their decision-making processes, leading to bad results.
🔹 Emotional Burnout: Ongoing comparisons can contribute to feelings of inadequacy and perpetual dissatisfaction, leading to emotional exhaustion. As these feelings accumulate, traders may struggle to maintain motivation and enthusiasm for trading, which is essential for sustained performance.
🔹 Breakdown in Discipline: The pressure to achieve results quickly or to match the performance of more successful traders can erode a trader’s discipline. This might result in erratic trading behavior, divergence from well-established strategies, and heightened vulnerability to losses, thereby jeopardizing their trading journey.
🔹 Frustration and Disappointment: Constantly measuring progress against others typically fosters chronic dissatisfaction with own performance. This incessant fixation can lead to ongoing frustration, which in turn can diminish confidence and negatively affect trading outcomes.
📍 How To Stop Constantly Comparing Yourself To Others ?
🔹 Focus on Your Goals: Concentrate on your personal trading objectives and strategies. Instead of comparing yourself to others, turn your attention inward. Remember that not everyone can achieve the same level of success as Warren Buffett, regardless of their abilities. It's not about having lofty ambitions; what matters is the gradual progress toward your goals. Make sure to continually develop yourself, steadily raising your own standards and aspirations.
🔹 Cultivate Reasonable Confidence: Question whether everyone who claims to achieve returns of 50-100% has genuinely earned those results. Avoid falling for misleading advertisements; trust only what can be verified. Remember, knowledgeable traders take pride in their expertise, not their wealth.
🔹 Embrace Development and Learning: Commit to continuously improving your skills and knowledge. The more you learn, the more confident you'll become in your abilities—and the less you'll find yourself fixated on the achievements of others.
🔹 Foster Positive Thinking: Shift your mindset by replacing constant comparison with admiration for the successes of others. Use their accomplishments as inspiration for your own growth and development.
🔹 Build Community and Support: Connect with other traders to share experiences and offer mutual support. Not only can you gain valuable knowledge and learn from the mistakes of others, but you will also appreciate that every achievement requires significant time and effort.
🔹 Practice Meditation and Relaxation: Practice relaxation techniques into your routine to help reduce stress and emotional strain.
📍 Conclusion
Cease the habit of comparing yourself to others, as it often clouds your unique path to success. Instead, redirect your energy toward your personal development by setting clear and meaningful goals that resonate with your aspirations. Cultivate a deep belief in your own potential and capabilities, recognizing that your journey is distinct and valuable. Embrace the idea that with dedication and resilience, success will naturally unfold as a result of your commitment to growth and self-improvement!
Grass Isn't Greener On The Other Side. It Is Greener Where You Water It
Traders, If you liked this educational post🎓, give it a boost 🚀 and drop a comment 📣

Common Mistakes to Avoid in TradingCommon Mistakes to Avoid in Trading
You have probably heard that trading is risky and that traders often make silly mistakes. At FXOpen, we know that many questions arise during trading regardless of your level of experience. In this article, we will discuss the common trading mistakes that you might make even if you have been in the markets for a long time.
1. Not Using a Trading Plan or a Trading Journal
Trading without a trading plan can lead to haphazard decision-making and a lack of accountability. You can consider using a trading plan to make decisions about entering and exiting trades. A trading journal could help you track your win/loss rate and learn from your mistakes. It helps identify patterns and adjust strategies. These tools are essential for long-term success.
2. Emotional Trading
Emotional trading is driven by impulsive decisions based on fear and greed. Without logic and analysis, traders are more likely to make mistakes and take unnecessary risks. A trader driven by fear may exit a trade early, missing out on potential profits, while a trader driven by greed may hold a losing trade for too long. It’s important to always remain calm and rational.
3. Guessing
Guessing is one of the trading mistakes to avoid. It’s based on speculation and assumptions rather than analysis and research. Traders who guess may get lucky, but they are more likely to lose money over time. Trading requires deep analysis of markets, economic indicators, and news events, it’s not a guessing game. It may be more effective to rely on data-driven strategies to achieve long-term profitability.
4. Not Using Risk and Money Management Tools
Special tools for trading help manage risk and preserve capital. Risk management instruments such as stop loss, limit orders, and position sizing help traders limit their losses and protect their profits. In turn, money management tools like risk/reward ratios, diversification, and leverage control help optimise returns while minimising risk. It might be a good idea to use both types of tools.
5. Taking Too Many Positions
Taking too many positions is risky because it increases exposure to market volatility and unpredictability. In these cases, it becomes hard to effectively manage each trade. Having too many positions can lead to over-trading, where trades are made without a clear plan. The theory states that it’s better to use fewer positions to maintain control over the situation.
6. Overleveraging
Overleveraging refers to borrowing too much money from a broker, which results in larger losses if you fail. To avoid excessive leverage, traders should establish strict risk management rules and follow them. You may consider using leverage if you fully understand the risks involved, but it’s not advisable to borrow more than you can afford to lose.
7. Revenge Trading
Revenge trading is trading after a failure in an attempt to compensate for losses by taking risks and making impulsive trades. It’s often accompanied by anger and frustration. To avoid this, many traders take a break and step away from the market. The best way to handle this is to identify what went wrong and how to improve the situation. Don’t let emotions cloud your judgement.
8. Forgetting About Investment Time Horizons
An investment time horizon is the length of time you plan to hold a trade open. If you are aiming for the long term, you can afford to take more risk and trade assets that may yield higher returns over time. Still, in this case, you will need more capital to afford price fluctuations. But if you are focused on the short term, you will need to think about price volatility and fees, which will be higher if you open many trades.
9. Following the Crowd
Following the crowd leads to making decisions based on other people’s opinions rather than sound financial analysis. It can be tempting to buy or sell based on the latest news, which can lead to buying high and selling low. Usually, the crowd doesn’t have the same investment goals and risk tolerance as you do, so their decisions may not suit you. Explore the potential options yourself.
10. Incorrect Hedging and Diversification Strategies
Hedging and diversification help manage risk, but they must be used correctly. Hedging can help limit downside risk, but it can also limit potential gains. Diversification helps reduce the risks to a portfolio, but it doesn’t guarantee profits or protect against losses. Use both mindfully.
Trade on our TickTrader platform and use modern trading tools to achieve the best results. Explore our website to learn more.
How Do You Overcome Trading Mistakes?
Trading mistakes vary significantly and require different approaches, but here are some general techniques you may want to use:
- Analyse entry and exit points, market conditions, and other factors that may have caused the error.
- Try to understand what could have been done differently and how to avoid similar mistakes in the future.
- Consider changing your approach to risk management and re-evaluate your overall trading plan.
- If you are struggling to overcome a mistake, learn how other traders dealt with it.
Trading mistakes are inevitable, but what matters is how you deal with them. If you are ready to start trading, you can open an FXOpen account.
This article represents the opinion of the Companies operating under the FXOpen brand only. It is not to be construed as an offer, solicitation, or recommendation with respect to products and services provided by the Companies operating under the FXOpen brand, nor is it to be considered financial advice.

Cryptocurrency Trading Starter GuidePART 1
INTRODUCTION
What are Cryptocurrencies?
Cryptocurrencies are based on the fundamental idea of being decentralized digital money, created for use on the Internet. Bitcoin, introduced in 2008, was the pioneer in this field and remains the largest, most influential, and well-known of all. Since then, in just over a decade, Bitcoin and other cryptocurrencies like Ethereum have emerged as digital alternatives to government-issued money.
The most popular cryptocurrencies by market capitalization include Bitcoin, Ethereum, Tether (a stablecoin), and Solana. There are also others like Doge, Toncoin (from Telegram), and Chainlink, which are quite well-known. Some of these cryptocurrencies function similarly to Bitcoin, while others are based on different technologies or have additional features that allow them to do more than just transfer value.
Cryptocurrencies enable the transfer of value over the Internet without requiring the involvement of intermediaries like banks or payment processors. This facilitates nearly instant value transfers worldwide, at any time of the day, seven days a week, and with very low costs.
Most cryptocurrencies are not issued or controlled by governments or central entities. Instead, they are managed by peer-to-peer computer networks that operate using free and open-source software, allowing virtually anyone who wants to participate to do so.
If there’s no bank or government involved, how is the security of cryptocurrencies ensured? Security is achieved through a technology known as blockchain.
A cryptocurrency's blockchain is similar to a bank’s ledger or balance sheet. Each cryptocurrency has its own blockchain, which serves as a record where all transactions made with that currency are verified and continuously updated.
Why are Cryptocurrencies Considered the Future of Finance?
Cryptocurrencies are the first real alternative that challenges the traditional banking system, offering notable advantages that position them above traditional payment methods and existing forms of investment. They can be seen as "Money 2.0," a new type of cash born on the Internet, giving them the potential to become the fastest, most accessible, economical, secure, and global means of exchanging value the world has ever seen.
Cryptocurrencies can be used to purchase goods and services or as an investment option. Unlike traditional currencies, they cannot be manipulated by a central authority since no such entity exists. Regardless of what happens with a government, your cryptocurrencies will remain protected and secure.
Digital currencies provide equal access, regardless of a person's country of origin or residence. As long as you have a smartphone or a device with an Internet connection, you can access cryptocurrencies just like anyone else.
Cryptocurrencies offer unique opportunities to expand people's economic freedom worldwide. Without physical borders, digital currencies facilitate free trade, even in countries where the government strictly controls its citizens' finances. In regions where inflation is a significant challenge, cryptocurrencies can serve as a viable alternative to unstable fiat currencies for saving or making transactions.
Why Invest in Cryptocurrencies?
You can buy both small and large amounts of cryptocurrencies since it’s possible to purchase fractions of them. For example, you can buy Bitcoin with any amount, such as $1, $25, or $50.
Unlike stocks or bonds, cryptocurrencies can be easily transferred to anyone or used to pay for goods and services in just seconds or minutes.
Millions of people include Bitcoin and other digital currencies in their investment portfolios.
Creating a secure account only takes a few minutes, and you can buy cryptocurrencies using a debit card or through a bank account.
Cryptocurrencies' high volatility means their prices can change abruptly, providing traders with the opportunity to take advantage of these price movements to make profits.
24/7 Market: Unlike traditional stock markets, cryptocurrency markets are always open, allowing traders to operate at any time of the day or night.
What is a Stablecoin?
Examples of Stablecoins:
USDC (USD Coin)
USDT (USD Tether)
PYUSD (PayPal's Stablecoin)
DAI
USDD
These are examples of price-stable cryptocurrencies known as stablecoins. You can think of these assets as "crypto dollars" because they are designed to reduce volatility and increase reliability. Stablecoins combine some of the best advantages of traditional cryptocurrencies, such as seamless global transactions, security, and privacy, with the valuable stability offered by fiat currencies.
These cryptocurrencies achieve this by linking their value to an external element, typically a fiat currency like the US dollar, a tangible asset such as gold, or the Euro.
This makes their value less likely to experience drastic fluctuations from one day to the next. This stability can improve their usefulness as a currency for daily transactions, as both buyers and merchants can trust that the value of transactions will remain relatively constant over more extended periods.
Additionally, they can serve as a safe and consistent way to save money, similar to a traditional savings account.
Part 2 will be published tomorrow
I hope this is valuable to you!
If you liked it, please support me with a like!
If you want to learn more, follow me!
If you didn’t like it, I welcome any criticism or comments!

What is Confluence ?✅ Confluence refers to any circumstance where you see multiple trade signals lining up on your charts and telling you to take a trade. Usually these are technical indicators, though sometimes they may be price patterns. It all depends on what you use to plan your trades. A lot of traders fill their charts with dozens of indicators for this reason. They want to find confluence — but oftentimes the result is conflicting signals. This can cause a lapse of confidence and a great deal of confusion. Some traders add more and more signals the less confident they get, and continue to make the problem worse for themselves.
✅ Confluence is very important to increase the chances of winning trades, a trader needs to have at least two factors of confluence to open a trade. When the confluence exists, the trader becomes more confident on his negotiations.
✅ The Factors Of Confluence Are:
Higher Time Frame Analysis;
Trade during London Open;
Trade during New York Open;
Refine Higher Time Frame key levels in Lower
Time Frame entries;
Combine setups;
Trade during High Impact News Events.
✅ Refine HTF key levels in LTF entries or setups for confirmation that the HTF analysis will hold the price.
HTF Key Levels Are:
HTF Order Blocks;
HTF Liquidity Pools;
HTF Market Structure.

Market Structure Identification !!Hello traders!
I want to share with you some educational content.
✅ MARKET STRUCTURE .
Today we will talk about market structure in the financial markets, market structure is basically the understading where the institutional traders/investors are positioned are they short or long on certain financial asset, it is very important to be positioned your trading opportunities with the trend as the saying says trend is your friend follow the trend when you are taking trades that are alligned with the strucutre you have a better probability of them closing in profit.
✅ Types of Market Structure
Bearish Market Structure - institutions are positioned LONG, look only to enter long/buy trades, we are spotingt the bullish market strucutre if price is making higher highs (hh) and higher lows (hl)
Bullish Market Structure - institutions are positioned SHORT, look only to enter short/sell trades, we are spoting the bearish market strucutre when price is making lower highs (lh) and lower lows (ll)
Range Market Structure - the volumes on short/long trades are equall instiutions dont have a clear direction we are spoting this strucutre if we see price making equal highs and equal lows and is accumulating .
I hope I was clear enough so you can understand this very important trading concept, remember its not in the number its in the quality of the trades and to have a better quality try to allign every trading idea with the actual structure
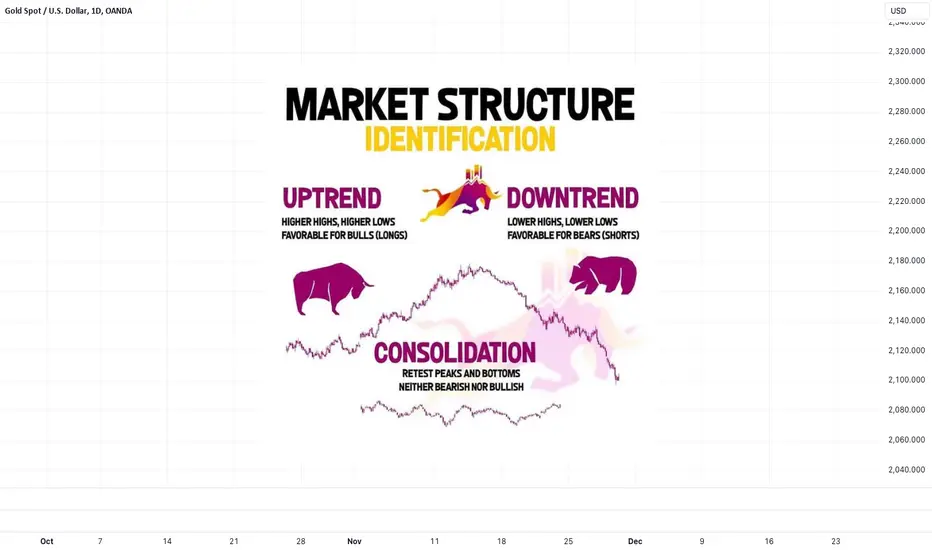
Cracking the Forex Code: Trader’s Complete Guide to Market SlangForex is the vast universe of currency pairs floating against each other—sometimes sitting at parity, sometimes shooting for the stars and sometimes just plain nosediving. And because forex has a mind of its own (kind of), it also speaks its own language. This is why this Idea exists—to help you make sense of the jargon by breaking down key terms, phrases, and slang used in everyday forex trading. Let’s get into it!
1. Ask
The price the market is willing to sell a currency at. It’s the price you’ll pay if you’re buying.
2. Arbitrage
Simultaneous buying and selling across different markets to exploit price differences.
3. Aussie
Trader slang for the AUD/USD currency pair.
4. Bagholder
Someone stuck holding a losing position long after everyone else has exited. Don’t be a bagholder. (Are you secretly a bagholder?)
5. Base Currency
The first currency in a pair (e.g., in EUR/USD , EUR is the base). You’re buying or selling this one.
6. Bearish
Expecting the market to fall. Depicts a bear attack—swiping its paws downward.
7. Bid
The price at which the market is willing to buy a currency. If you’re selling, this is the price you’ll get.
8. Black Gold
A nickname for oil. Watch the price of this commodity—it moves entire currencies.
9. Bottom Fishing
Buying a currency or stock at what you hope is its lowest point. It’s risky—sometimes the bottom keeps falling.
10. Breakout
When price moves out of a defined range, smashing through support or resistance, signaling a potential strong move.
11. Buck
Trader slang for the U.S. dollar. Simple, direct, and everyone knows it.
12. Bullion
Physical gold or silver. When traders want the real stuff, they go for bullion.
13. Bullish
Betting on the market to rise. Depicts a bull attack—thrusting its horns upward.
14. Cable
Forex slang for the GBP/USD pair, named after the old transatlantic cable.
15. Candlestick
A visual representation of price movement showing the open, high, low, and close in a specific time period.
16. Carry Trade
Borrowing in a low-interest-rate currency and investing in a higher-interest one to pocket the interest difference.
17. Choppy
Describes a market with no clear direction and lots of erratic movement. A tough one to trade in.
18. Chunnel
Slang for the EUR/GBP pair, referring to the English Channel that connects Europe and the UK. Gotta love that geographical flair.
19. Cross Currency Pair
A currency pair that doesn’t involve the USD (e.g., EUR/JPY ). They have a life of their own, not tied to the greenback.
20. Dip
A temporary decline in price during an uptrend. Smart traders "buy the dip" to get in. But sometimes the dip keeps dippin’.
21. Dragon
The GBP/JPY currency pair. Known for its volatility and wild price swings—trade carefully!
22. Drawdown
The loss from peak to trough in your account balance during a trading period. It’s inevitable—just don’t let it take you out.
23. Exotic Pairs
Currency pairs that include one major currency and one from an emerging or less liquid market (e.g., USD/TRY ). Exotic in name, but not always in your best interest—volatile and wide spreads.
24. Fedspeak
The carefully crafted language of the Federal Reserve. One vague speech from Fed Chair JPow can send markets into a frenzy.
25. Fibonacci Retracement
A technical tool to identify possible support and resistance levels, based on the Fibonacci sequence. Traders love these numbers.
26. Fill or Kill
A type of order where it must be filled immediately at the requested price, or canceled. No waiting around here.
27. Forex (FX)
The foreign exchange market—where currencies are traded 24/5. The biggest, baddest market in the world with $7 trillion moving daily.
28. FOMO
Fear of Missing Out. The emotional trap where traders chase the market late—usually leading to bad trades. Don’t fall for it.
29. Fundamental Analysis
Analyzing economic factors (e.g., GDP, employment, inflation) to predict currency movements. It’s all about the big picture here.
30. Gopher
Slang for the USD/JPY pair. A less common term, but you’ll see it in the trading trenches.
31. Greenback
Another classic slang term for the US dollar, referring to the green color of American bills.
32. Hawkish
A central bank policy favoring higher interest rates to control inflation. Hawkish policy = stronger currency.
33. Kiwi
Slang for the NZD/USD currency pair. Named after New Zealand’s famous bird—not the fruit!
34. Leverage
Trading with borrowed capital. It magnifies gains, but it can also blow up your account faster than you think. Use wisely.
35. Liquidity
The ease with which a currency can be traded without affecting its price. High liquidity means tight spreads and fast trades.
36. Loonie
The nickname for the USD/CAD pair. Named after the loon, a bird featured on Canada’s $1 coin.
37. Lot
The size of your trade. A Standard Lot is 100,000 units, a Mini Lot is 10,000, and a Micro Lot is 1,000.
38. Margin
The amount of money needed to open a leveraged trade. It’s essentially your broker’s “deposit.”
39. Margin Call
When your broker demands more funds because your account can no longer support open positions. Not answering could mean automatic liquidation. New phone who dis?
40. Market Maker
An entity (usually a bank or broker) that provides liquidity to the market by always being willing to buy or sell at certain prices.
41. Moving Average
A technical indicator that smooths price data over a specific period to identify trends. Think of it as the market’s heartbeat.
42. Ninja
Slang for the USD/JPY pair. This one’s fast and stealthy, like a true ninja.
43. Old Lady
A nickname for the Bank of England (BoE). When the “Old Lady” speaks, the GBP moves.
44. Overbought
When a currency has been bought excessively, leading to a potential reversal. Usually spotted with indicators like RSI.
45. Oversold
The opposite of overbought. It means the currency has been sold off too quickly, signaling a potential price bounce.
46. Permabear
A trader who is always bearish, no matter what the market does. They believe the sky is always falling. “I knew BTC was going to zero.”
47. Pips
The smallest price move in a currency pair. In most pairs, it’s the fourth decimal place (0.0001). Collecting pips is how you build profit.
48. Pivot Point
A key level used by traders to identify potential support and resistance levels. Great for spotting reversals.
49. Position Trading
Holding a trade for weeks or months, focusing on long-term trends. You’ll need patience for this one.
50. Price Action
Trading based solely on price movement, ignoring indicators and fundamentals. It’s all about reading the market’s raw behavior.
51. Pump and Dump
A scheme where traders hype up a currency or stock, inflate its price, then sell out for a profit while everyone else is left holding the bag. Sketchy stuff.
52. Pullback
A temporary dip or rise in price within a larger trend. It’s an opportunity to buy in or sell the rally.
53. Ranging Market
When prices are moving sideways in a tight range, with no clear trend. Boring, but there are still trades to be made.
54. Resistance
A price level where selling pressure tends to prevent further rises. If it breaks, a big move could be coming.
55. Rollover
Interest earned or paid for holding a position overnight, based on the interest rate differential between the currencies.
56. Scalping
A fast-paced strategy that involves making quick trades to grab small profits from tiny price moves. Not for the faint-hearted.
57. Shill
Someone who promotes or hypes up a stock, currency, or crypto for personal gain, often misleading others. Watch out for these on social media.
58. Short Squeeze
When a heavily shorted asset rises in price quickly, forcing short sellers to buy back their positions at higher prices, fueling the rally even further.
59. Slippage
When your trade is executed at a different price than expected, usually during high volatility or low liquidity.
60. Spread
The difference between the bid and ask prices. Tighter spreads are better—lower costs for getting into a trade.
61. Stop-Loss
An order that automatically closes a trade when it hits a specified loss level. Protect yourself, set that stop!
62. Support
A price level where buying appetite tends to prevent further drops. Break below it, and things could get ugly.
63. Swissy
Slang for the USD/CHF currency pair. Traders often turn to the Swissy for safety in volatile times.
64. Swap
The interest earned or paid for holding a position overnight. Positive swaps are a nice bonus, negative swaps? Not so much.
65. Swing Trading
Holding trades for days or weeks to capture short- to medium-term market moves. It’s a balanced approach between day trading and long-term investing.
66. Take-Profit
An order that closes your trade automatically when it reaches your target profit. Lock in those gains before the market turns!
67. Tenbagger
A stock or currency that increases tenfold in value. Rare, but when it happens, it’s legendary.
68. Trend
The general direction the market is moving—either bullish, bearish, or sideways. The trend is your friend—until it isn’t.
69. Volatility
The amount of price fluctuation in the market. High volatility means more potential for profits—or losses. Buckle up! (Hint: Anticipate volatility by knowing the market-moving events .)
70. Whipsaw
When the market moves quickly in one direction, stops you out, and then reverses back. It’s the ultimate trader frustration.
71. Widow Maker
A trade with huge risks that’s known for wiping out accounts, especially when shorting the Japanese yen in a strong trend or betting against the Bank of Japan.
And there you have it— the ultimate Forex slang dictionary that prepares you to take a deep dive in the sea of forex trading . Did we catch everything? Let us know your thoughts in the comments!

The 20 Trading Lessons from Top Traders I have read a lot of trading books since the time I started trading my own account and the one book that really helps me out and “I wish I’ve read this one first” – is Market Wizards Interview with Top Traders by Jack D. Schwager.
Here’s the list that struck me most that I’d like to share:
“Early trading failure is a sign that you are doing something wrong; it is not necessarily a good predictor of ultimate potential failure or success.” – Michael Marcus
“If you don’t stay with your winners, you are not going to be able to pay for the losers.” – Michael Marcus
“Liquidating positions is the way to achieve mental clarity when one is losing money and confused regarding market decisions.” – Michael Marcus
“Being a successful trader also takes courage: the courage to try, the courage to fail, the courage to succeed, and the courage to keep going when the going keeps tough.” – Michael Marcus
“Place your stops at a point that, if reached, will reasonably indicate that the trade is wrong, not at a point determined primarily by the maximum dollar amount you are willing to lose per contract. If the meaningful stop point implies an uncomfortably large loss per contract, trade a smaller number of contracts.” – Bruce Kovner
“The times when you least want to think about trading – the losing periods – are precisely the times when you need to focus most on trading.” – Richard Dennis
“Everybody gets what they want out of the market.” – Ed Seykota
“It is a happy circumstance that when nature gives us true burning desires, it also gives us the means to satisfy them.” – Ed Seykota
“Frankly, I don’t see markets; I see risks, rewards and money.” – Larry HIte
“ I have two basic rules about winning in trading as well as in life: 1. If you don’t bet, you can’t win. 2. If you lose all your chips, you can’t bet” – Larry Hite
“In my judgment, all traders are seekers of truth.” – Michael Steinhardt
“The more disciplined you can get, the better you are going to do in the market. The more you listen to tips and rumors, the more money you’re likely to lose.” – David Ryan
“When the market gets good news and goes down, it means the market is very weak; when it gets bad news and goes up, it means the market is healthy.” – Marty Schwartz
“Learn to take losses. The most important thing in making money is not letting your losses get out of hand. Also, don’t increase your position size until you have doubled or tripled your capital. Most people make the mistake of increasing their bets as soon as they start making money. That is a quick way to get wiped out.” – Marty Schwartz
“The best traders are the most humble.” – Mark Weinstein
“You have to learn how to lose; it is more important than learning how to win.” – Mark Weinstein
“Most traders who fail have large egos and can’t admit that they are wrong. Even those who are willing to admit that they are wrong early in their career can’t admit it later on. Also, some traders fail because they are too worried about losing.” – Brian Gelber
“You are never really confident in this business, because you can always be wiped out pretty quickly. The way I trade is: Live by the sword, die by the sword. There is always the potential that I could get caught with the big position in a fluke move with the market going the limit against me. On the other hand, there is no doubt in my mind that I could walk into any market in the world and make money.” – Tom Baldwin
“Clear thinking, ability to stay focused, and extreme discipline. Discipline is number one: Take a theory and stick with it. But you have to be open-minded enough to switch tracks if you feel that your theory has been proven wrong. You have to be able to say, my method worked for this type of market, but we are not in that type of market anymore.” – Tony Saliba
“ How do you judge success? I don’t know. All I know is that all the money in the world isn’t the answer.” Tony Saliba
There’s still a lot of golden information that I want to write in here – for ourselves and for everyday reading so as to keep us aligned with our trading goal, but I prefer to encourage you to read the book.

Institutional and Retail Traders: Where the Difference LiesInstitutional and Retail Traders: Where the Difference Lies
There are many players in the financial markets who can cause changes in trend direction, but let’s focus on institutional and retail traders. This FXOpen article compares retail vs institutional trading. You’ll learn about the characteristics of these types of traders, how they affect the markets, as well as the differences and similarities between them.
What Is a Retail Trader?
Let’s start with a retail trader definition. Retail traders refer to individual traders or small investors who participate in trading for speculative purposes.
They typically trade with smaller capital and have fewer resources and less access to information than institutional traders. Retail traders often use leverage, which allows them to control larger positions with a smaller amount of capital. Leverage may increase potential returns, but it also escalates the exposure to substantial losses.
The collective impact of retail trading has grown significantly in recent years, shaping market dynamics. The rise of online platforms has democratised financial markets, allowing retail traders to participate more actively. Their collective actions can amplify market trends and contribute to increased market volatility.
How Do Retail Traders Trade?
Retail traders often engage in day, swing, and news trading. They usually rely on online resources for self-education. They may attend educational courses and use the services of mentors. They may use technical analysis, social media discussions, or market sentiment analysis to inform their decisions.
The collective power of retail trader communities, fuelled by social media discussions, can impact asset prices. The “Reddit effect” exemplifies how retail trading, through online forums, can challenge traditional market dynamics.
What Is an Institutional Trader?
What is institutional trading? Let’s first take a look at the institutional market definition. In the context of trading, the institutional market refers to the segment of the overall market where institutions and corporations manage their assets. Institutional traders buy and sell different financial instruments for the accounts they manage on behalf of others, and they handle large pools of capital. Therefore, they can influence market trends and liquidity. Their collective actions may lead to market-wide shifts, affecting prices and levels of volatility.
Examples include hedge funds, mutual funds, investment banks, endowment funds, pension funds, and insurance companies. They have different goals, for example, hedge funds pursue absolute returns, and investment banks engage in market-making and proprietary trading.
How Do Institutional Traders Trade?
Institutional trading is characterised by its scale and impact. By handling significant volumes of capital, they take advantage of access to privileged information and influence market movements. For example, in institutional forex trading, central banks have the greatest price impact in the spot FX market, followed by hedge funds and mutual funds, while regular traders have much less influence on dealer pricing.
Institutions commonly employ sophisticated strategies, such as quantitative trading and algorithmic trading. Their strategies often involve in-depth market analysis and the use of advanced instruments.
Retail Trader vs Institutional Trader: Key Differences
The primary differences between institutional and retail traders lie in factors such as capital, risk tolerance, and time horizons. These and other aspects are collected in this table:
Aspect - Retail - Institutional
- Capital - Limited capital - More capital-rich
- Price Influence - Limited influence - More significant influence
- Knowledge - Self-taught, usually from internet resources - Educated in finance or economics from college
- Trading focus - Technical systems, price patterns, indicators - Fundamentals and trading psychology
- Account - Personal accounts - Accounts they oversee on behalf of a group or institution
- Time of trading - A shorter time horizon - A longer time horizon
- Risk tolerance - Disciplined risk management, a lower risk tolerance - A higher risk tolerance, a focus on growth
- Market Access - Retail and online brokerages with standard trading instruments - More difficult instruments, including swaps
These differences profoundly impact trading strategies. Institutions can afford more complex and resource-intensive strategies, while retail traders may focus on simpler approaches. Time sensitivity, risk aversion, and regulatory constraints further differentiate their decision-making processes.
Similarities and Overlaps
While institutional and retail traders differ in many aspects, there are areas where their trading strategies may converge. Both groups may use similar trading tools and strategies, for instance, technical analysis, fundamental analysis, and algorithmic trading.
The influence of technology has also contributed to blurring the lines between these trading types. Retail traders can now access sophisticated tools, while institutions may adopt more agile and cost-effective technologies.
You may trade over 600 assets at the TickTrader trading platform using modern instruments for market analysis.
Final Thoughts
Institutional and retail traders play distinct but significant roles in the financial markets. While institutions have advantages such as access to more financial instruments and extensive resources, retail traders have the flexibility and freedom in trading decisions.
The convergence of strategies and the evolving influence of technology indicate that the landscape will continue to shift, creating new opportunities and challenges for traders across the spectrum. If you want to trade on various markets with tight spreads and low commissions, you can open an FXOpen account.
This article represents the opinion of the Companies operating under the FXOpen brand only. It is not to be construed as an offer, solicitation, or recommendation with respect to products and services provided by the Companies operating under the FXOpen brand, nor is it to be considered financial advice.

Interest Rate Strategies: Trade Smarter with Fed Rate DecisionsInterest Rate Strategies: Trade Smarter with Fed Rate Decisions
Trading interest rates may seem straightforward at first: buy when cuts end and sell when they fall. However, this approach often defies expectations, as determining when rate cuts truly end isn't as simple as pointing to a rate pause following a cut. While today’s Federal Reserve rate decisions are made during scheduled (and unscheduled emergency) Federal Open Market Committee (FOMC) meetings, this wasn’t always the case. Before the 1990s, the Fed often made changes outside of meetings. The shift to exclusively deciding rates during FOMC meetings was implemented to provide greater transparency and predictability for markets.
Topics Covered:
How Are Interest Rates Traded?
Three Interest Rate Trading Strategies.
Key Insights from Backtesting Interest Rate Trading Strategies.
Interest Rate Trading Indicator (Backtest For Yourself).
█ How Are Interest Rates Traded?
This strategy focuses on trading around Federal Reserve interest rate decisions, including hikes (increases), cuts (decreases), and pauses. These decisions are believed by many to have both short- and long-term effects on the market.
Key Strategy Concepts Backtested:
Buy on Rate Pauses or Increases: Go long (buy) when the Fed pauses or raises interest rates, typically signaling market stability or optimism.
Sell on Rate Decreases: Go short (sell) or close longs when the Fed cuts rates, often indicating economic concerns or slowing growth.
Buy on Specific Rate Decreases: Enter trades when the Fed implements specific rate cuts, such as 50 basis points (bps) which represents 0.5%, and analyze market reactions over different time horizons.
█ Strategy: Long during Pauses and Increases, Short during Decreases
This section examines the effectiveness of going long on rate pauses or increases and shorting during decreases. This strategy performed well between 2001 and 2009, but underperformed after 2009 and before 2001 compared to holding positions. The main challenge is the unpredictability of future rate changes. If you could foresee rate trends over two years, decision-making would be easier, but that’s rarely the case, making this strategy less reliable in certain periods.
2001-2009
Trade Result: 67.02%
Holding Result: -31.19%
2019-2021
Trade Result: 19.28%
Holding Result: 25.22%
1971-Present
Trade Result: 444.13%
Holding Result: 5694.12%
█ Strategy: Long 50bps Rate Cuts
This section evaluates trading around 50 basis point (bps) rate cuts, which is a 0.5% decrease. Large cuts usually respond to economic stress, and market reactions can vary. While these cuts signal aggressive economic stimulation by the Fed, short-term responses are often unpredictable. The strategy tends to perform better over longer timeframes, as markets absorb the effects.
1971-Present
Trade Duration: 10 trading days — Average Return: -0.19%
Trade Duration: 50 trading days — Average Return: 2.41%
Trade Duration: 100 trading days — Average Return: 2.46%
Trade Duration: 250 trading days — Average Return: 11.4%
2001-Present
Trade Duration: 10 trading days — Average Return: -2.12%
Trade Duration: 50 trading days — Average Return: -1.84%
Trade Duration: 100 trading days — Average Return: -3.72%
Trade Duration: 250 trading days — Average Return: 1.72%
2009-Present
Trade Duration: 10 trading days — Average Return: -15.79%
Trade Duration: 50 trading days — Average Return: -6.11%
Trade Duration: 100 trading days — Average Return: 7.07%
Trade Duration: 250 trading days — Average Return: 29.92%
█ Strategy: Long Any Rate Cuts
This section reviews the performance of buying after any rate cut, not just large ones. Rate cuts usually signal economic easing and often improve market conditions in the long run. However, the size of the cut and its context greatly influence how the market reacts over different timeframes.
1971-Present
Trade Duration: 10 trading days — Average Return: 0.33%
Trade Duration: 50 trading days — Average Return: 2.65%
Trade Duration: 100 trading days — Average Return: 4.38%
Trade Duration: 250 trading days — Average Return: 8.4%
2001-Present
Trade Duration: 10 trading days — Average Return: -1.12%
Trade Duration: 50 trading days — Average Return: -0.69%
Trade Duration: 100 trading days — Average Return: -1.59%
Trade Duration: 250 trading days — Average Return: 0.22%
2009-Present
Trade Duration: 10 trading days — Average Return: -3.38%
Trade Duration: 50 trading days — Average Return: 3.26%
Trade Duration: 100 trading days — Average Return: 12.55%
Trade Duration: 250 trading days — Average Return: 12.54%
█ Key Insights from Backtesting Interest Rate Trading Strategies
The first assumption I wanted to test was whether you should sell when rate cuts begin and buy when they end. The results were inconclusive, mainly due to the difficulty of predicting when rate cuts will stop. A rate pause might suggest cuts are over, but that’s often not the case, as shown below.
One key finding is that the best time to be fully invested is when rates fall below 1.25% or 1.00%, as this has historically led to stronger market performance. But this can be subject to change.
█ Interest Rate Trading Indicator (Backtest For Yourself)
Indicator Used For Backtesting (select chart below to open):
The 'Interest Rate Trading (Manually Added Rate Decisions) ' indicator analyzes U.S. interest rate decisions to determine trade entries and exits based on user-defined criteria, such as rate increases, decreases, pauses, aggressive changes, and more. It visually marks key decision dates, including both rate changes and pauses, offering valuable insights for trading based on interest rate trends. Historical time periods are highlighted for additional context. The indicator also allows users to compare the performance of an interest rate trading strategy versus a holding strategy.

Comparison of Money Market vs Capital MarketComparison of Money Market vs Capital Market
Navigating the financial world requires a clear understanding of its various facets, especially when comparing the money market vs the capital market. These two pivotal markets serve distinct roles in the economy, catering to different investment horizons and risk profiles. This article aims to demystify these markets, providing insights into their characteristics, differences, and the importance they hold for traders and investors alike.
What Is the Money Market?
The money market involves trading short-term financial instruments. It’s characterised by high liquidity and potentially lower risk, making it a popular choice when it comes to managing short-term financial needs and cash reserves.
Instruments traded here include Treasury bills (T-bills), which are government-issued securities with maturities of less than one year. Commercial paper, another common instrument, is an unsecured, short-term debt issued by corporations to finance their immediate operational needs. Additionally, certificates of deposit (CDs) issued by banks offer fixed interest rates for short-term deposits.
These instruments collectively may provide a so-called safe haven when investors seek relative stability and quick access to their funds, with minimal exposure to price fluctuations.
What Is the Capital Market?
The capital market is a financial marketplace where long-term debt and equity-based securities are traded. It's essential for raising capital and serves as a key platform for long-term investment and wealth generation.
It includes stocks, representing ownership shares in companies, and bonds, which are debt securities issued by entities like governments and corporations. Stocks offer potentially higher returns but come with greater risk, while bonds often provide a more stable income stream but usually with lower returns.
This market plays a crucial role in the economy by enabling capital formation and investment in productive ventures, driving economic growth. It attracts investors seeking opportunities to invest in the future growth of companies, infrastructure projects, and governmental initiatives, offering a range of options from high-risk, high-reward stocks to more conservative bonds.
Key Differences Between Money vs Capital Markets
In the financial world, understanding the key differences between capital market securities vs money market securities is crucial for investors and traders. While both are integral parts of the financial system, they serve different purposes and offer distinct characteristics.
Money Market
- Investment Duration: Characterised by investments typically lasting under a year, designed to meet immediate liquidity requirements.
- Risk Profile: Offers potentially lower-risk options with relatively stable returns, ideal for conservative investors.
- Types of Securities: Features instruments like Treasury bills, commercial paper, and certificates of deposit for quick cash conversion.
- Role in the Economy: Provides essential short-term financial effectiveness and efficient liquidity management.
- Liquidity: Instruments in this market are highly liquid, which may facilitate fast and easy access to funds.
Capital Market
- Investment Duration: Focuses on the long-term, often spanning years or decades, aimed at future growth and capital accumulation.
- Risk Profile: Involves a higher risk attributable to longer time horizons and market volatility, particularly with stocks. You can keep an eye on stock volatility in FXOpen’s free TickTrader platform.
- Types of Securities: Comprises stocks, bonds, and long-term debts, catering to a range of investment preferences.
- Role in the Economy: Plays a crucial role in long-term investment strategies, economic growth, and facilitating capital formation.
- Liquidity: Securities like stocks and bonds offer varying degrees of liquidity, generally less than money market instruments due to their long-term nature.
Importance of Each Market to Traders
The money market is critical for traders seeking potential stability and short-term liquidity. Its lower-risk instruments, like Treasury bills and certificates of deposit, are ideal for parking surplus funds with a focus on capital preservation. It’s also invaluable in hedging short-term currency or interest rate risks.
On the other hand, the capital market is a key arena for traders aiming to achieve long-term growth and potentially higher returns. Investing in stocks and bonds in the capital market allows traders to participate in the economic growth of companies and governments. While these investments carry higher risk, they offer the potential for greater capital appreciation and returns through dividends and interest.
Impact of Economic Changes on Both Markets
Economic changes can significantly impact both the money and capital markets but in different ways. In the money market, interest rate fluctuations are a primary influencer. Lower interest rates typically make short-term investments less attractive, reducing returns on instruments like Treasury bills and certificates of deposit. Conversely, higher rates can increase the appeal of these securities.
In the capital market, broader economic trends play a more substantial role. Economic growth can boost investor confidence, leading to increased demand for stocks and higher market valuations. Inflation can also impact the capital market, as it may erode the real value of fixed-income securities like bonds. However, political stability and policy changes can either enhance or diminish investor confidence in both markets, affecting performance and investment decisions.
The Bottom Line
Understanding the differences between these markets is vital. Each market serves unique purposes, catering to different investor needs, from short-term liquidity in the money market to long-term growth in the capital market. For those looking to explore these opportunities, opening an FXOpen account can provide access to a range of stock and ETF CFDs. Happy trading!
This article represents the opinion of the Companies operating under the FXOpen brand only. It is not to be construed as an offer, solicitation, or recommendation with respect to products and services provided by the Companies operating under the FXOpen brand, nor is it to be considered financial advice.

Top 5 Books Every Trader Should Have on Their ShelfLet’s face it: there is more to trading than blindly smashing the buy and sell button after you’ve picked up the latest buzz on Reddit’s messaging boards. What’s happening between your ears is just as important as what’s happening on your charts. And sometimes, it might as well help you make sense of it all. So, where do you start if you want to sharpen your edge?
Books . Real, old-fashioned, mind-expanding books. The kind of reads that will school you in both the mechanics and mindset of trading. Forget the social media noise—we’re listing five books that will hand you the wisdom, strategies and mental toughness you need to not just survive but thrive in the seemingly chaotic world of markets. Let’s get into it.
📖 1. Reminiscences of a Stock Operator
✍️ by Edwin Lefèvre
🧐 What’s it about : This is the OG of trading books. A classic that was first published in 1923, it follows the life of the legendary trader Jesse Livermore, who made and lost millions more times than most traders have had profitable months. It's less of a step-by-step guide and more of a philosophical deep dive into what drives traders to win, lose, and repeat the cycle.
💡 What’s the takeaway : You’ll find yourself nodding along, thinking, “Yep, been there” every few chapters. And trust us, Livermore’s lessons on greed, fear and market timing are still as relevant today as they were a century ago.
📖 2. Trading in the Zone
✍️ by Mark Douglas
🧐 What’s it about : If there’s one book that will help you stop blowing up your account because you’re caught in emotional trades, this is it. Mark Douglas breaks down the psychological barriers traders face and teaches you how to think in probabilities. Spoiler alert: The market owes you nothing. Douglas teaches you how to embrace the uncertainty of trading and act probabilistically—playing the odds, not emotions.
💡 What’s the takeaway : If you're constantly getting blindsided by your feelings, there is a high probability that this book will snap you out of that spiral and teach you how to approach the market with a level head.
📖 3. Market Wizards
✍️ by Jack D. Schwager
🧐 What’s it about : Ever wish you could pick the brains of the world’s greatest traders? Jack Schwager did it for you. This book is essentially a collection of interviews with the top traders of the 80s (think Paul Tudor Jones, Bruce Kovner, and Richard Dennis). Schwager’s interviewing style makes it feel like you’re sitting in on private conversations, absorbing their secrets, strategies and market philosophies.
💡 What’s the takeaway : There’s no single “right way” to trade. Whether you're a scalper or a trend follower, you’ll find someone here who matches your vibe. Plus, these stories prove that anyone—from a college dropout to a former blackjack player—can conquer the market with the right mindset and persistence.
📖 4. Technical Analysis of Stock Trends
✍️ by Robert D. Edwards and John Magee
🧐 What’s it about : If you’re serious about technical analysis, this is the trading bible. Originally published in 1948, this book largely introduced the world to concepts like trend lines , support and resistance , head-and-shoulders patterns , and much more. Edwards and Magee laid the foundation for almost every technical analysis tool you see around today.
💡 What’s the takeaway : This gem will teach you how to recognize trend changes, continuation patterns, and reversal signals that can sharpen your trading entries and exits.
📖 5. The Alchemy of Finance
✍️ by George Soros
🧐 What’s it about : If you want to understand not only how to trade but also how the world of finance operates, this is the book. Written by one of the most successful (and controversial) investors and currency speculators of all time, George Soros, The Alchemy of Finance is part autobiography, part deep dive into Soros' legendary "reflexivity" theory. It's not just about looking at price action—it's about understanding how traders' perceptions affect markets, often driving them in irrational directions.
💡 What’s the takeaway : Soros teaches you to think bigger than charts and numbers—to anticipate shifts in market psychology and position yourself accordingly.
Wrapping Up
You can binge all the videos, tutorials and online courses you want, but nothing beats the distilled wisdom found in a great trading book. These five reads are the perfect balance of trading psychology, real-life stories, and technical analysis insights that will help you become a better, more knowledgeable trader.
Bonus tip : if you start now, you’ve got a couple of months until Thanksgiving when you can brag about how many pages you read.
📚 Additional Picks for the Avid Trader
If you’re hungry for more insight, we’ve got a few additional picks for you. Of course, they offer a wealth of knowledge from market titans and cautionary tales from the trading trenches:
📖 More Money Than God by Sebastian Mallaby
A brilliant history of the hedge fund industry, revealing the strategies and personalities behind some of the greatest trades ever made—and showing you how the masters manage risk and opportunity.
📖 When Genius Failed by Roger Lowenstein
A cautionary tale of Long-Term Capital Management, the "genius" hedge fund that imploded in spectacular fashion. Learn what happens when ego and leverage collide in the financial world.
📖 The Man Who Solved the Market by Gregory Zuckerman
This is the story of Jim Simons and his secretive firm, Renaissance Technologies, which revolutionized trading with quantitative models. It’s a must-read for anyone intrigued by the world of algorithmic trading.
📖 Big Mistakes by Michael Batnick
Everyone makes mistakes—especially traders. This book dives into the biggest blunders made by history’s top investors and traders, showing you that even the greats are human—and how to avoid repeating their costly errors.
📖 Confusion de Confusiones by Joseph de la Vega
Originally written in 1688, this is one of the first books ever on trading (to many, the first ever), set during the time of the Dutch stock market bubble. It may be old but its lessons on speculation, greed and market psychology are as timeless as they come.
🙋♂️ What's your favorite book on trading and did it make our list? Comment below! 👇

ESSENTIAL FACTORS IN BACKTESTINGTesting trading strategies is essential for assessing their effectiveness based on historical market data. It allows traders to gain insights into how a strategy would perform under real market conditions, identify necessary adjustments, and understand various influencing factors. For instance, it can reveal how news releases impact trading outcomes or how a gradual increase in position volume can help recover losses. In this post, we will explore the most important criteria for effective testing.
Criteria for Testing Strategies on Historical Data
📍 1. Reliability and Quality of Historical Data
Accurate and comprehensive historical market data is crucial for effective testing. Any errors or omissions in the quotes can significantly skew the results. For instance, if there is a missing entry for a day that experienced a spike, the absence of this data could misrepresent the strategy's performance. This missing information might conceal a stop-loss trade that closed at a loss, ultimately distorting the yield curve and leading to misleading conclusions.
What to Consider:
🔹 Data Quality: It’s essential to use verified data sources that minimize errors and lag. Ideally, obtain quotes directly from your broker. If you are testing your strategy on third-party platforms, consider using data from TradingView.
🔹 Depth of History: The data should encompass a significant time period that includes various market conditions, such as trends, consolidations, and different volatility levels. For scalping strategies, a minimum of one year of data is recommended, while long-term strategies should be tested on data spanning more than three years.
🔹 Tick Accuracy: For high-frequency trading and scalping, having tick-level data is crucial. Conversely, for medium-term strategies, candlestick closing data may suffice.
The price history is sourced from your broker and may vary from the histories provided by other brokers due to differing liquidity providers. However, there should not be substantial discrepancies or noticeable gaps in the data.
📍 2. Reality of Order Execution
When testing a trading strategy using historical data, it's important to recognize that real trading differs significantly from backtesting:
🔹 Variable Spread: The spread can fluctuate based on market volatility, the time of day, or significant news events. It's essential to account for changing spreads during testing rather than relying on fixed values in your settings.
🔹 Slippage: Orders may be executed at prices different from the expected level, particularly in volatile markets or when liquidity is low.
🔹 Execution Delay : A delay may occur between the submission of an order and its actual execution, especially in fast-moving markets.
The key issue is that in a strategy tester, orders are executed instantly, whereas real trading involves slippage, server delays, and other factors. This can lead to discrepancies of several points. Therefore, it's advisable to establish a percentage deviation parameter to estimate the potential difference between the test results and real trading outcomes, leaning towards the conservative side. Alternatively, you can test the strategy under various spread conditions and analyze how performance metrics and the equity curve are affected by changes in the spread.
📍 3. Accounting for Commissions and Costs
Even a strategy that demonstrates positive results in a backtesting environment can become unprofitable once real trading costs are factored in:
🔹 Broker Commissions: It is crucial to consider the fixed or variable commissions charged by the broker for each trade. Some strategy testers allow you to integrate commission parameters; if that's not the case, you should manually subtract these costs from the profit for each full lot traded.
🔹 Spread: The spread can widen during periods of low liquidity, which can significantly impact profitability. Some testers include spread parameters, but others may not.
🔹 Swaps: Swap rates can vary drastically between brokers, and it’s important to remember that they can be substantial, particularly when held overnight due to rollover rates.
The core issue lies in the limitations of the testing software. If your tester does not account for floating spreads and swaps, it may be worth exploring alternative options.
📍 4. Optimization and Over-Optimization of the Strategy
While strategy testing is essential, it can lead to over-optimization, also known as data fitting. A strategy that appears perfect for historical data might not perform effectively in real market conditions.
To mitigate this risk, consider the following:
🔹 Avoid Deep Ad Hoc Parameter Fitting: Over-optimizing too many parameters for historical data can significantly reduce a strategy's robustness in live trading environments. A strategy that is fine-tuned solely for past performance may fail when faced with the unpredictability of future market conditions.
🔹 Use Forward Testing: This approach involves testing a strategy on one timeframe and then applying it to a different timeframe. This method can help prevent over-optimization by assessing the strategy's adaptability across various market conditions.
The key takeaway is achieving balance. Attempting to utilize numerous indicators simultaneously and fine-tuning their values extensively can lead to problems. If you have adjusted parameters based on a selective set of trades (let’s say, a 15-trade segment), it’s likely that you will need to readjust for different segments.
📍 5. Testing Under Different Market Conditions
To ensure comprehensive evaluation, a trading strategy should be tested under various market conditions:
🔹 Trend and Range Markets: It’s essential to verify that the strategy performs effectively during periods of strong trending markets as well as in sideways (range-bound) movements. A robust strategy should be adaptable to both scenarios.
🔹 Volatility: The strategy should be assessed across different volatility levels. While it might perform well in low-volatility environments, it may struggle or become unprofitable during sharp market movements. Testing across diverse volatility conditions is crucial for understanding the strategy's resilience.
🔹 Macroeconomic Events: Significant economic factors, such as news releases and central bank decisions, can greatly impact market behavior. Therefore, it’s important to test the strategy over timeframes that include these critical events to gauge its performance in response to external shocks.
By thoroughly testing across these varying conditions, traders can better understand the strategy’s strengths and weaknesses, leading to more informed trading decisions.
📍 6. Stress Testing
Stress testing is a crucial process for assessing the sustainability and resilience of a trading strategy under adverse conditions. Consider the following factors during stress testing:
🔹 Falling Liquidity: Evaluate how the strategy performs during scenarios of sharply reduced market liquidity. Understanding its behavior in these situations is vital, as low liquidity can lead to wider spreads and slippage, affecting trade execution and overall performance.
🔹 Price Spikes: Assess the strategy's response to unexpected price changes, such as those triggered by significant news events (e.g., interest rate announcements). Observing how the strategy reacts to rapid market movements helps gauge its robustness in volatile conditions.
🔹 Crisis Events: Testing the strategy against data from historical financial crises can provide insight into its resilience during extreme market conditions. For instance, analyzing performance during the 2008/2020 financial crisis or the market disruptions caused by geopolitical events (such as the 2022 war) can reveal potential weaknesses and strengths.
📍 7. Analyzing Strategy Metrics
After conducting tests on your trading strategy, it is essential to analyze the results through key performance metrics. The following metrics provide valuable insights into the strategy's effectiveness and risk profile:
🔹 Maximum Drawdown: This measures the maximum peak-to-trough decline in funds during the testing period. A lower drawdown indicates a less risky strategy, as it shows how much the capital could potentially decrease before recovering.
🔹 Risk/Profit Ratio: This metric assesses the profit generated for every dollar at risk. A favorable risk/profit ratio indicates that the potential rewards justify the risks taken, making the strategy more appealing.
🔹 Percentage of Profitable Trades: While the sheer number of profitable trades is important, it's equally crucial to analyze the ratio of profitable trades to losing trades. A higher percentage signifies a consistently effective strategy, but it should also be evaluated in conjunction with other metrics.
🔹 Average Profit/Loss: This metric calculates the average profit of winning trades and the average loss of losing trades. Understanding these averages helps to contextualize the strategy’s overall performance and can guide adjustments to improve outcomes.
📍 Conclusion
There is no one-size-fits-all algorithm or set of criteria for testing trading systems. Each strategy has unique characteristics that require tailored evaluation methods. However, there are general recommendations that should be considered when assessing any type of trading strategy.
Gaining an understanding of parameter selection and optimization comes with experience. It is advisable to first gather this experience on a demo account by running a strategy that has been fine-tuned in a testing environment. However, it’s important to note that testing environments may not replicate real market conditions accurately—issues such as price delays and slippage can significantly affect trade execution in live markets.
Thus, when transitioning from a demo account to a real account, continuous monitoring is essential. Traders should keep track of statistical parameters and be vigilant for any deviations from the outcomes observed during testing. This oversight will help ensure better alignment with the strategy’s expected performance and provide an opportunity to make necessary adjustments in response to changing market conditions.
Traders, If you liked this educational post🎓, give it a boost 🚀 and drop a comment 📣

Telegram Games==>Share your experiencesToday, I want to talk about Telegram programs or games that are added to their number daily, and share my experiences from these programs or games with you.
I would be happy if you share your opinion or experience with me.
First, the purpose of these programs/games is to introduce the project and their tokens to the users, and for this purpose, they give their own tokens to the users in the form of Airdrop.
Now, let's see what Airdrop means.
What is the Airdrop!?
An airdrop in crypto is when a project distributes free tokens or coins to users' wallets, often as a marketing strategy to promote the project or reward existing holders. Users may receive these tokens by holding a specific cryptocurrency or completing simple tasks.
First, I must say that what has been proven to me in the cryptocurrency market is that the crypto market has had seasons over the years, such as NFT, Metaverse, Memes, Defi, etc. This means that in these seasons, the tokens of each season have increased and received a good reception, and always the first ones in each season gave a good reception and profit to the users, and with the passage of time, their reception decreased, and then it was the turn of scam projects in It has been every season.
I gave these explanations to say that I think we are in the middle or end of Telegram's program/games season. The season began with the BINANCE:NOTUSDT was obtained by tapping to earn and introducing friends. In the Notcoin project, users received good profits.
After the BINANCE:NOTUSDT project, the Hamster game , which is supposed to be listed on September 26 in various exchanges (perhaps the price of each $HMSTR token is equal to $0.01 ), was well received by Telegram users. If the Hamster game is listed at a price of $0.01 in various exchanges, it will disappoint many users because there are few users who have more than 10,000 $HMSTR tokens, and it could be a sign of the end of the season of Telegram programs/games.
How many $HMSTR tokens did you get in Hamster!?
In the coming days, tokens of other games are going to be listed in different exchanges, for example, today the game Rocky Rabbit with GATEIO:RBTCUSDT token was listed in different exchanges, which disappointed all its users.
Now I decided to share my personal experiences with you from some of the trending Telegram games.
Catizen :
Catizen game with BINANCE:CATIUSDT token was listed on 2024 September 20 in various exchanges. Catizen game was the most famous game that was listed in different exchanges after Notcoin, although those who spent money in the game were awarded a good number of tokens, but those who played the game for more than 5 months were awarded a small number of OTC:CATI tokens. which brought the dissatisfaction of the users of this game.
In terms of entertainment, the Catizen game seemed to be boring and time-consuming.
--------------------------------------------------------------------------
Rocky Rabbit :
Rocky Rabbit game with OTC:RBTC token is listed in different exchanges today and according to the number of tokens given to users according to the time they spent in the game, it really disappointed its users.
In terms of the game space, the game is very time-consuming, the interesting point of this game was that you had to give 0.5 TON to the game to withdraw your tokens, otherwise 45% of your RBTC tokens would be burned and according to the number of tokens that Users are credited and the price of RBTC token, Rocky Rabbit game is like a scam project in my opinion.
--------------------------------------------------------------------------
MemeFi Coin :
Memefi Coin game, which is going to be listed in various exchanges on October 9, 2024.
The gameplay of Memefi Coin is so boring that you have to go through 15 levels. This game has also recently activated in-game payment and you can spend the work of someone who spent several months to go through different levels by paying 23 dollars in one day. I think this game is only looking for income in the last few days.
--------------------------------------------------------------------------
There are many games, and if I try to analyze them all for you, you might get tired; let's go to the conclusion.
My analysis of Telegram games is that with the listing of the Hamster game token, we are approaching the end of the season of Telegram games and these games are very weak in terms of entertainment and only take the time of the users and the main winners are the game creators because according to When you play, you will definitely have a low reception, so I advise you to only look at these games as entertainment, although in terms of entertainment, I think these games are of low quality.
And if the Telegram game token is listed, it is better to sell it immediately, because with the passage of time, the price of these tokens will decrease at least for a short period of time, because the users received free tokens and were waiting for the sale of these tokens for several months, and for sure, the selling pressure will be high.
Also, be careful of SCAM programs/games because surely SCAM games will increase as these games become a trend.
In my opinion, the best game that didn't take much time was BINANCE:DOGSUSDT , do you agree with me?
I would be happy to share your opinion and experiences about Telegram programs and games with me in the comments!?
Is there a Telegram game or program that you think has a good future!?
If you can analyze every game below this post like me, this post can be a source for these games.
Please do not forget the ✅' like '✅ button 🙏😊 & Share it with your friends; thanks
