What Is an Inverse Fair Value Gap (IFVG) Concept in Trading?What Is an Inverse Fair Value Gap (IFVG) Concept in Trading?
Inverse Fair Value Gaps (IFVGs) are a fascinating concept for traders seeking to refine their understanding of price behaviour. By identifying areas where market sentiment shifts, IFVGs provide unique insights into potential reversals and key price levels. In this article, we’ll explore what IFVGs are, how they differ from Fair Value Gaps, and how traders can integrate them into their strategies for more comprehensive market analysis.
What Is a Fair Value Gap (FVG)?
A Fair Value Gap (FVG) occurs when the market moves so rapidly in one direction that it leaves an imbalance in price action. This imbalance shows up on a chart as a gap between three consecutive candles: the wick of the first candle and the wick of the third candle fail to overlap, leaving a “gap” created by the second candle. It essentially highlights an area where buying or selling pressure was so dominant that the market didn’t trade efficiently.
Traders view these gaps as areas of potential interest because markets often revisit these levels to "fill" the imbalance. For example, in a bullish FVG, the gap reflects aggressive buying that outpaced selling, potentially creating a future support zone. On the other hand, bearish FVGs indicate overwhelming selling pressure, which might act as resistance later.
FVGs are closely tied to the concept of fair value. The gap suggests the market may have deviated from a balanced state, making it an area traders watch for signs of price rebalancing. Recognising and understanding these gaps can provide insights into where the price might gravitate in the future, helping traders assess key zones of interest for analysis.
Understanding Inverse Fair Value Gaps (IFVGs)
An Inverse Fair Value Gap (IFVG), or Inversion Fair Value Gap, is an Inner Circle Trader (ICT) concept that builds on the idea of an FVG. While an FVG represents a price imbalance caused by strong directional movement, an IFVG emerges when an existing FVG is invalidated. This invalidation shifts the role of the gap, turning a bearish FVG into a bullish IFVG, or vice versa.
Here’s how it works: a bearish FVG, for instance, forms when selling pressure dominates, leaving a gap that might act as resistance. However, if the market breaks through this gap—either with a wick or a candle close—it signals that the sellers in that zone have been overwhelmed. The bearish FVG is now invalidated and becomes a bullish IFVG, marking a potential area of support instead. The same applies in reverse for bullish FVGs becoming bearish IFVGs.
Traders use inverted Fair Value Gaps to identify zones where market sentiment has shifted significantly. For example, when the price revisits a bullish IFVG, it may serve as a zone of interest for traders analysing potential buying opportunities. However, if the price moves past the bottom of the IFVG zone, it’s no longer valid and is typically disregarded.
What makes these reverse FVGs particularly useful is their ability to highlight moments of structural change in the market. They can act as indicators of strength, revealing areas where price has transitioned from weakness to strength (or vice versa). By integrating IFVG analysis into their broader trading framework, traders can gain deeper insights into the evolving dynamics of supply and demand.
Want to test your IFVG identification skills? Get started on FXOpen and TradingView.
How Traders Use IFVGs in Trading
By integrating IFVGs into their strategy, traders can refine their decision-making process and uncover potential setups aligned with their broader market outlook. Here’s how IFVGs are commonly used:
Identifying Key Zones of Interest
Traders begin by spotting FVGs on price charts—areas where rapid movements create imbalances. An inversion FVG forms when such a gap is invalidated; for instance, a bearish FVG becomes bullish if the price breaks above it. These zones are then marked as potential areas of interest, indicating where the market may experience significant activity.
Contextualising Market Sentiment
The formation of an IFVG signals a shift in market sentiment. When a bearish FVG is invalidated and turns into a bullish IFVG, it suggests that selling pressure has diminished and buying interest is gaining momentum. Traders interpret this as a potential reversal point, providing context for the current market dynamics.
Analysing Price Reactions
Once an IFVG is identified, traders monitor how the price interacts with this zone. If the price revisits a bullish IFVG and shows signs of support—such as slowing down its decline or forming bullish candlestick patterns—it may indicate a strengthening upward movement. Conversely, if the price breaches the IFVG without hesitation, the anticipated reversal might not materialise.
How Can You Trade IFVGs?
IFVGs provide traders with a structured way to identify and analyse price levels where sentiment has shifted. The process typically looks like this:
1. Establishing Market Bias
Traders typically start by analysing the broader market direction. This often involves looking at higher timeframes, such as the daily or 4-hour charts, to identify trends or reversals. Tools like Breaks of Structure (BOS) or Changes of Character (CHoCH) within the ICT framework help clarify whether the market is leaning bullish or bearish.
Indicators, such as moving averages or momentum oscillators, can also provide additional context for confirming directional bias. A strong bias ensures the trader is aligning setups with the dominant market flow.
2. Identifying and Using IFVGs
Once a Fair Value Gap (FVG) is invalidated—indicating a significant shift in sentiment—it transforms into an Inverse Fair Value Gap (IFVG). Traders mark the IFVG zone as a key area of interest. If it aligns with their broader market bias, this zone can serve as a potential entry point. For instance, in a bearish bias, traders may focus on bearish IFVGs that act as potential resistance zones.
3. Placing Orders and Risk Management
Traders often set a limit order at the IFVG boundary, anticipating a retracement and for the area to hold. A stop loss is typically placed just beyond the IFVG or a nearby swing high/low to manage risk. For exits, targets might include a predefined risk/reward ratio, such as 1:3, or a significant technical level like an order block or support/resistance area. This approach ensures trades remain structured and grounded in analysis.
Advantages and Disadvantages of IFVGs
IFVGs offer traders a unique lens through which to analyse price movements, but like any tool, they come with both strengths and limitations. Understanding these can help traders incorporate IFVGs into their strategies.
Advantages
- Highlight market sentiment shifts: IFVGs pinpoint areas where sentiment has reversed, helping traders identify key turning points.
- Refined entry zones: They provide precise areas for potential analysis, reducing guesswork and offering clear levels to watch.
- Flexibility across markets: IFVGs can be applied to any market, including forex, commodities, or indices, making them versatile.
- Complementary to other tools: They pair well with other ICT tools like BOS, CHoCH, and order blocks for enhanced analysis.
Disadvantages
- Subject to interpretation: Identifying and confirming IFVGs can vary between traders, leading to inconsistencies.
- Limited standalone reliability: IFVGs need to be used alongside broader market analysis; relying solely on them increases risk.
- Higher timeframe dependence: Their effectiveness can diminish on lower timeframes, where noise often obscures true sentiment shifts.
- Potential for invalidation: While IFVGs signal potential opportunities, they aren’t guarantees; price can break through, rendering them ineffective.
The Bottom Line
Inverse Fair Value Gaps provide traders with a structured approach to identifying market shifts and analysing key price levels. By integrating IFVGs into a broader strategy, traders can uncover valuable insights and potentially refine their decision-making. Ready to apply IFVG trading in real markets? Open an FXOpen account today and explore potential trading opportunities across more than 700 markets, alongside four advanced trading platforms and competitive conditions.
FAQ
What Is an Inverse Fair Value Gap (IFVG)?
The IFVG meaning refers to a formation that occurs when a Fair Value Gap (FVG) is invalidated. For example, a bearish FVG becomes bullish after the price breaks above it, creating a potential support zone. Similarly, a bullish FVG can transform into a bearish IFVG if the price breaks below it, creating a potential resistance zone. IFVGs highlight shifts in market sentiment, providing traders with areas of interest for analysing possible reversals or continuation zones.
What Is the Difference Between a Fair Value Gap and an Inverse Fair Value Gap?
A Fair Value Gap (FVG) is an imbalance caused by aggressive buying or selling, creating a price gap that may act as support or resistance. An Inverse Fair Value Gap (IFVG) occurs when the original FVG is invalidated—indicating a shift in sentiment—and its role flips. For instance, a bearish FVG invalidated by a price breakout becomes a bullish IFVG.
What Is the Difference Between BPR and Inverse FVG?
A Balanced Price Range (BPR) represents the overlap of two opposing Fair Value Gaps (FVGs), creating a sensitive zone for potential price reactions. In contrast, an Inverse Fair Value Gap (IFVG) is a concept based on a single FVG that has been invalidated, flipping its role. While both are useful, BPR reflects the equilibrium between buyers and sellers, whereas IFVG highlights sentiment reversal.
This article represents the opinion of the Companies operating under the FXOpen brand only. It is not to be construed as an offer, solicitation, or recommendation with respect to products and services provided by the Companies operating under the FXOpen brand, nor is it to be considered financial advice.
Fundamental Analysis

Behind the Curtain: Macro Indicators That Move the Yen1. Introduction
Japanese Yen Futures (6J), traded on the CME, offer traders a window into one of the world’s most strategically important currencies. The yen is not just Japan’s currency—it’s also a barometer for global risk appetite, a funding vehicle for the carry trade, and a defensive asset when markets turn volatile.
But what truly moves Yen Futures?
While many traders fixate on central bank statements and geopolitical news, machine learning tells us that economic indicators quietly—but consistently—steer price action. In this article, we apply a Random Forest Regressor to reveal the top macroeconomic indicators driving 6J Futures across daily, weekly, and monthly timeframes, helping traders of all styles align their strategies with the deeper economic current.
2. Understanding Yen Futures Contracts
Whether you’re trading institutional size or operating with a retail account, CME Group offers flexible exposure to the Japanese yen through two contracts:
o Standard Japanese Yen Futures (6J):
Contract Size: ¥12,500,000
Tick Size: 0.0000005 = $6.25 per tick
Use Case: Institutional hedging, macro speculation, rate differential trading
o Micro JPY/USD Futures (MJY):
Contract Size: ¥1,250,000
Tick Size: 0.000001 = $1.25 per tick
Use Case: Retail-sized access, position scaling, strategy testing
o Margin Requirements:
6J: Approx. $3,300 per contract
MJY: Approx. $330 per contract
Both products offer deep liquidity and near 24-hour access. Traders use them to express views on interest rate divergence, U.S.-Japan trade dynamics, and global macro shifts—all while adjusting risk through contract size.
3. Daily Timeframe: Top Macro Catalysts
Short-term movements in Yen Futures are heavily influenced by U.S. economic data and its impact on yield spreads and capital flow. Machine learning analysis ranks the following three as the most influential for daily returns:
10-Year Treasury Yield: The most sensitive indicator for the yen. Rising U.S. yields widen the U.S.-Japan rate gap, strengthening the dollar and weakening the yen. Drops in yields could create sharp yen rallies.
U.S. Trade Balance: A narrowing trade deficit can support the USD via improved capital flow outlook, pressuring the yen. A wider deficit may signal weakening demand for USD, providing potential support for yen futures.
Durable Goods Orders: A proxy for economic confidence and future investment. Strong orders suggest economic resilience, which tends to benefit the dollar. Weak numbers may point to a slowdown, prompting defensive yen buying.
4. Weekly Timeframe: Intermediate-Term Indicators
Swing traders and macro tacticians often ride trends formed by mid-cycle economic shifts. On a weekly basis, these indicators matter most:
Fed Funds Rate: As the foundation of U.S. interest rates, this policy tool steers the entire FX complex. Hawkish surprises can pressure yen futures; dovish turns could strengthen the yen as yield differentials narrow.
10-Year Treasury Yield (again): While impactful daily, the weekly trend gives traders a clearer view of long-term investor positioning and bond market sentiment. Sustained moves signal deeper macro shifts.
ISM Manufacturing Employment: This labor-market-linked metric reflects production demand. A drop often precedes softening economic growth, which may boost the yen as traders reduce exposure to riskier assets.
5. Monthly Timeframe: Structural Macro Forces
For position traders and macro investors, longer-term flows into the Japanese yen are shaped by broader inflationary trends, liquidity shifts, and housing demand. Machine learning surfaced the following as top monthly influences on Yen Futures:
PPI: Processed Foods and Feeds: A unique upstream inflation gauge. Rising producer prices—especially in essentials like food—can increase expectations for tightening, influencing global yield differentials. For the yen, which thrives when inflation is low, surging PPI may drive USD demand and weaken the yen.
M2 Money Supply: Reflects monetary liquidity. A sharp increase in M2 may spark inflation fears, sending interest rates—and the dollar—higher, pressuring the yen. Conversely, slower M2 growth can support the yen as global liquidity tightens.
Housing Starts: Serves as a growth thermometer. Robust housing data suggests strong domestic demand in the U.S., favoring the dollar over the yen. Weakness in this sector may support yen strength as traders rotate defensively.
6. Trade Style Alignment with Macro Data
Each indicator resonates differently depending on the trading style and timeframe:
Day Traders: React to real-time changes in 10-Year Yields, Durable Goods Orders, and Trade Balance. These traders seek to capitalize on intraday volatility around economic releases that impact yield spreads and risk appetite.
Swing Traders: Position around Fed Funds Rate changes, weekly shifts in Treasury yields, or deteriorating labor signals such as ISM Employment. Weekly data can establish trends that last multiple sessions, making it ideal for this style.
Position Traders: Monitor PPI, M2, and Housing Starts for broader macro shifts. These traders align their exposure with long-term shifts in capital flow and inflation expectations, often holding positions for weeks or more.
Whatever the style, syncing your trading plan with the data release calendar and macro backdrop can improve timing and conviction.
7. Risk Management
The Japanese yen is a globally respected safe-haven currency, and its volatility often spikes during geopolitical stress or liquidity events. Risk must be managed proactively, especially in leveraged futures products.
8. Conclusion
Japanese Yen Futures are a favorite among global macro traders because they reflect interest rate divergence, risk sentiment, and global liquidity flows. While headlines grab attention, data tells the real story.
Stay tuned for the next installment of the "Behind the Curtain" series, where we continue uncovering what really moves the futures markets.
When charting futures, the data provided could be delayed. Traders working with the ticker symbols discussed in this idea may prefer to use CME Group real-time data plan on TradingView: www.tradingview.com - This consideration is particularly important for shorter-term traders, whereas it may be less critical for those focused on longer-term trading strategies.
General Disclaimer:
The trade ideas presented herein are solely for illustrative purposes forming a part of a case study intended to demonstrate key principles in risk management within the context of the specific market scenarios discussed. These ideas are not to be interpreted as investment recommendations or financial advice. They do not endorse or promote any specific trading strategies, financial products, or services. The information provided is based on data believed to be reliable; however, its accuracy or completeness cannot be guaranteed. Trading in financial markets involves risks, including the potential loss of principal. Each individual should conduct their own research and consult with professional financial advisors before making any investment decisions. The author or publisher of this content bears no responsibility for any actions taken based on the information provided or for any resultant financial or other losses.

Will Your Tether Holdings Be Frozen Overnight?Hello and greetings to all the crypto enthusiasts ,✌
Spend 2 minutes ⏰ reading this educational material. The main points are summarized in 3 clear lines at the end 📋 This will help you level up your understanding of the market 📊 and Bitcoin💰.
🎯 Analytical Insight on Bitcoin: A Personal Perspective:
Since this is an educational analysis, I’ve kept the chart as simple as possible and provided the most concise Bitcoin analysis. 📉
The price is currently in a descending channel and approaching a key daily resistance level. I expect at least an 8% decline, with $75,000 acting as a major support zone. 📈
Now, let's dive into the educational section, which builds upon last week's lesson (linked in the tags of this analysis). Many of you have been eagerly waiting for this, as I have received multiple messages about it on Telegram.
🧐 Educational Segment: Will Your Tether Holdings Be Frozen Overnight?
Understanding the EU’s New Crypto Regulations 🇪🇺 🔍
In 2023, the European Union (EU) introduced the Markets in Crypto-Assets Regulation (MiCA), a comprehensive legal framework aimed at increasing oversight of the cryptocurrency market. The primary objective of this regulation is to bring stability, transparency, and security to a sector that has historically operated with minimal supervision. One of the core focuses of MiCA is stablecoins, particularly their issuance, reserves, and compliance with anti-money laundering (AML) and counter-terrorism financing (CTF) laws.
The EU prefers highly regulated and trackable stablecoins, such as PayPal’s PYUSD, as these provide greater oversight of financial transactions. Under the new regulatory landscape, if Tether (USDT) fails to meet the EU’s compliance standards, authorities may restrict its usage within the European financial system and exchanges operating in the region. However, it is important to note that such restrictions would be a gradual process, not an abrupt overnight decision. ⏳⚖️
Who Will Be Affected? 🤔📉
These potential regulations primarily impact crypto traders, businesses, and exchanges operating within the EU. If Tether does not secure regulatory approval, platforms serving European customers may be required to delist or limit USDT transactions, similar to past instances where regulatory scrutiny led to the delisting of certain assets in specific jurisdictions.
For individuals and businesses outside of the EU, particularly those using offshore or decentralized platforms, the immediate effects of these regulations would likely be minimal. However, broader market shifts and liquidity changes may still indirectly influence USDT trading volume and availability. 🌍📊
Will Tethers in High-Tension Middle Eastern Countries Be Frozen? 🚨🏦
Geopolitical Risks and US Sanctions 🇺🇸⚠️
Beyond EU regulations, concerns have arisen about whether Tether could be frozen in certain politically sensitive regions, particularly in conflict-prone areas of the Middle East. Given the U.S. government’s control over the global financial system and its increasing scrutiny of crypto transactions, there is speculation that Tether Holdings Ltd. could be pressured to comply with U.S. foreign policy directives, including asset freezes linked to sanctioned individuals, entities, or countries.
Historically, the Office of Foreign Assets Control (OFAC) has taken a firm stance against financial transactions that could be linked to terrorism financing, money laundering, or sanctions violations. While Tether itself is not a U.S.-based company, it does interact with U.S. financial institutions and has previously cooperated with law enforcement agencies to freeze assets tied to criminal activities. 🏛️🔎
If geopolitical tensions worsen, there is a possibility that Tether’s compliance team may receive direct or indirect pressure to restrict access to its stablecoin in certain jurisdictions, mirroring actions previously taken against other crypto wallets and sanctioned entities. 🔥💰
How Can Users Protect Themselves? 🛡️💡
For individuals and businesses operating in high-risk regions, it is crucial to stay informed about potential regulatory and geopolitical shifts. Strategies to mitigate risks include:
Diversifying stablecoin holdings by using multiple assets (e.g., DAI, USDC, or algorithmic stablecoins). 🔄💱
Utilizing decentralized finance (DeFi) solutions that reduce reliance on centralized stablecoin issuers. 🏗️🔐
Exploring on-chain privacy solutions to protect financial autonomy within legal and ethical boundaries. 🕵️♂️📲
Keeping funds in non-custodial wallets rather than centralized exchanges, which are more susceptible to regulatory enforcement. 🔑📜
In an upcoming guide , I will provide a comprehensive tutorial on how to protect your identity and crypto holdings while navigating regulatory challenges and geopolitical risks. Stay tuned for a detailed breakdown of secure storage, alternative stablecoins, and advanced privacy measures. 🚀🔮
However , this analysis should be seen as a personal viewpoint, not as financial advice ⚠️. The crypto market carries high risks 📉, so always conduct your own research before making investment decisions. That being said, please take note of the disclaimer section at the bottom of each post for further details 📜✅.
🧨 Our team's main opinion is: 🧨
The EU’s MiCA regulations may restrict Tether (USDT) in European exchanges, but it won’t happen overnight. 🌍 Meanwhile, rising geopolitical tensions spark fears that the U.S. could freeze USDT in certain regions. If you’re outside these areas, the impact is minimal, but diversifying assets** is a smart move. Stay tuned for my next guide on protecting your identity, wallets, and crypto holdings!
Give me some energy !!
✨We invest countless hours researching opportunities and crafting valuable ideas. Your support means the world to us! If you have any questions, feel free to drop them in the comment box.
Cheers, Mad Whale. 🐋

Convexity-based trade scenario using LOAR stock and the April 17Yo traders -
Let’s map out a convexity-based trade scenario using LOAR stock and the April 17, 2025 $75 Call option — currently trading at $1.00, with the stock at $65.97 and only 18 days to expiry.
🔍 Step-by-Step Breakdown:
🧠 1. Basic Structure
You’re buying the LOAR Apr17 $75 call at $1.00.
This is a deep OTM bet (~13.7% above current price).
You’re betting on a short-term move to $75+, meaning volatility spike or news catalyst.
⚙️ 2. Convexity Setup
Convexity means:
Small risk, asymmetric reward
If LOAR stays flat or dips → you lose $1 per contract
If LOAR rips to $80+ → this option could return 5x to 10x+
LOAR Price at Expiry Option Intrinsic Value Profit/Loss
$66 (flat) $0 -$1.00
$70 $0 -$1.00
$75 (strike) $0 -$1.00
$77 $2.00 +$1.00
$80 $5.00 +$4.00 (5x)
$85 $10.00 +$9.00 (9x)
🧾 3. Chart + Sentiment Setup
Looking at the TradingView chart:
Price Action:
LOAR is basing around $66 after a steep downtrend — potential reversal pattern
Volume is light, but some buy pressure is visible
MACD:
Appears to be flattening and potentially crossing bullish
RSI:
~40s: Oversold-to-neutral zone. Could support upward bounce.
Earnings coming up (E icon):
Strong potential for a catalyst move
This setup enhances convexity, because earnings can produce gap moves that DOTM options profit from disproportionately.
🔮 4. Convexity Scenario Thesis (Narrative)
"LOAR has pulled back hard and is showing signs of base-building. Earnings are in 2–3 weeks. If guidance surprises to the upside — or macro tailwinds hit the sector — a short squeeze or re-rating toward $75–80 could occur. I’m risking $1 per contract for a shot at $5–10. If it doesn’t move, I accept the full loss."
This is a classic event-driven convexity play.
⚠️ 5. Risks & Considerations
Time decay is brutal: With only 18 days left, theta decay accelerates daily
IV Crush post-earnings could hurt even if the stock moves
You need a fast, strong move, ideally before or at earnings
Position sizing is critical: This is a "lottery ticket" — don’t over-allocate
✅ 6. Ideal for Your Strategy If:
You're making many small bets like this across tickers/catalysts
You’re not trying to be “right” often, but “big” occasionally
You have capital discipline and uncorrelated base assets
🧮 Position Size:
Option price = $1.00 per contract
You buy 100 contracts of the $75 call
Total risk = $100
Each $1.00 move above $75 = $100 profit per $1, since 100 contracts × 100 shares/contract = 10,000 shares exposure
📈 Upside Payoff Table
LOAR Price at Expiry Intrinsic Value Total Payoff Net P&L Return on $100
$65–$74.99 $0.00 $0 -$100 -100%
$76 $1.00 $1 × 10,000 = $10,000 +$9,900 +9,900%
$77 $2.00 $20,000 +$19,900 +19,900%
$80 $5.00 $50,000 +$49,900 +49,900%
$85 $10.00 $100,000 +$99,900 +99,900%
$90 $15.00 $150,000 +$149,900 +149,900%
$100 $25.00 $250,000 +$249,900 +249,900%
🧠 Interpretation
Max Loss: $100 (fixed, regardless of LOAR's move down or sideways)
Breakeven at Expiry: LOAR must hit $76.00
10x return if LOAR trades just $1 above strike
Massive asymmetry — you risk $100 for a shot at $10k–250k if LOAR rips on earnings or news.
📌 Real-World Considerations:
You might exit early if the option spikes in value before expiry (e.g., stock runs to $72 with 5 days left).
Liquidity may limit large size fills.
Volatility matters: IV spike pre-earnings or a big gap post-earnings increases your chance of profit.
📊 Convex Payoff Table for LOAR Apr17 $75 Call (100 Contracts, $100 Risk)
LOAR Price at Expiry % Move from $65.97 Intrinsic Value Total Payoff Net P&L Return on $100
$65–$74.99 0% to +13.6% $0.00 $0 -$100 -100%
$76 +15.2% $1.00 $10,000 +$9,900 +9,900%
$77 +17.0% $2.00 $20,000 +$19,900 +19,900%
$80 +21.3% $5.00 $50,000 +$49,900 +49,900%
$85 +28.9% $10.00 $100,000 +$99,900 +99,900%
$90 +36.4% $15.00 $150,000 +$149,900 +149,900%
$100 +51.6% $25.00 $250,000 +$249,900 +249,900%
🧠 Takeaway:
Even a 15% move turns your $100 into $10,000 — this is why convex trades are so powerful.
But the trade-off is probability: the odds of a 15–50%+ move in 18 days are low, which is why risk is capped and position sizing matters.

Mastering Risk Management in Trading: The Ultimate GuideMastering Risk Management in Trading: The Ultimate Guide
In the world of trading, success isn’t measured only by big wins but by how well you protect your capital from unnecessary losses. Risk management isn’t just a safety net—it’s the backbone of sustainable trading. In this comprehensive guide, we’ll break down the principles and strategies you need to safeguard your account while still maximizing your profit potential.
---
1. Risk-Reward Ratio: The Foundation of Every Trade
- What it is:
The risk-reward ratio is the cornerstone of every trade. It tells you how much potential reward you’re targeting compared to the risk you’re willing to take. For instance, if you risk $100 and aim to make $200, your risk-reward ratio is 1:2—a commonly accepted standard in trading.
- How to use it:
- Always predefine your risk-reward ratio before entering a trade.
- For swing traders, aim for a minimum of 1:2 or 1:3 to justify holding overnight.
---
2. Position Sizing: The Key to Survival
- Why position sizing matters:
Position sizing ensures you don’t over-leverage your account or lose too much in a single trade. Many traders fail because they bet too big and get wiped out after just a few losing trades.
- How to calculate position size:
- Use this formula:
Position Size = (Account Risk $ ÷ (Entry Price - Stop-Loss Price)).
- For example, if you’re risking $100 per trade and the difference between your entry and stop-loss is $5, your position size should be 20 units (100 ÷ 5).
---
3. Stop-Loss Orders: Your Safety Net
- What is a stop-loss?
A stop-loss is your emergency brake. It’s an order you set in advance to sell your position if the price moves against you by a specified amount.
- How to set stop-losses:
- Use technical analysis to place your stop-loss below support levels for long trades or above resistance levels for short trades.
- Avoid placing stop-losses too close to your entry point, as small fluctuations might trigger them unnecessarily.
Here you can see my ratio is on the low side so i can place a tactical TP and SL in relation to liquidity lines.
---
4. The Art of Diversification: Spreading Risk
- Why diversification works:
Putting all your capital into a single trade or instrument increases your risk. Diversification spreads that risk across multiple trades or markets, reducing the impact of any single loss.
- How to diversify effectively:
- Trade across multiple sectors or currency pairs.
- Avoid overexposure to correlated assets (e.g., don’t trade EUR/USD and GBP/USD simultaneously).
---
5. Emotional Discipline: Winning the Mental Game
- Why it matters:
Even the best trading strategy can fail if emotions like fear or greed take over. Emotional trading leads to impulsive decisions, revenge trading, and overtrading.
- How to maintain discipline:
- Stick to your trading plan, no matter what.
- Use tools like meditation, journaling, or physical exercise to manage stress.
---
6. Dynamic Risk Management: Adapting to Changing Markets
- Adjusting your strategy:
Markets are dynamic, and your risk management should adapt. Volatility can change quickly, requiring you to adjust your stop-loss distance or position size.
- Use ATR (Average True Range):
The ATR is a great tool to measure market volatility and decide how much room to give your stop-loss.
---
7. Tracking and Reviewing Your Trades
- The power of a trading journal:
Every trade is a learning opportunity. Keep detailed records of your trades, including your reasoning, execution, and results.
- What to include in your journal:
- Entry and exit points.
- Risk-reward ratio.
- Mistakes or deviations from the plan.
- Lessons learned.
---
Conclusion: Plan the Trade, Trade the Plan
Risk management isn’t just a skill—it’s a habit. By understanding your risk-reward ratio, managing position sizes, using stop-losses effectively, and staying emotionally disciplined, you can protect your capital and increase your chances of long-term success.
Take a moment to reflect: How do you manage risk in your trading? Are there areas you could improve? Start implementing these strategies today, and watch how they transform your trading results.

How I Used COT to Make $2,450 in Crude Oil This WeekI show you my process from start to finish, the same process I use every week to profit from the markets.
-Fundamental Setup
-Confirmation
-Technical Entry
-Exit/Stop

Eternal Sunshine of the Spotless MindHere you have Charles Thomas Munger, the permanent vice president of one of the most successful companies in the world, Berkshire Hathaway. He was not at the origins of this business, but it was Charles, together with Warren Buffett, who turned a dying enterprise into a star of the world stock market. It didn't take a Master's degree in Business Administration or incredible luck. As Mr. Munger said, to succeed you don't necessarily have to strive to be the smartest, you just have to be not stupid and avoid the standard ways of failure. He worked as a meteorologist, then a lawyer, and finally as someone we know well - an investor who inspired many to take a smart approach to business and their own lives.
“I don’t think you should become president or a billionaire because the odds are too great against you. It is much better to set achievable goals. I didn't set out to become rich, I set out to be independent. I just went a little overboard”, Charles joked. Wake up every morning, work hard, be disciplined and surprisingly, everything will work out very well. This commandment sounds a little archaic in times of rapid rise and easy money. However, for anyone who thinks years and decades ahead, it is difficult to come up with something better.
Speaking to students at his hometown University of Michigan, Mr. Munger said the most important decision you make in life is not your business career, but your marriage. It will do more good or bad for you than anything else. He attached such great importance to human relationships. This correlates strongly with a study of human happiness that has been ongoing for over 85 years under the auspices of Harvard University. The scientists' main conclusion was that everything we build (portfolios, businesses, strategies) is worthless if there is no person in our lives to whom we can say a simple “I'm here”. Or “Thank you”. Or “I love you”.
The healthiest and happiest in old age were not those subjects who earned the most. And those who have maintained good, trusting relationships. Marital. Friendly. Related. And in this light, Charles Munger's words about caution, moderation and common-sense sound quite different. It's not about money. It's about a life that can be lived with the feeling that you have enough. That you don't have to be a hero. That you can just be a reasonable person. Loving. Healthy. Calm.
Perhaps this is the main secret of Mr. Munger's success in the stock market? In the long run, the one who has already won achieves a positive result.
November 28th, 2023, was the last day of the cheerful Charlie's life. There were 34 days left until his 100th birthday.

Is There the Best Time to Trade Forex in the UK?Is There the Best Time to Trade Forex in the UK?
Grasping the nuances of forex market hours is essential for traders aiming to optimise their strategies. Operating continuously from Sunday evening to Friday night, the currency market accommodates participants across various time zones without being anchored to a singular physical location.
For those in the UK, recognising when to engage can dramatically influence outcomes. This FXOpen article discusses the pivotal currency trading sessions that may be optimal for UK-based traders.
Understanding Forex Market Hours
Understanding currency exchange market hours is crucial for anyone involved in the global foreign exchange market. Although you may already know this, let us remind you.
The forex market operates on a 24/5 basis, opening during weekdays and closing at weekends. This round-the-clock trading is possible because it’s not tied to a physical location; instead, it relies on a decentralised network of banks, businesses, and individuals exchanging currencies across different time zones.
For traders in the UK, knowing the best forex trading hours can be key to effective trading. The currency market is broadly divided into four main 9-hour-long windows, each starting at different times to cater to traders across the globe. The forex session times UK traders need to be aware of are:
- Sydney Session: 9:00 PM GMT - 6:00 AM GMT
- Tokyo Session: 11:00 PM GMT - 8:00 AM GMT
- London Session: 8:00 AM GMT - 5:00 PM GMT
- New York Session: 1:00 PM GMT - 10:00 PM GMT
Note that during British Summer Time (BST), some of these times are shifted forward by one hour.
These forex market trading times are essential to know, as they indicate when liquidity and volatility are likely to increase, potentially offering favourable market conditions.
The Optimal Times to Trade Forex in the UK
In navigating currency trading, UK-based traders should be aware of two key sessions: London and New York. These periods are optimal forex market hours in the UK, offering greater volumes, volatility, and liquidity. They’re also the periods that see the most releases for three of the major economies: the UK, Eurozone, and the US.
The core forex trading times in the UK are anchored around the London session, which is central to global forex market operations due to London's key position in the financial world. The London trading session time in the UK commences at 8:00 AM GMT (winter time).
This period, ending at 5:00 PM GMT (winter time), is pivotal as it accounts for roughly half of the forex transactions globally, making it a prime trading time due to the high liquidity and the potential for more pronounced price movements.
Likewise, the London-New York trading session time in the UK can be especially advantageous. It’s a crucial overlapping window occurring from 1:00 PM to 5:00 PM GMT (winter time), offering an avenue for traders seeking to maximise their potential returns due to the surge in activity and high-profile economic releases from the US.
During this window, the US stock market opens at 2:30 PM GMT. This secondary opening can also have a notable effect on US dollar-based pairs.
Economic Releases and the Impact on Trading Times for UK Traders
Economic releases and central bank announcements significantly influence UK forex trading times, often driving prices higher or lower. Many UK economic releases—affecting GBP currency pairs—are scheduled around 7:00 AM GMT. This timing offers traders opportunities to engage in trends post-release during the early hours of the London open.
However, some UK data and plenty of Eurozone data are released between 8:00 AM GMT and 10:00 AM GMT, periods typically characterised by increased liquidity and volatility, providing fertile ground for traders.
Likewise, many high-profile US economic announcements—non-farm payrolls, inflation statistics and employment data— are made between 1:00 PM GMT and 3:00 PM GMT. Given the US dollar's dominance on the world stage, these releases can present significant trading opportunities.
Although activity tends to quiet down after London closes, the late hours of the New York session still offer potential entries, albeit with generally lower volatility and volume.
Notably, Federal Reserve interest rate decisions are announced at 7:00 PM GMT with a press conference held after that can cause outsized price movements. The same can be said for the Bank of England and European Central Bank’s interest rate decisions at 12:00 PM GMT and 1:15 PM GMT, respectively, and their subsequent press conferences.
The Worst Time to Trade Forex in the UK
The worst times to trade forex in the UK often occur after 8:00 PM GMT, during the tail end of New York’s hours, when liquidity and volume significantly decrease. This reduction in activity can lead to less favourable trading conditions, including wider spreads and slower execution times.
Additionally, while the Asian session forex time in the UK, partially overlapping with the Sydney session, runs from 11:00 PM to 8:00 AM GMT, it presents challenges for UK traders.
Despite offering trading opportunities, especially in Japanese yen, Australian dollar, and New Zealand dollar-based pairs, the volumes during this period are substantially lower compared to the London and New York sessions. The Tokyo session forex time in the UK accounts for particularly unsociable hours anyway, so many UK traders are unlikely to engage in currency trading during this period.
Trading the London Session: A Strategy
The Asian-London Breakout Strategy leverages the unique dynamics between the calmer Asian session and the volatile London session. It involves setting buy/sell stop orders at the high and low points of the Asian period’s range, aiming to capture movements as London opens at 8:00 AM GMT.
With stop-loss orders placed above or below the range and a strategic approach to take profit – either at the end of the London session or by trailing a stop loss during the day – traders can potentially capitalise on the surge in activity. To delve deeper into this strategy and other session-based setups, consider exploring FXOpen’s 3-session trading system article.
The Bottom Line
Understanding forex trading hours and leveraging optimal times are pivotal for achieving favourable outcomes in currency trading. Luckily, UK-based traders are well placed to take advantage of the many opportunities the currency market presents, given their ability to trade both the London and New York sessions.
For UK traders seeking to navigate the complexities of markets with a trusted broker, opening an FXOpen account can provide all of the tools and insights necessary for effective trading.
FAQs
When Do the Forex Markets Open in the UK?
Forex opening times in the UK start at 8:00 AM GMT (winter time) and at 7:00 AM GMT (summer time) when the London session begins, marking the start of significant trading activity due to London's central role in the global currency arena.
What Time Does the Forex Market Open on Sunday in the UK?
The forex market opens on Sunday at 9:00 PM GMT (winter time) and at 10:00 PM GMT (summer time) in the UK, coinciding with Sydney’s opening and marking the beginning of the trading week.
What Time Does the Forex Market Close on Friday in the UK?
The forex market closes at 10:00 PM GMT (winter time) and at 9:00 PM GMT (summer time) on Friday in the UK, concluding with the end of the New York session and wrapping up the trading week.
Can You Trade Forex on Weekends?
Currency trading on weekends is not possible as the market is closed. Trading resumes with the opening of the Sydney session on Sunday at 9:00 PM GMT (winter time) and at 10:00 PM GMT (summer time).
This article represents the opinion of the Companies operating under the FXOpen brand only. It is not to be construed as an offer, solicitation, or recommendation with respect to products and services provided by the Companies operating under the FXOpen brand, nor is it to be considered financial advice.

US Cash Market Goes 'Flippant'. Understanding Revenge in TradingFirst of all, revenge trading is a destructive pattern of behavior in trading where individuals make impulsive and emotionally-driven decisions in an attempt to recoup previous losses. This practice is not limited to novice traders; even experienced traders can fall prey to it. The primary emotions driving revenge trading include anger, frustration, greed, fear, and shame, which cloud judgment and lead to irrational decision-making.
Causes of Revenge Trading
Emotional Response: Traders often react emotionally to significant losses, feeling compelled to immediately recover their losses without adequate analysis or strategy.
Lack of Discipline: Deviating from established trading plans and risk management principles is common in revenge trading.
Psychological Triggers: Feelings of injustice, anger, or a desire for vengeance against the market can trigger revenge trading.
Consequences of Revenge Trading
Financial Losses: Revenge trading often results in larger losses due to riskier trades and poor timing.
Emotional Burnout: The stress and frustration from repeated losses can lead to emotional exhaustion and decreased trading performance.
Career Impact: Persistent revenge trading can erode confidence and lead to a trader questioning their abilities.
Real-Life Examples of Revenge Trading
Increasing Position Size: A trader experiences a significant loss and decides to double or triple their position size in the next trade, hoping to quickly recover their losses. This action disregards risk management principles and often leads to even greater losses.
Ignoring Stop-Loss Orders: After a loss, a trader might hold onto a losing position longer than planned, hoping it will turn around. This behavior ignores established stop-loss orders and can result in further financial damage.
Chasing Trades: A trader feels compelled to enter trades without proper analysis, driven by the urge to recoup losses quickly. This impulsive behavior can lead to a series of poor trading decisions.
Market Reversal Scenario: A trader suffers a loss due to a sudden market reversal. In an attempt to recover, they enter a trade in the opposite direction without thorough analysis, which can exacerbate their losses.
Wish more examples? Watch recent one below 👇👇
How to Avoid Revenge Trading
To avoid revenge trading, traders should focus on maintaining discipline and adhering to their trading strategies. This includes:
Taking Breaks: After a loss, taking time to reassess the market and calm emotions can help prevent impulsive decisions.
Sticking to Plans: Adhering to established trading plans and risk management principles is crucial.
Emotional Awareness: Recognizing emotional triggers and taking steps to manage them can help prevent revenge trading.
In conclusion, revenge trading is a HARMFUL AND DANGEROUS practice that can lead to significant financial and emotional consequences. Understanding its causes and recognizing its signs are essential steps in avoiding this behavior and maintaining a successful trading career.
--
Best wishes,
@PandorraResearch Team 😎

Think Like a Pro: Trade with Discipline, Not Emotion **Taming Greed: The Secret to Long-Term Trading Success**
Trading is a battlefield of emotions—**excitement, fear, hope, and greed**. Among them, **greed is the silent killer**, pushing traders to overtrade, overleverage, and chase the market, ultimately leading to disaster.
As the saying goes:
📉 **“Bulls make money, bears make money, but pigs get slaughtered.”**
**Why Greed is Your Worst Enemy**
Fear may hold you back, but **greed pushes you into reckless decisions**. It makes you **ignore your trading plan, risk too much, and hold losing trades for too long**—all in pursuit of bigger gains.
But here’s the truth: **The market rewards patience, not desperation.**
**How to Keep Greed in Check & Trade Like a Pro**
🔥 **Follow a Strict Trading Plan**
A well-defined **plan is your shield against impulsive decisions**. Know your entry, exit, and risk before placing a trade. **Discipline beats greed—every time.**
📊 **Master Risk Management**
Avoid the temptation to **bet big for quick gains**. A strong **risk strategy protects your capital** and ensures survival in the long run. The goal isn’t just to win—it’s to stay in the game.
⏳ **Say No to Overtrading**
More trades don’t mean more profits—**it usually means more losses**. Trade **with precision, not emotion**. If you’re trading just for the thrill, **you’re gambling, not investing**.
**Success = Patience + Discipline**
Greed is an illusion—it promises wealth but delivers ruin. The real path to trading mastery lies in **consistency, control, and calculated risks**.
💡 **Trade smart. Stay disciplined. Build wealth the right way.**

High Volatility Trade Management & Risk Management Strategies
With a current geopolitical uncertainty and the election of Trump, forex market and gold experience wild price fluctuations. These unpredictable swings can result in substantial losses, particularly for the beginners in trading.
In this article, I will share with you the essential trade management and risk management tips for dealing with extreme volatility in trading.
I will reveal proven strategies and techniques for avoiding losses and unexpected risks.
1. First and foremost, pay attention to the news.
The main driver of high volatility on the markets are the news , especially the bad ones.
In normal times, high impact news events are relatively rare, while in times of uncertainty their frequency increases dramatically.
Such news may easily invalidate the best technical analysis setup: any powerful support or resistance level, strong price action or candle stick pattern can be easily overturned by the fundamentals.
Trump tariffs threats against Canada made USDCAD rise by 400 pips rapidly, while the change of rhetoric quickly returned the prices to previous levels.
One you hold an active trade, monitor the news. If you see the impactful news that may affect the pair or instrument that you trade, immediately protect your position, moving stop loss to entry.
It will help you avoid losses if the market starts going against you.
2. Even constantly monitoring the news, you will not be able to protect yourself from all the surprising movements.
Sometimes your trades will quickly be closed in a loss.
Therefore, I strictly recommend measure a lot size for every trade that you take. Make sure that you risk no more than 1% of your trading account per trade. That will help you to minimize losses cased by the impactful, uncertain events.
3. The impactful events may also occur on weekend, while Forex market is closed. Such incidents can be the cause of huge gap openings.
If you hold an active trading position over the weekend, remember that your entire account can be easily blown with such gaps.
Imagine that you decided to buy EURUSD on Friday during the NY session and keep holding the position over the weekend.
A huge gap down opening would make you face huge losses, opening the market 125 pips below the entry level.
By the way, this day I received a dozen of messages from my followers that their accounts were blown with the opening gaps.
4. If you see a significant price movement caused by some events, and you did not manage to catch it, let it go.
Jumping in such movements is very risky because quite ofter correctional movements will follow quickly.
It will be much safer and better to try to be involved in a trend continuation after a pullback.
Look what happened with Gold when Trump began a new trade war.
The price started to grow rapidly. However, even during such a sentiment, 500 pips pullback occurred, giving patient traders a safe entry point for the trade.
5. In the midst of geopolitical tensions and trade wars, the markets tend to rally or fall for the extended time periods.
The best trading strategies to use to get maximum from such movements are trend-following strategies.
While reversal, counter-trend trading might be extremely risky, providing a lot of false signals.
Trend trading may bring extraordinary profits.
These trading tips, risk management and trade management strategies and secrets are tailored for cutting and avoiding losses during dark times. Empower your strategy with this useful knowledge and good luck to you in trading high volatility on Gold and Forex.
❤️Please, support my work with like, thank you!❤️
I am part of Trade Nation's Influencer program and receive a monthly fee for using their TradingView charts in my analysis.

What Is a Liquidity Sweep and How Can You Use It in Trading?What Is a Liquidity Sweep and How Can You Use It in Trading?
Mastering key concepts such as liquidity is crucial for optimising trading strategies. This article explores the concept of a liquidity sweep, a pivotal phenomenon within trading that involves large-scale players impacting price movements by triggering clustered pending orders, and how traders can leverage them for deeper trading insights.
Understanding Liquidity in Trading
In trading, liquidity refers to the ability to buy or sell assets quickly without causing significant price changes. This concept is essential as it determines the ease with which transactions can be completed. High liquidity means that there are sufficient buyers and sellers at any given time, which results in tighter spreads between the bid and ask prices and more efficient trading.
Liquidity is often visualised as the market's bloodstream, vital for its smooth and efficient operation. Financial assets rely on this seamless flow to ensure that trades can be executed rapidly and at particular prices. Various participants, including retail investors, institutions, and market makers, contribute to this ecosystem by providing the necessary volume of trades.
Liquidity is also dynamic and influenced by factors such as notable news and economic events, which can all affect how quickly assets can be bought or sold. For traders, understanding liquidity is crucial because it affects trading strategies, particularly in terms of entry and exit points in the markets.
What Is a Liquidity Sweep?
A liquidity sweep in trading is a phenomenon within the Smart Money Concept (SMC) framework that occurs when significant market players execute large-volume trades to trigger the activation of a cluster of pending buy or sell orders at certain price levels, enabling them to enter a large position with minimal slippage. This action typically results in rapid price movements and targets what are known as liquidity zones.
Understanding Liquidity Zones
Liquidity zones are specific areas on a trading chart where there is a high concentration of orders, including stop losses and pending orders. These zones are pivotal because they represent the levels at which substantial buying or selling interest is anticipated once activated. When the price reaches these zones, the accumulated orders are executed, which can cause sudden and sharp price movements.
How Liquidity Sweeps Function
The process begins when market participants, especially institutional traders or large-scale speculators, identify these zones. By pushing the market to these levels, they trigger other orders clustered in the zone. The activation of these orders adds to the initial momentum, often causing the price to move even more sharply in the intended direction. This strategy can be utilised to enter a position favourably or to exit one by pushing the price to a level where a reversal is likely.
Liquidity Sweep vs Liquidity Grab
Within the liquidity sweep process, it's crucial to distinguish between a sweep and a grab:
- Liquidity Sweep: This is typically a broader movement where the price action moves through a liquidity zone, activating a large volume of orders and thereby affecting a significant range of prices.
- Liquidity Grab: Often a more targeted and shorter-duration manoeuvre, this involves the price quickly hitting a specific level to trigger orders before reversing direction. This is typically used to 'grab' liquidity by activating stops or pending positions before the price continues to move in the same direction.
In short, a grab may just move slightly beyond a peak or low before reversing, while a sweep can see a sustained movement beyond these points prior to a reversal. There is a subtle difference, but the outcome—a reversal—is usually the same.
Spotting a Liquidity Sweep in the Market
Identifying a sweep involves recognising where liquidity builds up and monitoring how the price interacts with these zones. It typically accumulates at key levels where traders have placed significant numbers of stop-loss orders or pending buy and sell positions.
These areas include:
- Swing Highs and Swing Lows: These are peaks and troughs in the market where traders expect resistance or support, leading to the accumulation of orders.
- Support and Resistance Levels: Historical areas that have repeatedly influenced price movements are watched closely for potential liquidity buildup.
- Fibonacci Levels: Common tools in technical analysis; these levels often see a concentration of orders due to their popularity among traders.
The strategy for spotting a sweep involves observing when the price approaches and breaks through these levels. Traders look for a decisive move that extends beyond the identified zones and watch how the asset behaves as it enters adjacent points of interest, such as order blocks. The key is to monitor for a subsequent reversal or deceleration in price movement, which can signal that the sweep has occurred and the market is absorbing the liquidity.
This approach helps traders discern whether a significant movement is likely a result of a sweep, allowing them to make more informed decisions about entering or exiting positions based on the anticipated reversal or continuation of the price movement.
How to Use Liquidity Sweeps in Trading
Traders often leverage liquidity sweeps in forex as strategic indicators within a broader Smart Money Concept framework, particularly in conjunction with order blocks and fair value gaps. Understanding how these elements interact provides traders with a robust method for anticipating and reacting to potential price movements.
Understanding Order Blocks and Fair Value Gaps
Order blocks are essentially levels or areas where historical buying or selling was significant enough to impact an asset’s direction. These blocks can act as future points of interest where the price might react due to leftover or renewed interest from market participants.
Fair value gaps are areas on a chart that were quickly overlooked in previous movements. These gaps often attract price back to them, as the market seeks to 'fill' these areas by finding the fair value that was previously skipped.
Practical Application in Trading Strategies
Learn how liquidity sweeps can be applied to trading strategies.
Identifying the Trend Direction
The application of liquidity sweeps starts with understanding the current trend, which can be discerned through the market structure—the series of highs and lows that dictate the direction of the market movement.
Locating Liquidity Zones
Within the identified trend, traders pinpoint liquidity zones, which could be significant recent swing highs or lows or areas marked by repeated equal highs/lows or strong support/resistance levels.
Observing Order Blocks and Fair Value Gaps
After identifying a liquidity zone, traders then look for an order block beyond this zone. The presence of a fair value gap near the block enhances the likelihood of the block being reached, as these gaps are frequently filled.
Trade Execution
When the price moves into the order block, effectively sweeping liquidity, traders may place limit orders at the block with a stop loss just beyond it. This action is often based on the expectation that the order block will trigger a reversal.
Utilising Liquidity Sweeps for Entry Confidence
The occurrence of a sweep into an order block not only triggers the potential reversal but also provides traders with greater confidence in their position. This confidence stems from the understanding that the market's momentum needed to reach and react at the block has been supported by the liquidity sweep.
By combining these elements—trend analysis, liquidity zone identification, and strategic use of order blocks and fair-value gaps—traders can create a cohesive strategy that utilises sweeps to enhance decision-making and potentially improve trading results.
The Bottom Line
Understanding liquidity sweeps offers traders a critical lens through which to view market dynamics, revealing deeper insights into potential price movements. For those looking to apply these insights practically, opening an FXOpen account could be a valuable step towards engaging with the markets more effectively and leveraging professional-grade tools to navigate liquidity phenomena.
FAQs
What Is a Liquidity Sweep?
A liquidity sweep occurs when large market participants activate significant orders within liquidity zones, causing rapid price movements. It's a strategic manoeuvre to capitalise on accumulated buy or sell orders at specific price levels.
What Is a Sweep Trade?
A sweep trade is a large order executed through multiple different areas on a chart and venues to optimise execution. This is common in both equities and derivatives trading to minimise market impact.
How to Spot a Liquidity Sweep?
Liquidity sweeps can be identified by sudden, sharp movements towards areas dense with orders, such as previous swing highs or lows or known support and resistance levels, followed often by a rapid reversal.
What Is the Difference Between a Liquidity Sweep and a Liquidity Grab?
A liquidity sweep is a broader market move activating a large volume of orders across a range of prices. In contrast, a grab is a quick, targeted action to hit specific order levels before the price reverses direction.
This article represents the opinion of the Companies operating under the FXOpen brand only. It is not to be construed as an offer, solicitation, or recommendation with respect to products and services provided by the Companies operating under the FXOpen brand, nor is it to be considered financial advice.

ETFs vs Mutual Funds: Differences and Advantages ETFs vs Mutual Funds: Differences and Advantages
Exchange-traded funds (ETFs) and mutual funds are two of the most popular investment options, each offering unique features and advantages. While both provide access to diversified portfolios, their differences in structure, management, and trading make them suitable for different strategies. This article breaks down the key distinctions between exchange-traded funds vs mutual funds and how to choose between them.
What Are ETFs?
Exchange-traded funds, or ETFs, are investment vehicles that allow traders to access a diverse range of assets through a single product. An ETF is essentially a basket of investments—such as stocks, bonds, or commodities—that typically tracks the performance of an index, sector, or specific theme. For example, SPDR S&P 500 ETF Trust (SPY) follows the S&P 500 index, providing exposure to the largest companies listed on US stock exchanges.
What sets ETFs apart is how they’re traded. Unlike mutual funds, which are only bought or sold at the end of the trading day, ETFs trade on stock exchanges throughout the day, just like individual shares. This means their prices fluctuate as demand and supply change, giving traders the flexibility to enter or exit positions at market prices.
ETFs are known for their cost-effectiveness, as most are passively managed to mirror the performance of an index rather than exceed it. This passive structure usually leads to lower management fees compared to actively managed funds. Additionally, ETFs are often transparent, with their holdings disclosed daily, so investors know exactly what they’re buying.
ETFs come in various types, from those focused on specific sectors, like technology or healthcare, to broader options covering entire economies or bond markets. This variety makes them a popular choice for traders and investors looking to diversify or target specific market opportunities.
What Are Mutual Funds?
Mutual funds are investment products that pool money from multiple investors to create a diversified portfolio, typically managed by a professional fund manager. These funds invest in a wide range of assets, including stocks, bonds, and other securities, depending on the fund’s objective. For instance, an equity mutual fund focuses on stocks, while a bond fund invests primarily in fixed-income securities.
One defining feature of mutual funds is their pricing. Unlike ETFs, mutual funds aren’t traded on stock exchanges. Instead, they are bought and sold at the fund’s net asset value (NAV), which is calculated at the end of each trading day. This makes them more suited to long-term investment strategies.
Mutual funds often appeal to investors looking for a hands-off approach. The fund manager handles the selection and management of assets, aiming to achieve the fund’s stated goals—whether that’s generating income, preserving capital, or achieving long-term growth.
However, this active management comes with higher fees compared to ETFs. These costs include management fees and sometimes additional charges like entry or exit loads, which can eat into returns over time.
Mutual funds also often require a minimum investment, making them less accessible for some investors. That said, they offer a wide variety of options, from sector-specific funds to diversified portfolios, providing flexibility for different investment goals and risk preferences.
Are There Differences Between an ETF and a Mutual Fund?
ETFs and mutual funds share similarities—they both allow investors to pool money into diversified portfolios. However, the differences between ETFs and mutual funds can significantly impact which one is better suited to an investor’s goals.
Trading and Pricing
ETFs are traded on stock exchanges continuously during market hours, similar to individual shares. Price fluctuations are based on market demand and supply. In contrast, mutual funds are priced only once per day after the market closes, based on the fund’s net asset value (NAV). This makes ETFs more appealing for those seeking flexibility and the ability to react to market movements, while mutual funds cater to long-term investors less concerned with intraday price changes.
Management Style
ETFs are mostly passively managed, designed to track the performance of a specific index, sector, or asset class. Mutual funds, on the other hand, often feature active management. This involves fund managers selecting assets to outperform the market, which can offer potential opportunities for higher returns but also comes with increased costs.
Fees and Costs
ETFs typically come with a lower expense ratio compared to mutual funds, making them more cost-efficient. This is due to their passive management approach and lower operational costs. Mutual funds may charge higher fees to cover active management and administrative expenses. Additionally, mutual funds may have extra costs like sales charges or redemption fees, whereas ETFs incur standard brokerage commissions.
Liquidity
When considering mutual funds versus ETFs, liquidity becomes a critical factor, as ETF prices change intraday, while mutual funds are limited to end-of-day pricing. This difference can influence how quickly you can access your funds.
Tax Efficiency
ETFs tend to be more tax-efficient because of their structure. When investors sell ETF shares, transactions occur directly between buyers and sellers on the exchange, limiting taxable events. In mutual funds, redemptions often require the fund manager to sell securities, which can result in capital gains distributed to all investors in the fund.
Minimum Investment
Mutual funds often require a minimum initial investment, which can range from a few hundred to thousands of dollars. ETFs, however, don’t have such requirements—traders can purchase as little as a single share, making them more accessible for those with smaller starting capital.
ETF CFD Trading
ETF CFD trading offers a flexible way for traders to speculate on the price movements of exchange-traded funds without the need to buy them on stock exchanges. CFDs, or Contracts for Difference, are derivative products that track the price of an ETF, allowing traders to take positions on whether the price will rise or fall. This approach is particularly appealing for short-term speculation, making it a useful complement to traditional long-term ETF or mutual fund investing.
Flexibility
One of the standout features of ETF CFDs is their flexibility. Unlike investing directly in ETFs, CFD trading enables you to capitalise on price fluctuations without owning ETF shares. Traders can go long if they anticipate a rise in the ETF’s value or short if they expect a decline. This ability to trade in both directions can potentially create opportunities in both bullish and bearish markets. Moreover, CFDs allow for trading over shorter timeframes like 1-minute or 5-minute charts, providing potential opportunities for scalpers and day traders.
Leverage
Leverage is another significant feature of ETF CFDs. With leverage, traders can gain larger exposure to an ETF’s price movements with smaller initial capital. For example, using 5:1 leverage, a $1,000 position would control $5,000 worth of ETF exposure. However, you should remember that while this magnifies potential returns, losses are also amplified, making risk management a critical component of trading CFD products.
Costs
Actively managed ETFs can charge expense ratios to cover management and operational costs. CFDs eliminate these fees, as traders don’t directly invest in the ETF’s assets. However, both ETF investing and ETF CFD trading include brokerage fees or spreads.
Wider Range of Markets
With CFDs, traders can access a variety of global ETF markets through a single platform. This reduces the need to open accounts in different jurisdictions, saving on administrative and currency conversion costs.
CFD trading is popular among traders who want to take advantage of short-term price movements, diversify their strategies, or access ETF markets straightforwardly. While traditional ETFs are often favoured for long-term growth, ETF CFDs provide an active, fast-paced alternative for traders looking to react quickly to market changes.
Use Cases for ETFs and Mutual Funds
In comparing ETFs vs mutual funds, it’s important to recognise their use cases based on an investor’s goals, strategies, and time horizons.
ETFs
ETFs are used by investors seeking flexibility and real-time market engagement. They are attractive for those who want to take advantage of price movements or actively manage their portfolios. For example, an investor might focus on sector-specific ETFs, like technology or energy, to capitalise on industry trends. ETFs also offer a lower-cost option for diversification, making them useful for those building broad exposure across markets without significant capital.
Additionally, ETFs may be effective for hedging. An investor with exposure to a specific market segment can use an ETF to potentially offset risks, especially in volatile markets. For instance, during an anticipated downturn in equities, an inverse ETF could be used to possibly mitigate losses.
Mutual Funds
Mutual funds are popular among long-term investors prioritising professional management. Their hands-off approach makes them appealing to individuals who prefer not to monitor markets daily. For instance, someone saving for retirement might opt for a diversified mutual fund that balances risk and growth over time.
Mutual funds are also advantageous for accessing specialised strategies, such as actively managed funds focusing on niche markets or themes. While they typically involve higher fees, the tailored management can align with specific financial objectives.
Factors for Choosing Between ETFs and Mutual Funds
Selecting between mutual funds vs ETF options depends on an investor’s financial goals, trading style, and the level of involvement they are comfortable with in managing their investments.
- Time Horizon: ETFs are popular among short- to medium-term investors and traders who prefer flexibility and the ability to follow intraday price movement. Mutual funds, on the other hand, are mostly used by long-term investors focused on gradual growth or income over time.
- Cost Sensitivity: ETFs generally have lower expense ratios and no minimum investment requirements, making them cost-efficient. Mutual funds often involve higher management fees and, in some cases, additional charges like entry or exit fees, which can add up over time.
- Active vs Passive Management: If you’re looking for a hands-off approach with professional oversight, actively managed mutual funds might be more appealing. However, if you prefer to track indices or specific sectors at a lower cost, ETFs might be more suitable.
- Liquidity Needs: Investors who need quick access to their capital often prefer ETFs because they can be traded throughout the day. Mutual funds lack this intraday liquidity, as transactions are only processed at the trading day’s end.
The Bottom Line
Understanding the differences between mutual funds vs exchange-traded funds is crucial for selecting the right investment approach. ETFs offer flexibility and cost-efficiency, while mutual funds are popular among long-term investors seeking professional management. For those interested in ETF CFD trading, which allows traders trade in rising and falling markets, opening an FXOpen account provides access to a diverse range of ETF markets alongside competitive trading conditions.
FAQ
What Is an ETF vs Mutual Fund?
An ETF is a fund traded on stock exchanges, offering intraday liquidity and lower fees, typically tracking an index or sector. A mutual fund pools investor money for professional management, priced once at the end of a trading day at its net asset value per share.
Mutual Funds and ETFs: Differences
ETFs trade like stocks, are generally more cost-efficient, and offer intraday liquidity. Mutual funds are actively managed, have higher fees, and are designed for long-term investing with end-of-day pricing.
Is the S&P 500 an ETF or a Mutual Fund?
The S&P 500 itself is an index, not a fund. However, it can be tracked by both ETFs (like SPDR S&P 500 ETF) and mutual funds, offering similar exposure but with differing management styles and fee structures.
This article represents the opinion of the Companies operating under the FXOpen brand only. It is not to be construed as an offer, solicitation, or recommendation with respect to products and services provided by the Companies operating under the FXOpen brand, nor is it to be considered financial advice.

Behind the Curtain The Economic Pulse Behind Euro FX1. Introduction
Euro FX Futures (6E), traded on the CME, offer traders exposure to the euro-dollar exchange rate with precision, liquidity, and leverage. Whether hedging European currency risk or speculating on macro shifts, Euro FX contracts remain a vital component of global currency markets.
But what truly moves the euro? Beyond central bank meetings and headlines, the euro reacts sharply to macroeconomic data that signals growth, inflation, or risk appetite. Using a Random Forest Regressor, we explored how economic indicators correlate with Euro FX Futures returns across different timeframes.
In this article, we uncover which metrics drive the euro daily, weekly, and monthly, offering traders a structured, data-backed approach to navigating the Euro FX landscape.
2. Understanding Euro FX Futures Contracts
The CME offers two primary Euro FX Futures products:
o Standard Euro FX Futures (6E):
Contract Size: 125,000 €
Tick Size: 0.000050 per euro = $6.25 per tick per contract
Trading Hours: Nearly 24 hours, Sunday to Friday (US)
o Micro Euro FX Futures (M6E):
Contract Size: 12,500 € (1/10th the size of 6E)
Tick Size: 0.0001 per euro = $1.25 per tick per contract
Accessible to: Smaller accounts, strategy testers, and traders managing precise exposure
o Margins:
6E Initial Margin: ≈ $2,600 per contract (subject to volatility)
M6E Initial Margin: ≈ $260 per contract
Whether trading full-size or micro contracts, Euro FX Futures offer capital-efficient access to one of the most liquid currency pairs globally. Traders benefit from leverage, scalability, and transparent pricing, with the ability to hedge or speculate on Euro FX trends across timeframes.
3. Daily Timeframe: Key Economic Indicators
For day traders, short-term price action in the euro often hinges on rapidly released data that affects market sentiment and intraday flow. According to machine learning results, the top 3 daily drivers are:
Housing Starts: Surging housing starts in the U.S. can signal economic strength and pressure the euro via stronger USD flows. Conversely, weaker construction activity may weaken the dollar and support the euro.
Consumer Sentiment Index: A sentiment-driven metric that reflects household confidence. Optimistic consumers suggest robust consumption and a firm dollar, while pessimism may favor EUR strength on defensive rotation.
Housing Price Index (HPI): Rising home prices can stoke inflation fears and central bank hawkishness, affecting yield differentials between the euro and the dollar. HPI moves often spark short-term FX volatility.
4. Weekly Timeframe: Key Economic Indicators
Swing traders looking for trends spanning several sessions often lean on energy prices and labor data. Weekly insights from our Random Forest model show these three indicators as top drivers:
WTI Crude Oil Prices: Oil prices affect global inflation and trade dynamics. Rising WTI can fuel EUR strength if it leads to USD weakness via inflation concerns or reduced real yields.
Continuing Jobless Claims: An uptick in claims may suggest softening labor conditions in the U.S., potentially bullish for EUR as it implies slower Fed tightening or economic strain.
Brent Crude Oil Prices: As the global benchmark, Brent’s influence on inflation and trade flows is significant. Sustained Brent rallies could create euro tailwinds through weakening dollar momentum.
5. Monthly Timeframe: Key Economic Indicators
Position traders and institutional participants often focus on macroeconomic indicators with structural weight—those that influence monetary policy direction, capital flow, and long-term sentiment. The following three monthly indicators emerged as dominant forces shaping Euro FX Futures:
Industrial Production: A cornerstone of economic output, rising industrial production reflects strong manufacturing activity. Strong U.S. numbers can support the dollar, while a slowdown may benefit the euro. Likewise, weaker European output could undermine EUR demand.
Velocity of Money (M2): This metric reveals how quickly money is circulating in the economy. A rising M2 velocity suggests increased spending and inflationary pressures—potentially positive for the dollar and negative for the euro. Falling velocity signals stagnation and may shift flows into the euro as a lower-yield alternative.
Initial Jobless Claims: While often viewed weekly, the monthly average could reveal structural labor market resilience. A rising trend may weaken the dollar, reinforcing EUR gains as expectations for interest rate cuts grow.
6. Strategy Alignment by Trading Style
Each indicator offers unique insights depending on your approach to market participation:
Day Traders: Focus on the immediacy of daily indicators like Housing Starts, Consumer Sentiment, and Housing Price Index.
Swing Traders: Leverage weekly indicators like Crude Oil Prices and Continuing Claims to ride mid-term moves.
Position Traders: Watch longer-term data such as Industrial Production and M2 Velocity.
7. Risk Management
Currency futures provide access to high leverage and broad macro exposure. With that comes responsibility. Traders must actively manage position sizing, volatility exposure, and stop placement.
Economic indicators inform price movement probabilities—not certainties—making risk protocols just as essential as trade entries.
8. Conclusion
Euro FX Futures are shaped by a deep web of macroeconomic forces. From Consumer Sentiment and Oil Prices to Industrial Production and Money Velocity, each indicator tells part of the story behind Euro FX movement.
Thanks to machine learning, we’ve spotlighted the most impactful data across timeframes, offering traders a framework to align their approach with the heartbeat of the market.
As we continue the "Behind the Curtain" series, stay tuned for future editions uncovering the hidden economic forces behind other major futures markets.
When charting futures, the data provided could be delayed. Traders working with the ticker symbols discussed in this idea may prefer to use CME Group real-time data plan on TradingView: www.tradingview.com - This consideration is particularly important for shorter-term traders, whereas it may be less critical for those focused on longer-term trading strategies.
General Disclaimer:
The trade ideas presented herein are solely for illustrative purposes forming a part of a case study intended to demonstrate key principles in risk management within the context of the specific market scenarios discussed. These ideas are not to be interpreted as investment recommendations or financial advice. They do not endorse or promote any specific trading strategies, financial products, or services. The information provided is based on data believed to be reliable; however, its accuracy or completeness cannot be guaranteed. Trading in financial markets involves risks, including the potential loss of principal. Each individual should conduct their own research and consult with professional financial advisors before making any investment decisions. The author or publisher of this content bears no responsibility for any actions taken based on the information provided or for any resultant financial or other losses.

Revenge Trading vs. Roaring Comeback: How to Tell the Difference“I’m going to get even with the market and I’m going to get even today!” We’ve all been there. You take a loss—maybe a small one, maybe an account-crushing one—and something inside you snaps.
Logic leaves the chat, and a new trader takes over: the vengeful, angry version of you who’s out to "get back" at the market.
Welcome to the world of revenge trading, where decisions are fueled by frustration, and the market does what it always does: punishes impatient and emotional traders.
But what if there’s a better way? What if instead of spiraling into self-destruction, you could channel that energy into a thoughtful and strategic comeback? That’s the difference between revenge trading and a true trader’s rebound. Grab your hot coffee and let’s talk about it.
💥 Revenge Trading: The Fastest Way to Financial Self-Sabotage
Revenge trading isn’t a trading strategy—it’s an emotional response masquerading as a quick-witted reaction. The thought process goes like this: "I just lost money. I need to make it back—fast."
So you double down, size up, stretch out the leverage ratio and ignore your usual risk management rules. Maybe you trade assets you don’t even understand because the price looks juicy. Maybe you jump into a leveraged position without a stop loss because, hey, you’re in it to win it. What could go wrong?
Everything. Everything can go wrong.
Revenge trading is the financial equivalent of trying to punch the ocean. The market doesn’t care that you’re mad. It doesn’t owe you a winning trade. And when you start making impulsive decisions, the only thing that may get hurt is your trading mindset.
📢 Signs You’re Revenge Trading
You’re taking trades you wouldn’t normally take.
You’re increasing position sizes irrationally.
You’re ditching risk management (stop losses, position sizing, logic, etc.).
You feel desperate to "make it back"—right now.
You’re ignoring your trading plan, assuming you had one to begin with.
Recognizing these signs is the first step to stopping the cycle. But avoiding revenge trading is only half of the battle—you need to know how to stage a real comeback.
🦁 Staging the Roaring Comeback
A roaring comeback isn’t about making back your losses in one dramatic trade. It’s about recalibrating, reassessing, and regaining control. Here’s how traders who actually recover from losses do it:
📌 Recognize the Signs Early
If your heart rate spikes and your fingers are itching to “fix” a bad trade immediately, stop. That’s not a setup. That’s an emotional reaction.
📌 Set Daily Loss Limits
If you hit your max loss for the day, you’re done. No exceptions. Your best decision at that point is to fight another day with a clear head.
📌 Step Away from the Screens
Revenge trading thrives on impulsivity, and the best way to kill that impulse is to take a break. Go outside. Breathe. The market isn’t going anywhere. Now touch that grass.
📌 Post-Loss Review: What Actually Happened?
Was the loss due to a bad strategy, poor execution, or just market randomness? Pull up your trading journal ( you do keep one, right ?) and break it down.
📌 Reaffirm Your Strategy (Tweak if Necessary)
If your loss came from a solid trade setup that just didn’t work, then there’s nothing to change. If it came from a mistake, figure out how to prevent that mistake from repeating.
📌 Reduce Risk for the Next Trades
After a loss, the worst thing you can do is over-leverage. Instead, cut your position size and take smaller, high-probability trades to rebuild confidence. Howard Marks, a firm believer in market psychology, always reminds investors that the biggest risk is emotional overreaction. Stay disciplined.
📌 Trust the Process
The best traders understand that one trade does not define them. They trust their system, stick to their edge, and take losses as part of the game. Trading is a long-term play, not a single battle to be won or lost.
💚 Turning Losses into Lessons
Losses are tuition fees for the market’s greatest lessons. Every great trader has taken hits—what separates them from the rest is how they respond. The thing is this can happen anywhere—from an ill-fated trade in the crypto market (it’s wild out there) to an account-battering reaction to anything that pops out of the earnings calendar .
How do you deal with a trading loss? And when’s the last time you had to stiffen that upper lip and make your comeback? Share your experience in the comments!

Crypto: From "HODL Paradise" to a Speculator’s PlaygroundDuring past bull markets, a simple HODL strategy worked wonders.
Bitcoin and Ethereum set the market trend, and altcoins followed with explosive gains. If you bought the right project before the hype wave, the profits were massive.
However, today’s market is vastly different:
✅ Liquidity is unevenly distributed – Only a handful of major projects attract serious capital, while many altcoins stagnate.
✅ Investors are more sophisticated – Institutional players and smart money dominate, making retail-driven pumps less frequent.
✅ Not all coins pump together – Only projects with real utility and solid tokenomics see sustainable growth.
________________________________________
2. What Matters Now? Strategies for the New Crypto Era
To succeed in the current market, you need a more calculated approach. Here’s what you should focus on:
🔹 Technical Analysis
You can’t just buy blindly and hope for a moonshot. Understanding support and resistance levels, price patterns, trading volumes, etc. is crucial.
Example: If an altcoin has surged 50% in a few days and reaches a strong resistance level, it’s not a buying opportunity—it’s a sell signal for short-term traders.
🔹 Tokenomics and Supply Mechanics
In 2017 and 2021, as long as a project had a compelling whitepaper, it could attract investors. Now, you need to analyze total token supply, distribution models, utility, and vesting schedules.
Example: If a project has an aggressive vesting schedule where early investors and the team receive new tokens monthly, there will be constant selling pressure. No matter how good the technology is, you don’t want to be caught in a dumping cycle.
🔹 Market Psychology and Speculative Cycles
Crypto is driven by emotions. You need to recognize when the crowd is euphoric (time to sell) and when fear dominates (time to buy).
Example: If a project is all over Twitter, Telegram, and TikTok, it might already be near the top. On the other hand, when a solid project is ignored and trading volume is low, it could be a prime accumulation opportunity.
________________________________________
3. Realistic Expectations: 30-50-100% Are the New "100x"
If catching a 10x or 100x was common in the past, those days are largely over. Instead, 30-50-100% gains are far more realistic and sustainable.
Why?
• The market is more mature, and liquidity doesn’t flood into random projects.
• Most "100x" gains were pump & dump schemes, which are now avoided by smart investors.
• Experienced traders take profits earlier, limiting parabolic price action.
Recommended strategy:
1. Enter early in a solid project with clear utility and strong tokenomics.
2. Set realistic profit targets (e.g., take 30% profit at +50%, another 30% at +100%, and hold the rest long-term).
3. Don’t wait for a “super cycle” to make money—take profits consistently.
________________________________________
4. Conclusion: Adapt or Get Left Behind
The crypto market has evolved from a “HODL Paradise” where almost any coin could 10-100x into a speculator’s playground, favoring skilled traders and informed investors.
To stay profitable, you must:
✅ Master technical analysis and identify accumulation vs. distribution zones.
✅ Pick projects with solid tokenomics and avoid those with aggressive unlock schedules.
✅ Set realistic expectations—forget about 100x and aim for sustainable 30-100% gains.
✅ Stay flexible and adapt to market psychology and emerging trends.
Crypto is no longer a game of luck. It’s a game of knowledge and strategy. If you don’t adapt, you’ll be stuck waiting for a 100x that may never come.
So, at least this is my opinion. But what about you? Do you think crypto is still a "HODL paradise," or are we fully in the era of skilled traders and speculators?
Will we ever see another cycle where almost everything pumps together, or is selective investing the new reality?
I’d love to hear your thoughts—drop a comment below and let’s discuss

Institute of Intermediation and 24 Coffee LoversWhen the market is efficient, the most efficient strategy will yield zero financial return for the investor. Therefore, firstly, it is necessary to strive to find inefficiencies in the market itself to apply a strategy that will be effective for it.
What creates market inefficiency? First, there are delays in disseminating important information about the company, such as the approval of a contract with a major customer or an accident at a plant. If current and potential investors do not receive this information immediately, the market becomes inefficient at the time such an event occurs. In other words, objective reality is not considered by market participants. This makes the stock price obsolete.
Secondly, the market becomes inefficient during periods of high volatility. I would describe it this way: when uncertainty hits everyone, emotions become the main force influencing prices. At such times, the market value of a company can change significantly within a single day. Investors have too many different assessments of what is happening to find the necessary balance. Volatility can be triggered by the bankruptcy of a systemically important company (for example, as happened with Lehman Brothers), the outbreak of military action, or a natural disaster.
Third, there is the massive action of large players in a limited market - a "bull in a china shop" situation. A great example is the story of 2021, when the Reddit community drove up the price of GameStop shares, forcing hedge funds to cover their short positions at sky-high prices.
Fourthly, these are ineffective strategies of the market participants themselves. On August 1, 2012, American stock market trading company Knight Capital caused abnormal volatility in more than 100 stocks by sending millions of orders to the exchange over a 45-minute period. For example, Wizzard Software Corporation shares rose from $3.50 to $14.76. This behavior was caused by a bug in the code that Knight Capital used for algorithmic trading.
The combination of these and other factors creates inefficiencies that are exploited by trained traders or investors to make a profit. However, there are market participants who receive their income in any market. They are above the fray and are engaged in supporting and developing the infrastructure itself.
In mathematics, there is a concept called a “zero-sum game”. This is any game where the sum of the possible gains is equal to the sum of the losses. For example, the derivatives market is a perfect embodiment of a zero-sum game. If someone makes a profit on a futures contract, he always has a partner with a similar loss. However, if you dive deeper, you will realize that this is a negative-sum game, since in addition to profit and loss, there are commissions that you pay to the infrastructure: brokers, exchanges, regulators, etc.
To understand the value of these market participants and that you are paying them well, imagine a modern world without them. There is only a company issuing shares and investors in them.
Such a company has its own software, and you connect to it via the Internet to buy or sell shares. The company offers you a quote for buying and selling shares ( bid-ask spread ). The asking price ( ask ) will be influenced by the company's desire to offer a price that will help it not lose control over the company, consider all expected income, dividends, etc. The purchase price ( bid ) will be influenced by the company's desire to preserve the cash received in the capital market, as well as to earn money on its own shares by offering a lower price. In general, in such a situation, you will most likely get a huge difference between the purchase and sale prices - a wide bid-ask spread .
Of course, the company understands that the wider the bid-ask spread , the less interest investors have in participating in such trading. Therefore, it would be advisable to allow investors to participate in the formation of quotes. In other words, a company can open its order book to anyone who wants to participate. Under such conditions, the bid-ask spread will be narrowed by bids from a wide range of investors.
As a result, we will get a situation where each company will have its own order book and its own software to connect to it. From a portfolio investor's perspective, this would be a real nightmare. In such a world, investing in not one, but several companies would require managing multiple applications and accounts for each company at the same time. This will create a demand from investors for one app and one account to manage investments in multiple companies. Such a request will also be supported by the company issuing the shares, as it will allow it to attract investors from other companies. This is where the broker comes in.
Now everything is much better and more convenient. Investors get the opportunity to invest in multiple companies through one account and one application, and companies get investors from each other. However, the stock market will still be segmented, as not all brokers will support cooperation with individual companies, for technical or other reasons. The market will be fragmented among many brokerage companies.
The logical solution would be to create another market participant that would have contracts with each of the companies and universal software for trading their shares. The only thing is that it will be brokers, not investors, who will connect to such a system. You may have already guessed that this is an exchange.
On the one hand, the exchange registers shares of companies, on the other hand, it provides access to trading them through brokers who are its members. Of course, the modern structure of the stock market is more complex: it involves clearing, depository companies, registrars of rights to shares, etc.* The formation of such institutions and their licensing is handled by a regulator, for example, the Securities and Exchange Commission in the United States ( SEC ). As a rule, the regulator is responsible for legislative initiatives in the field of the securities market, licensing of market participants, monitoring violations in the market and supporting its efficiency, protecting investors from unfair manipulation.
*Clearing services are activities to determine, control and fulfill obligations under transactions of financial market participants. Depository services - services for the storage of securities and the recording of rights to them.
Thus, by making a transaction on the exchange, we contribute to the maintenance of this necessary infrastructure. Despite the fashion for decentralization, it is still difficult to imagine how one can ensure speed, convenience and access to a wide range of assets due to the absence of an intermediary institution. The other side of the coin of this institution is infrastructure risk. You can show phenomenal results in the market, but if your broker goes bankrupt, all your efforts will be nullified.
Therefore, before choosing an intermediary, it is useful to conduct a mental survey of the person you will be dealing with. Below you will find different types of intermediaries, which I have arranged according to their distance from the central elements of the infrastructure (exchanges, clearing houses, depositories).
Prime broker
Exchange Membership: mandatory
License: mandatory
Acceptance and accounting of your funds/shares: mandatory
Order execution: mandatory
Clearing and depository services: mandatory
Marginal services: mandatory
Remuneration: commission income from trades, clearing, depository and margin services
This category includes well-known financial houses with history and high capitalization. They are easily verified through lists of exchange members, clearing and depository companies. They provide services not only to individuals, but also to banks, funds and next-level brokers.
Broker
Exchange membership: mandatory
License: mandatory
Acceptance and accounting of your funds/shares: mandatory
Order execution: mandatory
Clearing and depository services: on the prime broker side
Margin services: on the prime broker side or own
Remuneration: commission income from trades and margin services
This category includes intermediaries with a focus on order routing. They delegate participation in depository and clearing services to a prime broker. However, such brokers can also be easily verified in the lists of exchange members.
Sub-broker
Exchange Membership: no
License: mandatory
Acceptance and accounting of your funds/shares: mandatory
Order execution: on the broker or prime broker side
Clearing and depository services: on the prime broker side
Margin services: on the broker or prime broker side
Remuneration: commission income from trades
This category includes brokers who have a brokerage license in their country, but do not have membership in foreign exchanges. To provide trading services on these exchanges, they enter into agreements with brokers or prime brokers from another country. They can be easily verified by license on the website of the regulator of the country of registration.
Introducing Broker
Exchange Membership: no
License: optional, depending on the country of regulation
Acceptance and accounting of your funds / shares: no
Order execution: on the side of the sub-broker, broker or prime broker
Clearing and depository services: on the prime broker side
Margin services: on the broker or prime broker side
Remuneration: commission income for the attracted client and/or a share of the commissions paid by them
This category includes companies that are not members of the exchange. Their activities may not require a license, since they do not accept funds from clients, but only assist in opening an account with one of the top-tier brokers. This is a less transparent level, since such an intermediary cannot be verified through the exchange and regulator’s website (unless licensing is required). Therefore, if an intermediary of this level asks you to transfer some money to his account, most likely you are dealing with a fraudster.
All four categories of participants are typical for the stock market. Its advantage over the over-the-counter market is that you can always check the financial instrument on the exchange website, as well as those who provide services for its trading (membership - on the exchange website, license - on the regulator's website).
Pay attention to the country of origin of the broker's license. You will receive maximum protection in the country where you have citizenship. In case of any claims against the broker, communication with the regulator of another country may be difficult.
As for the over-the-counter market, this segment typically trades shares of small-cap companies (not listed on the exchange), complex derivatives and contracts for difference ( CFD ). This is a market where dealers rule, not brokers and exchanges. Unlike a broker, they sell you their open position, often with a lot of leverage. Therefore, trading with a dealer is a priori a more significant risk.
In conclusion, it should be noted that the institution of intermediation plays a key role in the development of the stock market. It arose as a natural need of its participants for concentration of supply and demand, greater speed and security of financial transactions. To get a feel for this, let me tell you a story.
New Amsterdam, 1640s
A warm wind from the Hudson brought the smell of salt and freshly cut wood. The damp logs of the palisade, dug into the ground along the northern boundary of the settlement, smelled of resin and new hopes. Here, on the edge of civilization, where Dutch colonists were reclaiming their homes and future fortunes from the wild forest, everything was built quickly, but with a view to lasting for centuries.
The wooden wall built around the northern border of the town was not only a defense against raids, but also a symbol. A symbol of the border between order and chaos, between the ambitions of European settlers and the freedom of these lands. Over the years, the fortification evolved into a real fortification: by 1653, Peter Stuyvesant, appointed governor of New Netherland by the West India Company, ordered the wall to be reinforced with a palisade. It was now twelve feet high, and armed sentries stood on guard towers.
But even the strongest walls do not last forever. Half a century after their construction, in 1685, a road was built along the powerful palisade. The street received a simple and logical name - Wall Street. It soon became a bustling commercial artery for the growing city. In 1699, when the English authorities had already established themselves here finally, the wall was dismantled. She disappeared, but Wall Street remained.
A century has passed
Now, at the end of the 18th century, there were no walls or guard towers on this street. Instead, a plane tree grew here - a large, spreading one, the only witness to the times when the Dutch still owned this city. Traders, dealers, and sea captains met under its shadow. Opposite the buttonwood tree stood the Tontine Coffee House, a place where not just respectable people gathered, but those who understood that money makes this world go round.
They exchanged securities right on the pavement, negotiated over a cup of steaming coffee, and discussed deals that could change someone's fate. Decisions were made quickly - a word, backed up by a handshake, was enough. It was a time when honor was worth more than gold.
But the world was changing. The volume of trades grew, and chaos demanded rules.
May 17, 1792
That spring day turned out to be decisive. Under the branches of an old buttonwood tree, 24 New York brokers gathered to start a new order. The paper they signed contained only two points: trades are made only between their own, without auctioneers, and the commission is fixed at 0.25%.
The document was short but historic. It was called the Buttonwood Agreement, after the tree under which it was signed.
Here, amid the smell of fresh coffee and ink, the New York Stock Exchange was born.
Soon, deals were being concluded under the new rules. The first papers to be traded were those of The Bank of New York , whose headquarters were just a few steps away at 1 Wall Street. Thus, under the shade of an old tree, the history of Wall Street began. A story that will one day change the whole world.
Buttonwood Agreement. A fresco by an unknown artist who adorns the walls of the New York Stock Exchange.
Behind the Curtain: Unveiling Gold’s Economic Catalysts1. Introduction
Gold Futures (GC, MGC and 1OZ), traded on the CME market, are one of the most widely used financial instruments for hedging against inflation, currency fluctuations, and macroeconomic uncertainty. As a safe-haven asset, gold reacts to a wide range of economic indicators, making it crucial for traders to understand the underlying forces driving price movements.
By leveraging machine learning, specifically a Random Forest Regressor, we analyze the top economic indicators influencing Gold Futures on daily, weekly, and monthly timeframes. This data-driven approach reveals the key catalysts shaping GC Futures and provides traders with actionable insights to refine their strategies.
2. Understanding Gold Futures Contracts
Gold Futures (GC) are among the most actively traded futures contracts, offering traders and investors exposure to gold price movements with a range of contract sizes to suit different trading strategies. CME Group provides three types of Gold Futures contracts to accommodate traders of all levels:
o Standard Gold Futures (GC):
Contract Size: Represents 100 troy ounces of gold.
Tick Size: Each tick is 0.10 per ounce, equating to $10 per tick per contract.
Purpose: Ideal for institutional traders and large-scale hedgers.
Margin: Approximately $12,500 per contract.
o Micro Gold Futures (MGC):
Contract Size: Represents 10 troy ounces of gold, 1/10th the size of the standard GC contract.
Tick Size: Each tick is $1 per contract.
Purpose: Allows smaller-scale traders to participate in gold markets with lower capital requirements.
Margin: Approximately $1,250 per contract.
o 1-Ounce Gold Futures (1OZ):
Contract Size: Represents 1 troy ounce of gold.
Tick Size: Each tick is 0.25 per ounce, equating to $0.25 per tick per contract.
Purpose: Provides precision trading for retail participants who want exposure to gold at a smaller contract size.
Margin: Approximately $125 per contract.
Keep in mind that margin requirements vary through time as market volatility changes.
3. Daily Timeframe: Key Economic Indicators
Gold Futures respond quickly to short-term economic fluctuations, and three key indicators play a crucial role in daily price movements:
o Velocity of Money (M2):
Measures how quickly money circulates within the economy.
A higher velocity suggests increased spending and inflationary pressure, often boosting gold prices.
A lower velocity indicates stagnation, which may reduce inflation concerns and weigh on gold.
o Unemployment Rate:
Reflects the strength of the labor market.
Rising unemployment increases economic uncertainty, often driving demand for gold as a safe-haven asset.
Declining unemployment can strengthen risk assets, potentially reducing gold’s appeal.
o Oil Import Price Index:
Represents the cost of imported crude oil, influencing inflation trends.
Higher oil prices contribute to inflationary pressures, supporting gold as a hedge.
Lower oil prices may ease inflation concerns, weakening gold demand.
4. Weekly Timeframe: Key Economic Indicators
While daily fluctuations impact short-term traders, weekly economic data provides a broader perspective on gold price movements. The top weekly indicators include:
o Nonfarm Payrolls (NFP):
Measures the number of new jobs added in the U.S. economy each month.
Strong NFP numbers typically strengthen the U.S. dollar and increase interest rate hike expectations, pressuring gold prices.
Weak NFP figures can drive economic uncertainty, increasing gold’s safe-haven appeal.
o Nonfarm Productivity:
Represents labor efficiency and economic output per hour worked.
Rising productivity suggests economic growth, potentially reducing demand for gold.
Falling productivity can signal economic weakness, increasing gold’s appeal.
o Personal Spending:
Tracks consumer spending habits, influencing economic activity and inflation expectations.
Higher spending can lead to inflation, often pushing gold prices higher.
Lower spending suggests economic slowing, which may either weaken or support gold depending on inflationary outlooks.
5. Monthly Timeframe: Key Economic Indicators
Long-term trends in Gold Futures are shaped by macroeconomic forces that impact investor sentiment, inflation expectations, and interest rates. The most influential monthly indicators include:
o China GDP Growth Rate:
China is one of the largest consumers of gold, both for investment and jewelry.
Strong GDP growth signals robust demand for gold, pushing prices higher.
Slower growth may weaken gold demand, applying downward pressure on prices.
o Corporate Bond Spread (BAA - 10Y):
Measures the risk premium between corporate bonds and U.S. Treasury bonds.
A widening spread signals economic uncertainty, increasing demand for gold as a safe-haven asset.
A narrowing spread suggests confidence in risk assets, potentially reducing gold’s appeal.
o 10-Year Treasury Yield:
Gold has an inverse relationship with bond yields since it does not generate interest.
Rising yields increase the opportunity cost of holding gold, often leading to price declines.
Falling yields make gold more attractive, leading to price appreciation.
6. Risk Management Strategies
Given gold’s volatility and sensitivity to macroeconomic changes, risk management is essential for trading GC Futures. Key risk strategies may include:
Monitoring Global Liquidity Conditions:
Keep an eye on M2 Money Supply and inflation trends to anticipate major shifts in gold pricing.
Interest Rate Sensitivity:
Since gold competes with yield-bearing assets, traders should closely track interest rate movements.
Higher 10-Year Treasury Yields can weaken gold’s value as a non-yielding asset.
Diversification and Hedging:
Traders can hedge gold positions using interest rate-sensitive assets such as bonds or inflation-linked securities.
Gold often performs well in times of equity market distress, making it a commonly used portfolio diversifier.
7. Conclusion
Gold Futures remain one of the most influential instruments in the global financial markets.
By leveraging machine learning insights and macroeconomic data, traders can better position themselves for profitable trading opportunities. Whether trading daily, weekly, or monthly trends, understanding these indicators allows market participants to align their strategies with broader economic conditions.
Stay tuned for the next "Behind the Curtain" installment, where we explore economic forces shaping another key futures market.
When charting futures, the data provided could be delayed. Traders working with the ticker symbols discussed in this idea may prefer to use CME Group real-time data plan on TradingView: www.tradingview.com - This consideration is particularly important for shorter-term traders, whereas it may be less critical for those focused on longer-term trading strategies.
General Disclaimer:
The trade ideas presented herein are solely for illustrative purposes forming a part of a case study intended to demonstrate key principles in risk management within the context of the specific market scenarios discussed. These ideas are not to be interpreted as investment recommendations or financial advice. They do not endorse or promote any specific trading strategies, financial products, or services. The information provided is based on data believed to be reliable; however, its accuracy or completeness cannot be guaranteed. Trading in financial markets involves risks, including the potential loss of principal. Each individual should conduct their own research and consult with professional financial advisors before making any investment decisions. The author or publisher of this content bears no responsibility for any actions taken based on the information provided or for any resultant financial or other losses.

SUPPORTS AND RESISTANCE Support and resistance levels are key concepts that help investors navigate price movements. These levels are psychological and technical markers where a coin's price tends to slow down, reverse, or consolidate. Understanding them can make the difference between a successful trade and a missed opportunity. What Are Supports and Resistances? Support is a price level where demand for a cryptocurrency is strong enough to prevent further decline. Think of it as a floor where prices “bounce” upward. Resistance is the opposite— a ceiling where selling pressure prevents the price from rising further. These levels form due to the collective actions of traders. At support levels, buyers feel the price is low enough to enter the market. At resistance levels, sellers believe the price is high enough to secure profits. Why Don’t They Last Forever? Support and resistance levels are not permanent because market conditions, sentiment, and external factors are constantly changing. These shifts happen because of supply and demand imbalances or significant events, such as news about regulations, technological upgrades, or changes in market sentiment. Avoiding the Trap of Greed Many traders make the mistake of placing their buy or sell orders right at these levels, aiming for maximum gain. However, this approach can be risky: Support and resistance levels are zones, not fixed lines. A coin’s price might come close but not touch your order before reversing. Missed opportunities: Waiting for the “perfect” entry point might result in missing a profitable trade by a few cents. A wiser strategy is to avoid being too greedy: Place buy orders slightly above support and sell orders slightly below resistance to improve the likelihood of execution. The Big Picture Support and resistance levels are tools—not guarantees. Successful traders view them as part of a broader strategy.

Momentum Trading Strategies Across AssetsMomentum trading is a strategy that seeks to capitalize on the continuation of existing trends in asset prices. By identifying and following assets exhibiting strong recent performance—either upward or downward—traders aim to profit from the persistence of these price movements.
**Key Components of Momentum Trading:**
1. **Trend Identification:** The foundation of momentum trading lies in recognizing assets with significant recent price movements. This involves analyzing historical price data to detect upward or downward trends.
2. **Diversification:** Implementing momentum strategies across various asset classes—such as equities, commodities, currencies, and bonds—can enhance risk-adjusted returns. Diversification helps mitigate the impact of adverse movements in any single market segment.
3. **Risk Management:** Effective risk management is crucial in momentum trading. Techniques such as setting stop-loss orders, position sizing, and continuous monitoring of market conditions are employed to protect against significant losses.
4. **Backtesting:** Before deploying a momentum strategy, backtesting it against historical data is essential. This process helps assess the strategy's potential performance and identify possible weaknesses.
5. **Continuous Refinement:** Financial markets are dynamic, necessitating ongoing evaluation and adjustment of trading strategies. Regularly refining a momentum strategy ensures its continued effectiveness amid changing market conditions.
**Tools and Indicators:**
- **Relative Strength Index (RSI):** This momentum oscillator measures the speed and change of price movements, aiding traders in identifying overbought or oversold conditions.
- **Moving Averages:** Utilizing short-term and long-term moving averages helps in smoothing out price data, making it easier to spot trends and potential reversal points.
**Common Pitfalls to Avoid:**
- **Overtrading:** Excessive trading can lead to increased transaction costs and potential losses. It's vital to adhere to a well-defined strategy and avoid impulsive decisions.
- **Ignoring Market Conditions:** Momentum strategies may underperform during sideways or choppy markets. Recognizing the broader market environment is essential to adjust strategies accordingly.
By understanding and implementing these components, traders can develop robust momentum trading strategies tailored to various asset classes, thereby enhancing their potential for consistent returns.
Source: digitalninjasystems.wordpress.com
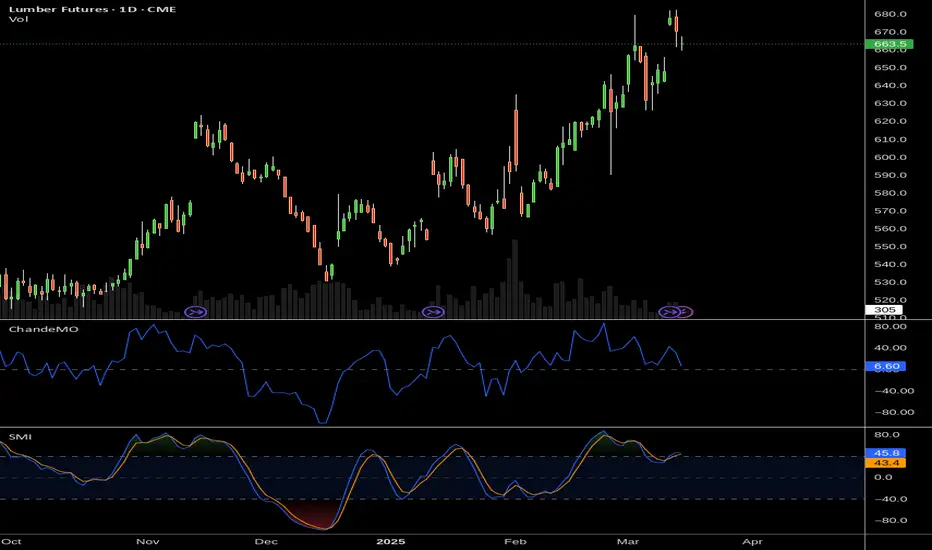
Don't Confuse "DYOR" with Confirmation Bias in Crypto TradingIn the crypto space, influencers and self-proclaimed crypto gurus constantly tell you to " do your own research " (DYOR) while presenting coins that will supposedly do 100x or become the "next big thing." They always add, " this is not financial advice ," but few actually explain how to do proper research.
On top of that, most influencers copy each other, get paid by projects to promote them, and—whether they admit it or not—often contribute to confirmation bias.
What is confirmation bias? It’s the psychological tendency to look for information that confirms what we already believe while ignoring evidence that contradicts it.
For example, if you want to believe a certain altcoin will 100x, you’ll naturally look for articles, tweets, and videos that say exactly that—while ignoring red flags.
How do you distinguish real research from confirmation bias?
This article will help you:
• Understand confirmation bias and how it affects your investments
• Learn how to conduct proper, unbiased research
• Discover the best tools and sources for real analysis
________________________________________
What Is Confirmation Bias & How Does It Sabotage Your Investments?
Confirmation bias is the tendency to seek, interpret, and remember information that confirms what we already believe—while ignoring evidence to the contrary.
In crypto, this leads to:
✔️ Only looking for opinions that confirm a coin is "going to the moon"
✔️ Avoiding critical discussions about the project’s weaknesses
✔️ Believing "everyone" is bullish because you're only consuming pro-coin content
The result?
• You make emotional investments instead of rational ones
• You expose yourself to unnecessary risk
• You develop unrealistic expectations and are more vulnerable to FOMO
________________________________________
How to Conduct Proper Research & Avoid Confirmation Bias
1. Verify the Team & Project Fundamentals
A solid crypto project must have a transparent, experienced team. Check:
• Who are the founders and developers? Are they reputable or anonymous?
• Do they have experience? Have they worked on successful projects before?
• Is the code open-source? If not, why?
• Is there a strong whitepaper? It should clearly explain the problem, the solution, and the technology behind it.
Useful tools:
🔹 GitHub – Check development activity
🔹 LinkedIn – Verify the team's background
🔹 CoinMarketCap / CoinGecko – Check market data and tokenomics
2. Analyze Tokenomics & Economic Model
A project can have great technology but fail due to bad tokenomics.
Key questions to ask:
• What’s the maximum supply? A very high supply can limit price growth.
• How are the tokens distributed? If the team and early investors hold most of the supply, there’s a risk of dumping.
• Are there mechanisms like staking or token burning? These can impact long-term sustainability.
Useful tools:
🔹 Token Unlocks – See when tokens will be released into circulation
🔹 Messari – Get detailed tokenomics reports
3. Evaluate the Community Without Being Misled
A large, active community can be a good sign, but beware of:
• Real engagement vs. bots. A high follower count doesn’t always mean real support.
• How does the team respond to tough questions? Avoid projects where criticism is silenced.
• Excessive hype? If all discussions are about "Lambo soon" and "to the moon," be cautious.
Where to check?
🔹 Twitter (X) – Follow discussions about the project
🔹 Reddit – Read community opinions
🔹 – See how the team handles criticism
4. Verify Partnerships & Investors
Many projects exaggerate or fake their partnerships.
• Is it listed on major exchanges? Binance, Coinbase, and Kraken are more selective.
• Are the investors well-known VCs? Funds like A16z, Sequoia, Pantera Capital don’t invest in just anything.
• Do the supposed partners confirm the collaboration? Check their official sites or announcements.
Where to verify?
🔹 Crunchbase – Check a project's investors
🔹 Medium – Many projects announce partnerships here
5. Watch the Team's Actions, Not Just Their Words
• Have they delivered on promises? Compare the roadmap to actual progress.
• What updates have they released? A strong project should have continuous development.
• Are they selling their own tokens? If the team is dumping their coins, it’s a bad sign.
Useful tools:
🔹 Etherscan / BscScan – Track team transactions
🔹 DefiLlama – Check total value locked (TVL) in DeFi projects
________________________________________
Final Thoughts: DYOR Correctly, Not Emotionally
To make smart investments in crypto, you must conduct objective research—not just look for confirmation of what you already believe.
✅ Analyze the team, tokenomics, and partnerships.
✅ Be skeptical of hype and verify all claims.
✅ Use on-chain data, not just opinions.
✅ Don’t let FOMO or emotions drive your decisions.
By following these steps, you’ll be ahead of most retail investors who let emotions—not facts—guide their trades.
How do you do your own research in crypto? Let me know in the comments!

Learn To Invest: Global Liquidity Index & BitcoinGlobal Liquidity Index & BitCoin:
🚀 Positive Vibes for Your Financial Journey! 🚀
BITSTAMP:BTCUSD
Look at this chart! It's the Global Liquidity Index , a measure of how much extra money is flowing through the world's financial systems.
Why is this important? Because when this index is high, it often means good things for investments like #Bitcoin! 📈
Think of it like this: when there's more money flowing, people are often more willing to take risks and invest in things like Bitcoin.
See those "BullRun" boxes? That means things are looking bright! It's showing that money is flowing, and that's often a good sign for potential Bitcoin growth. 🌟
Even if you're not a pro, it's easy to see the good news here. Understanding these trends can help you make smarter decisions.
Let's all aim for growth and success! 💪

Trading Psychology or Technical Analysis—When Mind Meets MatterThere’s an age-old battle in trading that makes the bull vs. bear debate look like a game of pickleball (no offense, finance bros). It’s the clash between the traders who swear by their charts and the ones who insist it’s all about mindset.
The technicals versus the psychologicals. Fibonacci retracements versus fear and greed. RSI versus your racing heart.
TLDR? Both matter—a lot. But knowing when to trust your indicators, when to trust yourself, and when to blend both is the fine line that separates those who thrive from those who rage-quit.
⚔️ The Cold, Hard Numbers vs. the Soft, Messy Brain
Think of technical analysis as your sometimes inaccurate GPS in trading. It’s structured, predictable, and gives you clear entry and exit points—until it doesn’t. Because markets, much like a GPS in a tunnel, don’t always cooperate.
That’s where psychology creeps in. Your mind is the ultimate trading algorithm, but it’s often running outdated software. Fear of missing out? That’s just your brain throwing a tantrum. Revenge trading? A glitch in emotional processing. Overconfidence after three wins in a row? Well done, you genius.
Technical analysis gives you signals, but trading psychology determines how you act on them.
🤷♂️ When the Chart Says One Thing, and Your Brain Says Another
Picture this: You’ve mapped out the perfect setup. The moving averages align, volume confirms the breakout, and everything screams BUY .
But then your brain whispers, What if it reverses? What if this is a trap? What if I’m about to donate my account balance to the market gods?
You hesitate. The price moves without you. Now, frustration kicks in, and suddenly, you’re clicking BUY at the worst possible moment—just in time for a pullback.
Sometimes, the best trade is the one you don’t take. And sometimes, trusting the chart over your overthinking brain is the only way forward.
🔥 The Big Guys and Their Choices
Legendary investors have picked their sides in this debate. Howard Marks, the co-founder of Oaktree Capital, has long been a big believer in market psychology. He argues that understanding investor sentiment is more valuable than any chart pattern because markets are driven by cycles of greed and fear.
On the other hand, Paul Tudor Jones—one of the greatest traders of all time—leans on technicals, famously saying, “The whole trick in investing is: ‘How do I keep from losing everything?’ If you use the 200-day moving average rule, you get out. You play defense.”
Both approaches work. The question is: Are you the type who deciphers market mood swings, or do you trust that a well-placed moving average will tell you when to cut and run?
🌀 Overtrading: The Technical Trap and the Psychological Spiral
Overtrading usually starts with a good trade, a small win, and a rush of dopamine that convinces you you’ve cracked the code. So, you take another trade. Then another. And before you know it, you’re firing off entries like a caffeinated gamer, except your PnL is the one taking the damage.
Technical traders fall into this trap because they see too many setups. Every candlestick pattern, every little bounce, every “potential” breakout becomes a reason to trade.
Psychological traders, on the other hand, may overtrade out of boredom, frustration, or the need to “make back” losses.
The result? An emotional rollercoaster that ends with an account balance you don’t want to check the next morning.
The fix? Trade selectively. The best setups don’t come every five minutes, and forcing trades is like forcing a bad joke—it just doesn’t land.
💪 Fear, Greed, and the Art of Holding Your Ground
Every trader knows the feeling: You’re in profit, but instead of letting the trade play out, you close early because profit is profit, right?
Wrong.
Fear of losing profits is what keeps traders from maximizing their wins. And greed—the evil twin of fear—is what makes traders hold losing trades, hoping for a miracle. It’s the classic “let winners run, cut losers short” rule in reverse.
Technical traders know where their stops and targets are. The problem? They often ignore them when emotions take over. Psychological traders “feel” the market but get crushed when that gut feeling betrays them.
The best traders find the balance—using technicals to set logical targets and psychology to actually stick to the plan.
🤝 The Solution? A System That Checks Both Boxes
So, what’s the verdict? Do you put matter over mind or mind over matter?
The truth is, great traders do both. They develop strategies based on technicals but manage execution with discipline. They respect risk management rules not just because the chart says so, but because they know how destructive emotions can be.
Here’s what the best do differently:
✅ They journal trades —not just the setups but how they felt during the trade.
✅ They stick to a trading plan so they can trust their system over impulse.
✅ They set rules that help them to properly bounce back from losses .
✅ They know the value of knowledge and never stop learning. (We’ve got you covered here, too. Go check the Top Trading Books if you’re a trader and stop by the Top Books on Investing if you’re an investor).
💚 Final Thoughts: Mind and Market in Harmony
In the end, trading is never just one or the other. It’s not pure math, and it’s not pure mindset. It’s a dance between structure and instinct, strategy and psychology. The ones who get it right aren’t just great at reading charts—they’re great at reading themselves.