Why Traders Chase — and Always LoseHard truth:
You don’t miss opportunities. You chase noise.
Let’s break down the real reason you keep “missing moves”:
1. FOMO is not urgency — it’s confusion.
When you enter because “everyone’s talking about it,” you’re not trading a setup. You’re reacting to social proof.
2. Volatility ≠ opportunity.
Big moves look attractive, but if they’re not in your plan — they’re distractions, not trades.
3. The market rewards patience, not activity.
Every click, every chart, every refresh feeds your dopamine — not your edge.
🚫 Solution?
Stop scanning. Start filtering.
Use tools that prioritize structure over noise. That’s why we built TrendGo — to give clarity in chaos and help you avoid traps masked as opportunity.
📌 Don’t chase. Build your edge.
Fundamental Analysis

US30Y : Not perfect anymoreS&P in 2011
Fitch in 2023
Now Moody downgraded it from AAA to Aa1
The reason is clear. The market thinks debt and interest payments are not sustainable for the US, Europe, Japan, and elsewhere. Bottom line: Nowhere is safe. No government bond is safe.
If it keeps climbing, above 5.25%, the Fed will have to act. The only way is QE. However, this time US will print to save just itself. No more life line swaps for the rest. Tariff would be in place. No trade with uncle SAM anymore. If you reject the rule based order, where you recycle your surplus forex and petrodollar into UST, you can expect no help.
This is the chart to watch if you are playing XAU and BTC.
For DXY, dollar may fall. Just that the other currencies will fall FASTER.
Watch it:
a) go up above 5.25%
b) then watch if the FED goes into action.
Exit stocks like what M.Burry did a few days ago.
Good luck to all of us. This will not end well.

The Secret Behind Bitcoin’s Sudden Nighttime PumpsHow does Bitcoin suddenly make wild jumps at night?
Whales are playing behind the scenes while amateur traders keep falling into traps!
In this analysis, you’ll learn how to spot these mysterious pumps and actually profit from them.
Hello✌
Spend 3 minutes ⏰ reading this educational material. The main points are summarized in 3 clear lines at the end
🎯 Analytical Insight on BNB: A Personal Perspective:
BNB has broken out of its multi-day descending channel to the upside 📈, yet the move lacks strong momentum and decisive follow-through. Historically, Binance Coin tends to trend with measured, deliberate price action rather than sharp rallies. A potential retest of the channel breakout zone remains possible, with a medium-term target set at $710 — representing a projected 9% move, assuming price holds above key support 🛡️.
Now , let's dive into the educational section ,
1. Nighttime Pumps: Whale Games or Just Luck? 🐋🎲
Sudden Bitcoin pumps during low-volume hours, especially at night, usually come from big whale moves or a cluster of smaller whales acting together. When market volume is low, even a small order can move the price drastically.
These engineered moves often aim to trick retail traders and create fake hype.
2. What Do On-Chain Data Say? 📊🔍
By checking on-chain data like transaction volumes, active addresses, and coin movements in big wallets, we can tell if a pump is real and sustainable or just a temporary shock.
For example, a rise in exchange inflows alongside a pump could signal a potential mass sell-off after a rapid price jump.
3. Market Psychology at Night 🧠🌙
Night hours usually see reduced trading volume, which increases volatility and risk. Less experienced traders often get emotional and jump in quickly due to FOMO (Fear Of Missing Out).
Learn how to control your emotions and wait patiently for confirmed signals like a pro.
4. Key Indicators & Advanced TradingView Tools to Spot Night Pumps 📈🛠️
To catch Bitcoin’s sudden night pumps, rely on key indicators like RSI, MACD, volume, and Bollinger Bands. For instance, a sudden volume spike with RSI in the overbought zone can warn you a pump is ending.
Additionally, TradingView’s innovative tools like Volume Profile and Order Flow let you see whale buying/selling pressure and identify critical support/resistance levels.
These tools reveal the real market structure during volatile night moves, helping you make sharper, lower-risk decisions.
Don’t forget multi-timeframe analysis to avoid false signals and understand pumps within bigger trends.
5. Strategies for Trading Night Pumps ⚔️⏳
One of the best ways is setting tight stop-loss orders and scalping during these moves.
Using price action analysis and following whale behavior from analyst insights can guide you to smarter entries and exits.
6. Risks and Important Tips ⚠️💡
Always remember, sudden pumps carry high risk and can lead to liquidation.
Trading during low-volume hours isn’t recommended for beginners. Stay aware of market volatility and emotional impulses.
7. Summary 📝✅
Nighttime Bitcoin pumps can be great profit opportunities but only if you enter with knowledge and a plan.
By understanding on-chain data, market psychology, and key indicators, you’ll make smarter decisions and benefit from these mysterious moves.
However , this analysis should be seen as a personal viewpoint, not as financial advice ⚠️. The crypto market carries high risks 📉, so always conduct your own research before making investment decisions. That being said, please take note of the disclaimer section at the bottom of each post for further details 📜✅.
Give me some energy !!
✨We invest countless hours researching opportunities and crafting valuable ideas. Your support means the world to us! If you have any questions, feel free to drop them in the comment box.
Cheers, Mad Whale. 🐋

the markets are a very emotional cry babyIf you've ever asked, “Why is the market going up on bad news?” or “Why did it dump after great earnings?”, you're not alone.
Markets may seem logical—economic data in, price action out—but in reality, they’re driven by human emotion, crowd psychology, and reflexive feedback loops. The charts don’t lie, but the reasons behind the moves? Often irrational.
Let’s break down why markets are emotional—and how traders can use that to their advantage.
🧠 1. Markets Are Made of People (and People Aren’t Rational)
Even in the age of algorithms, human behaviour sets the tone. Fear, greed, FOMO, panic—all of it shows up on charts.
Fear leads to irrational selling
Greed fuels bubbles and euphoria
Uncertainty causes volatility spikes—even with no new information
📉 Example: The 2020 COVID crash saw massive capitulation. Then came one of the fastest bull markets ever—driven by stimulus and FOMO.
another example
📊 S&P 500 in 2020 with VIX, the S&P 500 crashed and the VIX went up, When the VIX (CBOE Volatility Index) goes up, it means that traders/investors expect a greater likelihood of price fluctuations in the S&P 500 over the next 30 days. This generally indicates increased fear as shown on the chart below
📈 2. Price Doesn’t Reflect Facts—It Reflects Belief
The market is not a thermometer. It’s a barometer of expectations.
When traders believe something will happen—whether true or not—price adjusts. If the Fed is expected to cut rates, assets may rally before it actually happens.
💡 Nerd Tip: Reality matters less than consensus expectations.
Chart Idea to visit:
💬 USD Index vs. Fed rate expectations (2Y yield or futures pricing)
🪞 3. Reflexivity: Belief Becomes Reality
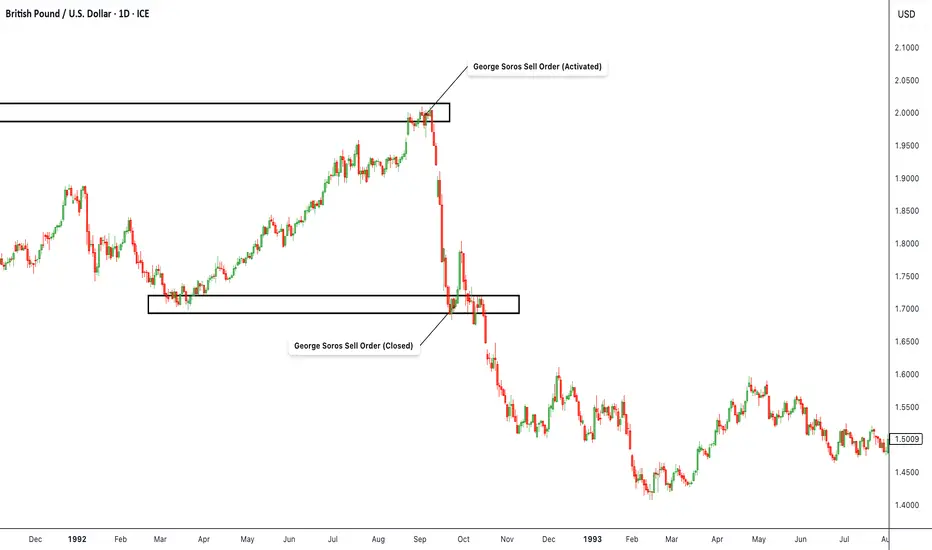
Coined by George Soros, reflexivity explains how beliefs can influence the system itself.
Traders bid up assets, creating bullish momentum
That momentum attracts more buyers, reinforcing the trend
Eventually, fundamentals “catch up” (or the bubble bursts)
📌 Insight: The market creates its own logic—until it doesn’t.
😬 4. Emotional Extremes Create Opportunity
When markets overreact, they offer setups for rational traders.
Capitulation = Bottom Fishing
Euphoria = Caution
Disbelief = Strongest rallies
🧠 Pro Tip: Watch sentiment indicators, not just price. Fear & Greed Index, put/call ratios, or COT data reveal what the crowd is feeling.
Chart Example:
📊 Bitcoin 2022 bottom vs. Fear & Greed Index.. on the chart above the index score close to zero (RED) indicating extreme fear this was because in november 2022 crypto cybercrimes grew new level and investors lost confidence, these cyber crimes included the bankruptcy of FTX as the owners were allegedly misusing customer funds.
💡 5. How to Trade Rationally in an Irrational Market
a. Have a plan. Pre-define entries, exits, and invalidation levels.
b. Expect overreaction. Markets often go further than they “should.”
c. Use sentiment tools. Divergences between price and emotion are gold.
d. Don’t fight the crowd—until it peaks. Fade extremes, not momentum.
e. Zoom out. 5-minute panic means nothing on a weekly trendline.
🎯Nerd Takeaway:
Markets aren’t efficient—they’re emotional.
But that emotion creates mispricing, and mispricing = opportunity.
You don’t need to predict emotion—you just need to recognize it, and trade on the reversion to reason.
💬 Have you ever traded against the crowd and nailed it? Or got caught up in the hype? Drop your chart and your story—let’s learn from each other.
put together by : @currencynerd as Pako Phutietsile

Liquidation Begins With a Thought, Not a CandleHave you ever found yourself opening a trade you knew you shouldn’t?
That whisper in your head saying, “This setup looks different…” only for you to get stopped out or liquidated hours later?
It probably wasn’t your strategy that failed — it was your brain.
Hello✌
Spend 3 minutes ⏰ reading this educational material. The main points are summarized in 5 clear lines at the end
🎯 Analytical Insight on XRP: A Personal Perspective:
XRP is approaching a key daily resistance confluence with a descending trendline, after breaking out of its recent bearish channel and reclaiming prior structure levels 📈. I anticipate a gradual upside continuation with a minimum projected move of +14%, targeting the $2.85 zone. Two major daily supports — aligned with Fibonacci retracements — have also been identified as key demand zones for potential retests 🔍.
🧠 How Your Brain Leads You to Liquidation
A Psychological Trap Every Trader Must Know
Let’s explore how your mind tricks you into losses and which TradingView tools can help you stay focused and objective in the heat of the market.
🛠️ How to Protect Yourself (And Your Capital)
✅ Use multi-timeframe analysis:
Sometimes a bullish move on the 15-min chart is just a retest on the 4H. TradingView makes it easy to monitor several timeframes side-by-side.
✅ Set alerts instead of staring at charts:
Let TradingView notify you when your trade setup actually appears. Reduce emotional overtrading.
✅ Trust neutral tools like EMA, VWAP, or Volume Profile:
They offer structure and objectivity — less prone to emotional interpretation.
✅ Keep a trading journal:
Use the idea publishing feature or private notes to reflect on why you entered a trade. Most mistakes repeat when they’re not reviewed.
🔍 Cognitive Biases in Action
Your brain is wired for survival, not profits. It reacts emotionally — especially under pressure.
One of the most common psychological traps in trading is confirmation bias:
You form an opinion first, then only look for information that supports it.
It’s like spotting a resistance level on BTC but ignoring bearish signals because you want the price to break out.
You're not analyzing anymore — you're convincing yourself.
😨 FOMO: The Invisible Hand That Pushes Bad Trades
Bitcoin rallied from $93.4K to $102K in early January 2025.
The crowd on social media went wild: “ATH is coming!” was everywhere.
But on the chart? RSI was overbought, MACD flashed a bearish divergence.
Still, traders entered blindly — emotionally. Days later, BTC encounter with more loss.
This wasn’t technical failure. It was pure psychological FOMO.
🧘♂️ Train Your Mind Before You Train the Market
The charts don’t lie — but your interpretation of them might.
That’s why the best traders don’t just study the market, they study themselves.
Master your mindset, and the market won’t master you.
However , this analysis should be seen as a personal viewpoint, not as financial advice ⚠️. The crypto market carries high risks 📉, so always conduct your own research before making investment decisions. That being said, please take note of the disclaimer section at the bottom of each post for further details 📜✅.
🧨 Our team's main opinion is: 🧨
XRP has broken out of its downward channel and is now approaching key resistance; I’m eyeing a steady move toward the $2.85 target with at least +14% potential upside 📊.
Trading mistakes often come from our own minds, not the market. Emotional biases like confirmation bias and FOMO can trick you into bad trades—just like BTC’s in early January 2025 jump that fooled many 📉. To protect your capital, use TradingView’s multi-timeframe analysis, alerts, and objective tools like EMA or VWAP. Remember, mastering your mindset is as crucial as reading the charts.
Give me some energy !!
✨We invest countless hours researching opportunities and crafting valuable ideas. Your support means the world to us! If you have any questions, feel free to drop them in the comment box.
Cheers, Mad Whale. 🐋

Scalping and Swing Trading Strategies
A Guide to Optimizing on TradingView
Scalping and swing trading strategies are two popular trading approaches in Forex, OANDA:XAUUSD gold, and cryptocurrencies, enabling traders to capitalize on price movements for maximum profits. Scalping focuses on short-term trades with small gains, while swing trading targets longer-term trends. This article guides you on implementing these strategies on TradingView using tools like RSI, MACD, and Fibonacci. Let’s dive in to elevate your trading skills!
1. What is Scalping?
Scalping is a short-term trading strategy where traders execute multiple trades daily, capitalizing on small price movements (often a few pips). The goal is to accumulate small profits from numerous trades.
Timeframe: 1-minute (M1) or 5-minute (M5).
Suitable markets: Forex (EUR/USD, GBP/USD), gold (XAU/USD), or cryptocurrencies (BTC/USD).
Requirements: Quick reactions, strict risk management, and appropriate leverage.
Example: A scalper might buy EUR/USD when the price touches the lower Bollinger Band on an M5 chart and sell when it reaches the middle band.
2. What is Swing Trading?
Swing trading is a medium- to long-term strategy that captures “price swings” within larger trends. Traders hold positions for days to weeks to maximize profits from significant price movements.
Timeframe: 4-hour (H4) or daily (D1).
Suitable markets: Stocks, Forex, gold, and cryptocurrencies.
Requirements: Patience, trend analysis skills, and effective capital management.
Example: A swing trader might buy XAU/USD when the price hits the 61.8% Fibonacci level on an H4 chart and hold until it reaches the next resistance.
3. Why Use Scalping and Swing Trading Strategies on TradingView?
TradingView offers powerful tools to execute both strategies effectively:
Flexible price charts: Supports multiple timeframes and chart types (candlestick, Renko).
Technical indicators: RSI, MACD, Bollinger Bands, Fibonacci, and more.
Price alerts: Set notifications for when prices hit support/resistance levels.
Pine Script: Customize indicators or automate trading strategies.
Tip: Use TradingView’s “Replay” feature to test scalping or swing trading strategies on historical data.
4. Scalping Strategy on TradingView
4.1. Tools and Setup
Timeframe: M1 or M5.
Indicators:
Bollinger Bands (period 20, deviation 2).
RSI (period 14, overbought 70, oversold 30).
Trading pairs: EUR/USD, GBP/USD, or XAU/USD (due to high liquidity).
4.2. Trading Rules
Buy signal:
Price touches the lower Bollinger Band.
RSI <30 (oversold).
Confirmed by a reversal candlestick pattern (e.g., Doji).
Sell signal:
Price touches the upper Bollinger Band.
RSI >70 (overbought).
Confirmed by a reversal candlestick.
Risk management:
Set Stop Loss 5–10 pips below the nearest support.
Take Profit at 10–15 pips or when the price hits the middle Bollinger Band.
4.3. Example
On an M5 EUR/USD chart, if the price touches the lower Bollinger Band at 1.0850 and RSI <30, enter a buy order. Set Stop Loss at 1.0840 and Take Profit at 1.0865. Exit when the price reaches the middle band.
Image illustration: EUR/USD M5 chart with Bollinger Bands and RSI (optimize alt text: “EUR/USD scalping chart TradingView”).
5. Swing Trading Strategy on TradingView
5.1. Tools and Setup
Timeframe: H4 or D1.
Indicators:
Fibonacci Retracement.
MACD (12, 26, 9).
Moving Averages (MA50, MA200).
Trading pairs: XAU/USD, GBP/USD, or BTC/USD.
5.2. Trading Rules
Buy signal:
Price hits the 50% or 61.8% Fibonacci level in an uptrend.
MACD crosses above the signal line.
Price is above MA50.
Sell signal:
Price hits the 50% or 61.8% Fibonacci level in a downtrend.
MACD crosses below the signal line.
Price is below MA50.
Risk management:
Set Stop Loss below the nearest support (20–50 pips, depending on the pair).
Take Profit at the next resistance or a 1:2 risk-reward ratio.
5.3. Example
On an H4 XAU/USD chart, if the price hits the 61.8% Fibonacci level at $1,950 in an uptrend and MACD confirms a buy signal, enter a buy order. Set Stop Loss at $1,930 and Take Profit at $2,000.
Image illustration: XAU/USD H4 chart with Fibonacci and MACD (optimize alt text: “XAU/USD swing trading chart TradingView”).
6. Tips for Applying Scalping and Swing Trading Strategies
Combine with fundamental analysis: Economic news (interest rates, NFP reports) can impact prices, especially in Forex and OANDA:XAUUSD gold.
Backtest strategies: Use TradingView’s “Replay” mode to test strategies before live trading.
Manage emotions: Scalping requires intense focus, while swing trading demands patience. Choose the strategy that suits your personality.
Optimize costs: Scalping incurs high spread costs, so choose a broker with low spreads.
7. Conclusion
Scalping and swing trading strategies offer profitable opportunities in Forex, OANDA:XAUUSD gold, and cryptocurrencies, depending on your trading style. With TradingView’s powerful tools like Bollinger Bands, Fibonacci, and MACD, you can easily implement these strategies. Try scalping on EUR/USD or swing trading on XAU/USD today and share your results with the TradingView community! Sign up for TradingView to explore more features and optimize your trading.

The Yen’s Comeback Starts Here—and it Seems the COT Knew First1. Introduction: A Market Everyone Gave Up On
For a while, the Japanese Yen looked like a lost cause. After topping out in early 2021, Yen futures (6J1!) began an unrelenting slide, shedding value week after week like an old coat in spring. Traders stopped asking, “Where’s support?” and started asking, “How low can it go?”
The macro backdrop didn’t help. The Bank of Japan clung to ultra-loose monetary policy, even as the Fed hiked aggressively. Speculators piled on shorts. The Yen was a one-way ticket down, and no one seemed interested in punching the brakes.
But beneath that apathy, a quieter shift was underway. While price kept bleeding, trader positioning began to hint at something different—something the chart didn’t show yet. And if you were watching the Commitments of Traders (COT) report closely enough, you might’ve seen it.
2. The COT Trend That No One Was Watching
The COT report isn’t glamorous. It’s slow, lagging by a few days, and rarely makes headlines. But for those who track what the big players are doing—those large enough to be required to report their positions—it’s a treasure trove of subtle clues.
One of those clues is Total Reportable Positions. This metric tells us how active large market participants really are—regardless of whether they’re long or short. When that number is dropping, it suggests the “big dogs” are losing interest. When it starts climbing again? Someone’s gearing up to play.
From 2021 through most of 2024, Total Reportable Positions in 6J were in a steady decline—mirroring the slow death of the Yen's bullish case. But in late 2024, something changed. Using a simple linear regression channel on this COT data, a clear breakout emerged. Positioning was picking up again—for the first time in nearly three years.
And it wasn’t just a bounce. It was a structural shift.
3. Did Price Listen?
Yes—and no. Price didn't immediately explode higher. But the structure began to change. The market stopped making new lows. Weekly closes began to cluster above support. And importantly, a Zig Zag analysis started marking a pattern of higher lows—the first signs of accumulation.
Here’s where the chart really gets interesting: the timing of the COT breakout coincided almost perfectly with a key UFO support at 0.0065425—a price level that also marked the bottom in COT Traders Total Reportable Longs. This adds a powerful layer of confirmation: institutional orders weren’t just showing up in the data—they were leaving footprints on the chart.
And above? There’s a UFO resistance level at 0.0075395. If the Yen continues to climb, that could be a significant price level where early longs may choose to lighten up.
4. The Contract Behind the Story
Before we go deeper, let’s talk about what you’re actually trading when you pull the trigger on Yen Futures.
The CME Japanese Yen futures (6J) contract represents 12.5 million Japanese Yen, and each tick move—just 0.0000005 per JPY—is worth $6.25. It’s precise, it’s liquid, and for traders who like to build macro positions or take advantage of carry flows, it’s a staple.
As of May 2025, margin requirements hover around ~$3,800 (Always double-check with your broker or clearing firm—these numbers shift from time to time.)
But maybe you’re not managing seven-figure accounts. Maybe you just want to test this setup with more flexibility. That’s where the Micro JPY/USD Futures (MJY) come in.
Contract size: 1/10th the size of 6J
Tick move: 0.000001 per JPY increment = $1.25
Same market structure, tighter margin requirement around ~$380 per contract
Important note: The COT report aggregates positioning across the whole futures market—it doesn’t separate out micro traders from full-size. So yes, the data still applies. And yes, it still matters.
5. Lessons from the Shift
This isn’t about hindsight bias. The value in this setup isn’t that the Yen happened to bounce—it’s how Total Reportable Positions broke trend before price did.
Here are the real takeaways:
COT data may or may not be predictive—but it is insightful. When positioning starts expanding after a long contraction, it often signals renewed interest or risk-taking. That’s tradable information.
Technical support and resistance as well as highs and lows give context. Without them, COT breakouts can feel theoretical. With them, you have real, observable UFO levels where institutions may act—and where you can plan.
6. Watchlist Insights: Where This Might Work Again
You don’t have to wait for another yen setup to apply this framework. The same structure can help you scout for early positioning shifts across the CME product universe.
Here’s a simple filter to start building your own COT watchlist:
✅ Look for markets where:
Price has been in a long, clean downtrend (or uptrend)
Total Reportable Positions are falling—but starting to reverse
A breakout occurs in positioning trend (draw a regression channel and watch for a clean violation)
A key support or resistance lines up with recent extremes in COT positioning
Whether it's crude oil, corn, or euro FX, this template gives you a framework for exploration.
🎯 Want to See More Setups Like This?
We’re just getting started. If this breakdown opened your eyes to new ways of using COT reports, UFO levels, and multi-dimensional trade setups, keep watching this space.
When charting futures, the data provided could be delayed. Traders working with the ticker symbols discussed in this idea may prefer to use CME Group real-time data plan on TradingView: www.tradingview.com - This consideration is particularly important for shorter-term traders, whereas it may be less critical for those focused on longer-term trading strategies.
General Disclaimer:
The trade ideas presented herein are solely for illustrative purposes forming a part of a case study intended to demonstrate key principles in risk management within the context of the specific market scenarios discussed. These ideas are not to be interpreted as investment recommendations or financial advice. They do not endorse or promote any specific trading strategies, financial products, or services. The information provided is based on data believed to be reliable; however, its accuracy or completeness cannot be guaranteed. Trading in financial markets involves risks, including the potential loss of principal. Each individual should conduct their own research and consult with professional financial advisors before making any investment decisions. The author or publisher of this content bears no responsibility for any actions taken based on the information provided or for any resultant financial or other losses.

Impatience Tax in Trading: The Costs of Clicking Too SoonHave you ever thought that maybe some of your losses don’t come from bad trades? Rather, they come from good trades, timed badly?
You see the setup, the signal’s almost there, the MACD is leaning in, the candle is flirting with support — and boom, you click. Early. Too early.
Price dips a bit more and then shoots upward like a rocket. Your stop gets triggered — you just paid the impatience tax.
Welcome to the place where you get taxed for being impatient — a very real, very expensive fee traders pay when their fingers move faster than their reasoning.
🤫 The Impatience Tax — A Silent Killer Dressed as Urgency
The impatience tax doesn’t appear on your statement. You won’t see it listed in your commissions, or under slippage, or labeled in red ink like a realized loss. But rest assured, it’s there — nibbling away at your P&L every time you front-run your own strategy.
And the worst part? It feels productive. You’re taking initiative, showing conviction, being bold. Except what you're really doing is lighting good setups on fire because you couldn’t wait for one more candle to close.
🧬 The Anatomy of an Early Click
Here’s how it usually goes:
You spot a setup.
You get excited.
You skip the checklist.
You enter on the 3rd candle instead of the 5th.
The market fakes out.
You get stopped out.
The market then does exactly what you expected — without you.
Every trader has lived this story. And it hurts more than a loss from a bad trade. Because this wasn’t a bad idea. It was a good idea butchered by bad timing.
🤝 Impatience Loves Company (And Volatility)
Impatience tends to thrive in fast markets. When the price is moving, you feel like you need to act. You notice some breaking news that moves markets, charts start to jiggle and tickers flash — suddenly your FOMO glands kick in.
You’re not waiting for confirmation. You’re reacting — to price, to emotion, to fear of missing out.
It’s not just beginners either. Even seasoned traders occasionally get sucked in. Why? Because the brain is wired to avoid missing opportunities more than it’s wired to avoid losses. We want in. Now. Before it's “too late.”
But here’s a pro secret: the markets tend to always give second chances. You just have to be around to take them.
⏰ Why the Best Traders Wait
Let’s talk about patience. Not the zen-monk, meditate-in-a-cave-for-years kind. The market kind.
The kind that says: “Nope, not yet.”
The kind that closes the platform until the London session starts.
The kind that lets a trade go because it didn’t meet all the criteria — even if it was close.
Top traders aren’t paid for activity. They’re paid for precision. The entry is 90% of the battle. If you win there, the rest is just management.
🧐 How to Identify an Impatience Habit
Want to know if you’re paying the impatience tax regularly? Try this:
Look at your last 10 triggered stop loss orders: How many were within a few ticks of reversal?
Count your trades per day: Are you averaging more than your strategy demands?
Review your entry notes: Did you say things like “close enough” or “looks good”?
If the answer is yes, you’re a tax-paying member of the Impatience Society.
👷♂️ Build a Buffer: Taming the Trigger Finger
So how do you stop paying the Impatience Tax?
Start with structure:
Use time-based confirmations. Wait for the candle to close. A candle halfway formed is a lie detector test mid-question.
Have a rule-based checklist. If a trade doesn’t meet every item, you don’t take it. No exceptions.
Use alerts , not entries. Let the price come to you. Your job is to hunt, not chase.
Trade fewer setups, better. Less is more when each trade has meaning and clarity.
And when in doubt? Wait. The worst that happens is you miss one trade. The best that happens is you finally stop losing money edge by edge.
💵 Impatience Is Expensive. Patience Is Profitable.
The market is designed to reward discipline, not urgency. Speed might help you scalp news reactions, but even that requires planned execution. Unchecked impatience is just impulse with a brokerage account.
It's important to always remember that you’re not trying to win this trade. You’re trying to win this game for the long run.
And winning the game means surviving long enough to let your edge play out — with patience, not panic.
💎 Final Thoughts: Don’t Confuse Action with Progress
The financial markets are a cruel place for dopamine seekers. They offer constant motion, flashing lights, and infinite temptation to click before thinking.
But progress isn’t about how many trades you take — it’s about how many good ones you wait for.
So next time your mouse finger twitches, ask yourself: Is this the plan? Or is this impatience disguised as opportunity seeking instant gratification?
Because every early click is a donation to someone else’s P&L.
👉 Your turn : What’s your best (or worst) story of jumping the gun? How have you built patience into your process — or are you still wrestling with the trigger? Let us know in the comments!

3 Deadly Trading Mistakes Every Trader Must Avoid NowDid you know that over 70% of trading decisions are influenced by unconscious emotions?
Fear of missing out (FOMO), greed, and external noise can easily steer traders away from rational decision-making. In this analysis, we explore the three most destructive psychological traps in trading—and how to effectively manage them.
Hello✌
Spend 3 minutes ⏰ reading this educational material. The main points are summarized in 3 clear lines at the end
🎯 Analytical Insight on Bitcoin: A Personal Perspective:
Bitcoin has recently established multiple daily resistance levels and has now executed a strong breakout above its long-standing descending channel. This move is backed by a significant increase in buying volume, signaling renewed bullish momentum. From a short-term perspective, I anticipate at least a 6% upside, with a target around the $110,000 zone. 📊🚀
Now , let's dive into the educational section,
1. Fear of Missing Out (FOMO): A Dangerous Impulse
FOMO can easily lead traders to make hasty decisions based on market hype or emotional reactions, rather than solid analysis. This often results in entering trades at the wrong time, chasing price movements, and ultimately suffering losses. 😟
How to Avoid It:
To manage FOMO, establish a well-defined trading strategy. Stick to your plan and avoid reacting to every market move. Focus on your predefined entry points, and resist the urge to "catch up" with the market. 📊
2. Greed and Its Impact on Decision-Making
Greed can cloud a trader's judgment, leading them to hold on to losing positions with the hope that prices will reverse. Alternatively, greed may push traders to enter positions at overextended price levels, anticipating further gains. This often results in greater losses or missed opportunities. 💸
How to Overcome It:
A clear risk management plan is essential. Set stop-loss and take-profit levels before entering any trade. By adhering to these boundaries, you can reduce emotional decision-making and improve the consistency of your trading approach. 📉
3. The Influence of Social Media on Trading Decisions
In today’s digital age, social media platforms are filled with opinions, rumors, and market hype that can lead traders astray. Often, unverified information or exaggerated claims can prompt traders to make impulsive decisions that don’t align with their strategies. 📱
How to Counteract It:
To combat the impact of social media, rely on credible sources of information. Always perform your own analysis and make decisions based on reliable data, not speculative posts. Surround yourself with professionals and resources that help you stay objective. 📚
Using TradingView Tools to Control Emotional Biases
One of the most effective ways to keep your emotions in check is to rely on objective technical indicators. Tools like RSI, MACD, and Bollinger Bands on TradingView can help you identify entry and exit points that align with your strategy rather than reacting to emotion. 📈
By incorporating trendlines, support/resistance levels, and alerts, you can stay disciplined and make decisions that are grounded in technical analysis. These tools guide you in staying on track, even when emotions run high.
The Vital Role of a Trading Plan
A well-structured trading plan is your shield against emotional trading. It provides clear guidelines on when to enter and exit trades, how much risk to take, and sets your financial goals. Without a plan, it’s easy to fall into the trap of impulsive decisions driven by fear or greed. 📝
How to Create One:
Define your strategy, risk management rules, and long-term objectives. A solid trading plan helps you stay focused, prioritize your financial goals, and avoid emotional disruptions. Sticking to it is crucial for sustainable success in the markets.
Conclusion : Mastering Trading Psychology for Long-Term Success
Psychological discipline is just as important as technical skills when it comes to successful trading. By understanding the emotional pitfalls that can cloud your judgment, you can make more rational, data-driven decisions. 📊
Using tools, sticking to your plan, and consistently managing your emotions are key to overcoming psychological barriers. With the right mindset and strategy, you’ll be better positioned to achieve your trading goals and build long-term success. 🚀
However , this analysis should be seen as a personal viewpoint, not as financial advice ⚠️. The crypto market carries high risks 📉, so always conduct your own research before making investment decisions. That being said, please take note of the disclaimer section at the bottom of each post for further details 📜✅.
🧨 Our team's main opinion is: 🧨
Over 70% of trading decisions are influenced by unconscious emotions, with FOMO, greed, and social media noise being major psychological pitfalls. These emotional biases can lead to impulsive decisions, resulting in losses. To avoid this, create a solid trading plan, use reliable tools like RSI, MACD, and Bollinger Bands, and stay disciplined with stop-loss and take-profit levels. 📉
Give me some energy !!
✨We invest countless hours researching opportunities and crafting valuable ideas. Your support means the world to us! If you have any questions, feel free to drop them in the comment box.
Cheers, Mad Whale. 🐋

BTC Bulls vs Bears – Critical Level Tested, What’s Next?🚀📈 BTC Bulls vs Bears – Critical Level Tested, What’s Next? 🐂🐻
Hi everyone! New day, new charts – and once again, our levels played out beautifully! 🎯 The 102,777 zone was the battleground, and after nearly 40 price interactions at that level, the bulls took control. However, all is not settled yet!
We are currently observing multiple divergences across key indicators:
📉 MACD
📉 Histogram
📉 RSI
📉 MOM (Momentum)
📉 MFI
This suggests caution despite the bullish momentum. My expectation is for a retest of the 102,777 level, which remains the key decision point.
Here’s the updated probability outlook:
➡️ 65% chance we push higher toward the next target at 105,962, with sights ultimately set on 113,000.
⬅️ 35% chance we see a rejection and head lower.
Keep an eye on these key levels:
⚔️ 102,777 – The battleground (Bulls vs Bears)
📌 105,962 – Next target
🎯 113,000 – Ultimate target
Before I wrap up, even on the 8-hour chart, there are signs of divergences, so let’s stay sharp and move carefully. Step by step, we’ll navigate this market together!
One Love,
The FXPROFESSOR 💙
ps. WE ARE STAYING LONG! OK?

Bitcoin Bulls Aim for $102K – Breakout or Rejection Ahead?🚀📈 Bitcoin Bulls Aim for $102K – Breakout or Rejection Ahead? 🔍🧠
Good morning, good afternoon, or good evening — wherever you are in the world, Bitcoin is pumping, and that’s always a good sign for the bulls! 🐂
In my last BTC update, we anticipated a bounce from the key support zone around $93,600–$93,800, and price respected this level to the dot, rocketing upward just as expected. 🔥✅ That level acted as a strong springboard, and now BTC is climbing through a well-respected ascending channel on the 15-min chart.
📊 Key levels to watch:
Middle of the channel: ~$98,689
Top of the channel: ~$100,636
Psychological level: $100,000
Projected breakout target: $102,774 (60% probability 🚦)
Major resistance beyond: $113,000
However, there's always the alternate scenario: a 40% chance that we reject under $97,400, re-enter the lower end of the channel, and potentially drop toward $92,000 if that support fails. This would flip the bullish structure short-term — something to keep on your radar. ⚠️
This is a high-momentum situation, and I’ll be watching for confirmation of breakout or breakdown. Stay alert, keep your risk in check, and let the chart guide your trades. 📉📈
Let me know your thoughts in the comments — are we headed for $113K or due for a cooldown?
One Love,
The FXPROFESSOR 💙

What’s America's Real Goal in a Possible India–Pakistan War?We are nearing the end of the petro-dollar era. The power balance of the new world order will be defined not by oil, but by the strategic resources essential for AI, electric vehicles, and cutting-edge technology.
Throughout the 20th century, the U.S. maintained its global dominance by controlling access to oil. From the Middle East to Latin America and Africa, wherever oil was found, the U.S. was there.
But today, the focus has shifted to rare earth elements, lithium, copper, and other strategic minerals.
Trump’s 2025 move to buy Greenland wasn’t a diplomatic joke—it was a signal. Behind-the-scenes deals in Ukraine for rare earth deposits tell the same story: whoever controls these "white gold" assets will lead the tech-driven world.
Now enters Pakistan, with mineral-rich lands spanning over 600,000 km², nearly three times the size of the UK. Experts estimate its underground reserves to be worth $8 trillion.
In Balochistan's Rekodik field alone, there are 12 million tons of copper and 20 million ounces of gold, with a copper purity of 0.53%, well above global standards. In the north, newly discovered lithium reserves could be a game-changer for the EV revolution.
This is no longer just about resources—this is about deciding the future balance of global power.

Trade Wars, Tariffs & Currencies: The Connection Explained📊 What Are Tariffs & Why Should Traders Care? 💱
Tariffs are taxes imposed by a country on imported goods. Think of them as the "price of entry" foreign products must pay to access domestic markets.
🔍 Why Governments Use Them:
Protect domestic industries from cheaper foreign goods
Retaliate in trade disputes
Raise revenue (less common today)
🧠 Why Traders Should Watch Tariffs:
Tariffs don’t just hit companies—they ripple through economies and currency markets. Here’s how:
📉 1. Currency Impact
Tariffs can lead to currency depreciation in the targeted country as trade volumes fall and foreign demand drops.
Example: When the U.S. imposed tariffs on China, the Yuan weakened to offset the blow.
📈 2. Inflation Pressure
Tariffs make imports more expensive, fueling inflation. Central banks may respond with rate hikes—which moves markets.
🌐 3. Risk Sentiment
Tariff wars increase global uncertainty = risk-off sentiment. Traders flee riskier currencies (like EMFX) for safe havens like the USD, CHF, or JPY.
🔄 4. Trade Balance Shifts
Tariffs can affect a country's trade balance, influencing long-term currency valuation.
💡 Trading Tip:
Watch for tariff announcements or trade tension headlines—they often precede volatility spikes in major pairs. Combine with sentiment tools and fundamentals for best results.

What Does Lump Sum Investing Mean for Investors and Traders?What Does Lump Sum Investing Mean for Investors and Traders?
Lump sum investing is when an investor or trader commits a significant amount of capital to the market in one go rather than spreading it over time. This approach is believed to provide strong long-term returns but also comes with risks, particularly in volatile markets. This article explores how lump sum investing works, why investors and traders use it, potential risks, and strategies to manage exposure in different market conditions.
What Is Lump Sum Investing?
Lump sum investing is when an investor puts a significant amount of capital into the market at once, rather than spreading it over time. This approach is common when someone receives a windfall—such as an inheritance, bonus, or proceeds from closing an effective position—and decides to invest the full amount immediately.
Unlike dollar-cost averaging (DCA), which involves dividing an investment into smaller, regular parts, lump sum investing seeks to maximise market exposure from day one. The key argument of investors is that markets tend to rise over time. By investing upfront, capital has more time to grow, rather than sitting on the sidelines waiting to be deployed.
Lump sum investing isn’t limited to equities. It applies across asset classes, including forex, commodities, and fixed income. A trader taking a large position in a currency pair based on a strong technical setup is, in effect, making a lump sum investment—allocating its capital at once rather than scaling in gradually.
Institutional investors also use lump sum strategies, particularly when allocating large amounts into funds or rebalancing portfolios. However, while this method is believed to have strong long-term potential, it exposes investors and traders to market volatility, making risk management a key consideration.
Why Some Investors and Traders Use Lump Sum Investing
Lump sum investing is often used because it puts capital to work immediately, giving it more time to grow. Historical market data supports this approach—studies, including research from Vanguard, have claimed that potential returns are higher in lump sum vs dollar-cost averaging in most market conditions. This is because markets tend to rise over the long term, and waiting to invest can mean missing out on early gains.
Long-term investors typically deploy lump sums when they have high conviction in an asset or when a large amount of capital becomes available. For example, a fund manager rebalancing a portfolio or an individual investing an inheritance may decide to allocate the full amount upfront rather than spreading it out.
In Trading
Traders use lump sum investing differently. While some may use an approach similar to dollar-cost averaging and scale into a position, most traders will deploy capital when they see a high-probability setup. For instance, instead of spreading 1% risk across several trades, they will typically open a position with the entire 1% all at once.
Institutional investors also use lump sum strategies when making block trades or adjusting asset allocations. For example, a pension fund investing in equities after a market downturn may deploy capital in one move to take advantage of lower prices.
However, investing a lump sum of money isn’t just about maximising potential returns—it also involves risk, particularly in volatile markets. The next section explores the potential downsides of this approach.
Potential Risks of Lump Sum Investing
Lump sum investing comes with risks—particularly in volatile markets. The decision to invest everything at once means full exposure from day one, which can work against investors if the market moves against them after deployment. Some key risks to consider include:
Market Timing Risk
Investing a lump sum relies on deploying capital at a single point in time, making it sensitive to short-term market fluctuations. If an investor enters at a peak—such as before the 2008 financial crisis or the early 2022 market downturn—they could face an immediate drawdown. While long-term investors may recover, traders working on shorter timeframes have less room to absorb losses.
Volatility and Psychological Impact
Markets rarely move in a straight line. Lump sum investments can see rapid swings in value, which can be difficult for some investors to handle. Seeing a portfolio drop sharply after investing can lead to emotional decisions, such as panic selling or deviating from an original strategy. Traders face a similar issue when entering a full position—sudden volatility can trigger stop losses or force them to exit prematurely.
Liquidity Risk
For traders, placing a large order in a low-liquidity market can result in slippage, where the trade executes at a worse price than expected. This is especially relevant in forex, small-cap stocks, and commodities with lower trading volume.
How Lump Sum Investing Performs in Different Market Conditions
Market conditions play a major role in how lump sum investing performs. While historical data suggests it often outperforms spreading investments over time, short-term results can vary significantly depending on the broader trend.
Bull Markets
Lump sum investing tends to perform well in sustained uptrends. Since markets generally rise over time, deploying capital early allows one to take advantage of long-term growth. Research from Vanguard found that in about 68% of historical periods, lump sum investing outperformed dollar-cost averaging because assets had more time in the market. A strong bull market—like the one from 2009 to 2021—allowed lump sum investors to see considerable gains over time.
Bear Markets
Investing a lump sum just before a downturn exposes capital to immediate losses. For instance, an investor who entered the market in late 2007 would have faced steep drawdowns during the 2008 crash. Recovery took years, depending on the assets involved.
Although CFD traders can trade in rising and falling markets, the main challenge is to determine a trend reversal and avoid taking a full position just before it happens.
Sideways Markets
When prices move within a range without a clear trend, lump sum investing can be less effective. Investors may see stagnant returns if an asset moves sideways for extended periods, such as during the early 2000s. Traders in choppy markets often break positions into multiple entries to manage risk, rather than committing full capital at once.
Strategies to Potentially Reduce Risk with Lump Sum Investing
Lump sum investing involves full market exposure from the start, which means risk management plays a key role in avoiding unnecessary drawdowns. Understanding how to invest a lump sum of money wisely can help investors and traders potentially manage downside risks.
Assess Market Conditions
Deploying capital blindly can lead to poor outcomes. Investors often analyse valuations, interest rate trends, and macroeconomic factors before making large allocations. For traders, technical indicators such as support and resistance levels, moving averages, and momentum indicators help assess whether market conditions favour a full-position entry.
Diversification Across Assets and Sectors
One key concept in understanding how to invest a lump sum is diversification. Since allocating a lump sum to a single asset increases exposure to its price movements, some investors spread capital across multiple stocks, asset classes, or geographies to reduce concentration risk. A lump sum investment split between equities, bonds, and commodities can smooth out volatility, particularly in uncertain markets.
Hedging Strategies
Once they’ve decided what to do with a lump sum of money, some investors and traders hedge their positions. Opening opposite positions in correlated assets, trading stock pairs, or diversifying exposure across sectors in index trading can act as protection against downside moves, particularly in uncertain or high-volatility environments.
Position Sizing Adjustments
Traders concerned about volatility sometimes split a lump sum trade into staggered entries, adjusting size based on price action. This approach provides flexibility if market conditions shift unexpectedly.
The Bottom Line
Lump sum investing is a popular strategy among investors and traders, offering full market exposure from the start. While it has its advantages, managing risk is crucial, especially in volatile conditions.
FAQ
What Is Lump Sum Investment?
Lump sum investment is when an investor places a large amount of capital into an asset or market all at once instead of spreading purchases over time. This approach is common after receiving an inheritance, bonus, or proceeds from an asset sale. It provides immediate market exposure, which can be advantageous in rising markets but also increases the risk of short-term volatility.
What Is a Lump Sum Trading Strategy?
A lump sum trading strategy entails entering a trade with the entire position size in a single transaction, rather than gradually scaling in. Traders often use this approach when they have strong convictions in a setup. While it maximises potential returns if the market moves favourably, it also increases exposure to short-term price swings.
Is It Better to Invest Lump Sum or DCA?
Lump sum investing has historically outperformed dollar-cost averaging (DCA) in most market conditions because capital is exposed to growth sooner. However, DCA helps manage timing risk by spreading capital over time, making it a common choice for investors concerned about short-term market fluctuations.
What Are the Disadvantages of Lump Sum Investing?
The main risk is market timing—investing at a peak can lead to immediate losses. Lump sum investors also face higher short-term volatility, which can be psychologically challenging. In low-liquidity markets, executing large trades at once may lead to slippage, affecting execution prices.
This article represents the opinion of the Companies operating under the FXOpen brand only. It is not to be construed as an offer, solicitation, or recommendation with respect to products and services provided by the Companies operating under the FXOpen brand, nor is it to be considered financial advice.

Bitcoin vs. Saylor: The Power and Danger of fanatical promotionToday I want to talk about Michael Saylor and his influence on many crypto minds and, to some extent, the movement of Bitcoin’s price.
It’s very important to understand who we’re listening to, who we’re following, and whether this person has hidden motives we don’t see due to lack of information or unwillingness to get it — due to our stubborn desire to see only what confirms our own fantasies and thoughts and serves our expectations.
Let’s turn on our reason and objectivity and face the facts.
Michael Saylor is a well-known figure in the crypto world. He promotes the idea of eternal Bitcoin growth and actively buys it to support his words. When the price drops, he even suggests his readers sell their organs, which, to me, is too much.
Let’s move to the facts — everything is Googleable, and promptable.
Facts:
📈 Hype of 2000
In 2000, he rode the dot-com hype with his company MicroStrategy. MicroStrategy was promoted as a pioneer in business analytics and data management software, and he saw himself solely as a visionary of the new economy.
The boom was sky-high — just read about the dot-com era. Stocks of new tech companies were soaring, and it was enough to say “software” and “I see the future.”
In 1998, MicroStrategy successfully held an IPO. In 2000, at the peak of the dot-com boom, the company’s stock reached an incredible $333 per share in March.
He skillfully used the hype, and here was his 2000 narrative:
Digital transformation: Saylor claimed the world was entering a new era where data would become the main asset of companies, and MicroStrategy — the key tool for processing and analyzing it.
Unlimited growth: In the dot-com era, Saylor pushed the idea that tech companies like MicroStrategy would grow exponentially, ignoring traditional financial constraints.
The future is now: Saylor created the feeling that MicroStrategy wasn’t just following trends but shaping them, offering solutions that would define the future of business.
At the same time, he was building a cult around himself, cultivating the image of a genius entrepreneur.
⚠️ Financial reporting scandal
The U.S. Securities and Exchange Commission (SEC) launched an investigation into MicroStrategy. The company overstated revenues, which led to a stock crash (from $333 to $86 in one day) and a loss of investor trust. The stock kept falling and dropped to $0.4 (–100%!).
The SEC filed charges against Michael Saylor personally (CEO), as well as CFO Mark Lynch and the chief accountant. They were accused of intentionally misrepresenting financials to keep stock prices high.
SEC investigation results:
In December 2000, the SEC concluded the investigation, and MicroStrategy agreed to settle without admitting guilt:
* The company paid a $10M fine.
* Saylor, Lynch, and other executives paid personal fines.
* Saylor agreed to pay $8.28M in “disgorgement” (unjust enrichment) and a $350K fine — a total of about $8.63M.
* MicroStrategy committed to revising its reporting and implementing stricter internal controls.
In addition to the SEC settlement ($11M from leadership, including $8.63M from Saylor), MicroStrategy faced shareholder class-action lawsuits, which were settled for $10M.
No executives were criminally charged, but the company’s and Saylor’s reputations suffered greatly.
In other words, Michael didn’t have any moral hesitation about faking company profits during losses. But investors and journalists started asking questions — and the SEC came knocking.
Let’s call it what it is: Saylor committed fraud, using hype, promising endless growth, and creating a cult around himself as a “financial genius and visionary.”
Michael went quiet, and the media tone shifted quickly — from super-visionary to one of the biggest losers and scammers.
To give him credit, he managed to keep the company alive and kept a low profile until 2020, like a mouse. 20 years — a generation change and a new hype cycle.
And what does a tech visionary do? Of course — jump into the new wave. A chance to restore his image — probably more important to him than money.
🟠 Bitcoin Era, 2020
Before 2020, Saylor was a Bitcoin skeptic. In 2013, he even tweeted that “Bitcoin’s days are numbered” and compared it to gambling.
But in 2020, he changed his position after deeply studying crypto. His mission: to protect capital and restore his image as a prophet — and he decided to buy Bitcoin.
But his own money seemed insufficient, so he turned to borrowing.
Here’s how the scheme works:
1.MicroStrategy issues stocks and bonds
📈 They sell new MSTR shares → get cash.
💵 They issue bonds (debt papers) → investors give them money at interest.
2. They use that money to buy Bitcoin
🟧 All the raised funds go into BTC purchases.
They don’t sell. Just hold. Never lock in profit.
3. If BTC rises → MSTR stock price rises
MSTR becomes a kind of "BTC ETF."
📊 BTC growth = MicroStrategy’s market cap growth.
🔁 Then they repeat the cycle.
Stock price up → issue more shares/bonds → buy more BTC → repeat.
📌 The catch:
They use other people’s money (debt) to buy BTC.
They sell almost nothing.
They bet BTC will grow faster than interest on the debt.
So as long as the price goes up — everything is fine.
Let’s admit: his fanaticism, aggressive marketing, and bold statements have helped Bitcoin.
But the main question: will the inevitable market correction wipe out this belief in endless growth?
🔍 His personality
It’s crucial for us as traders and investors to understand who really runs the company or project. The personal traits of leaders are useful information that gives us insight and a behavioral map.
We need to research not only products and financials, but also the psychological types of those making the decisions.
Saylor’s aggressive marketing and loud statements are part of his personality.
He fed off the hype around his persona more than any growing bank balance.
And there’s nothing wrong with that — until you start deceiving people to keep attention on yourself.
For example, in the 2000s, *Forbes* noted that Saylor “sold the dream” of a new economy where traditional profit metrics didn’t matter.
It attracted investors — but didn’t reflect reality. Forbes hinted that his desire to maintain the genius image may have led to accounting manipulation.
Saylor created an "expectations bubble" that burst.
His desire to prove he’s a genius led to a disconnection from reality.
He often talks about himself as a genius and visionary (sounds like a grandiose ego).
He positions himself as the savior of capital through BTC (messiah complex).
He publicly mocks “weak hands” and traditional investors (shows superiority).
He never admits mistakes, even after losing billions (denial and overconfidence).
He repeats his ideas again and again (manic fixation on being right).
His speech is like a manifesto, not a dialogue. He doesn’t converse — he proclaims.
I don’t sense greed in him. I sense emptiness that demands a cult.
He doesn’t live for money — he is obsessed with the idea.
And that’s the problem — there’s no objectivity here. It feels more like revenge after the humiliation and downfall of 20 years ago.
He’s smart — no doubt. But it’s not just intelligence. It’s cold messianism.
Obsession, not passion.
Psychotype: Grand strategist with a humiliation trauma
Trait Behavior
Narcissistic core “I’m special, my vision is above all.”
Obsession with greatness “I must be the truth, not just be right.”
Hyper-rationality “I survive through logic, not feelings.”
Psychological armor “I won’t show weakness. If I break, I disappear.”
Fanatical visionary “My idea is supreme. I don’t need to be humble.”
💸 More facts:
In 2024, Michael paid a FWB:40M fine for tax evasion.
The accusation:
He didn’t pay income tax in D.C., while actively living there — yachts, property, planes, frequent visits.
His tax returns didn’t reflect reality, and the investigation used GPS, Instagram, flight data, banking, and other digital traces.
Saylor didn’t admit guilt but agreed to settle for around $40M.
His personal wealth is mostly in MicroStrategy shares (9.9% or ~$8.74B by end of 2024).
Theoretically, he can sell them — but he must file a report within two days.
Current status:
MicroStrategy owns 555,450 BTC
Average purchase price: ~$68,550
Total purchase cost: ~$38.08B
Unrealized profit: ~$14.7B
And remember — Saylor’s slogan: Forever HODL.
📉 But the key point:
The company’s current debt is $7.24B.
All is good — as long as the price rises.
Analysts estimate BTC would have to fall to ~$20K before MSTR is forced to liquidate.
But if BTC nears the break-even zone, fear might hit shareholders first — triggering stock sell-offs.
If MSTR shares fall — which is likely during a BTC crash — bondholders, especially those with convertible bonds (which make up most of the debt), might demand repayment.
That could force Saylor to sell BTC.
Because in a crypto winter, buyers for MSTR stock or bonds may disappear.
So BTC could fall — not because of actual sales, but from fear of those sales.
This is my main concern with Saylor’s oversized influence on the market.
🐍 A bit of “reptilian” theory
What if BlackRock *planned* to use Saylor’s hands to push Bitcoin and concentrate large amounts in one basket — then take it from him?
Among the main bondholders are big institutions:
* Allianz Global Investors
* Voya Investment Management
* Calamos Investments
* State Street
These bonds are usually unsecured and non-convertible, making them attractive to investors who want Bitcoin exposure without direct ownership.
In case of default, bondholders have priority over the company’s assets — including BTC reserves.
🏛 State Street Corporation
Public company traded on NYSE.
Its biggest shareholders: Vanguard Group and BlackRock .
If so — they could end up holding as much BTC as Satoshi.
BlackRock’s IBIT holds ~500K BTC.
MicroStrategy holds ~500K BTC.
🤔 Questions to reflect on:
* Is industry leader fanaticism good for the development of crypto?
* What is Michael Saylor really doing? Avenging the past? Or truly in love with the technology?
* What risks does a whale with media influence and fanaticism and pockets full of Bitcoin and debt pose to the market?
Waiting for your thoughts in the comments, dear traders! Hugs! 🤗

one of the most underrated charts : M2(money supply)When it comes to forex and macro trading, it's easy to get lost in charts, indicators, and economic calendars. But one of the most overlooked—and incredibly powerful—macro indicators is the M2 Money Supply. In this post, we’ll break down what M2 really is, why it matters, and how traders like you can use it to get an edge.
💰 What Is M2 Money Supply?
M2 represents the total amount of money in circulation in an economy, including:
M1 (physical cash + checking deposits)
Savings deposits
Money market securities
Time deposits (under $100,000)
In simple terms: M2 tracks how much money is sloshing around in the system.
🧠 Why Traders Should Care About M2
When M2 goes up significantly, it often signals that a central bank is easing monetary policy—i.e., printing more money, keeping interest rates low, or using QE (quantitative easing). Conversely, when M2 contracts or slows, it suggests tightening, and could signal reduced liquidity, higher rates, or a slower economy.
M2 = Macro Liquidity Meter
And liquidity drives markets—especially currencies.
⚙️ How to Use M2 in Your Trading Strategy
Here are 3 ways you can incorporate M2 into your macro trading toolkit:
1. Gauge Inflation & Currency Value
When a country expands its money supply rapidly (like the U.S. did during COVID), the purchasing power of its currency often declines, especially against currencies with tighter monetary policy.
✅ Watch for divergences: If M2 is growing fast in one country and flat in another, that’s a potential FX opportunity.
📉 Example: USD weakened sharply post-COVID when M2 surged.
2. Confirm Trends in Interest Rates
M2 often leads or confirms central bank policy.
Shrinking M2 → Tighter conditions → Rising rates → Currency bullish
Expanding M2 → Easier policy → Lower rates → Currency bearish
Use it alongside yield curve analysis and central bank projections.
3. Identify Risk-On/Risk-Off Regimes
A rising M2 usually supports risk assets like equities and EM currencies. Falling M2 can trigger liquidity squeezes, flight to safety, and stronger demand for USD or JPY.
Use M2 as a macro filter for your risk appetite.
Watch for turning points in M2 to anticipate market regime shifts.
🔎 How to Track M2 on @TradingView
Open a new chart and search for:
🔍 FRED:M2SL – U.S. M2 Money Stock (seasonally adjusted)
You can also compare this against:
DXY (US Dollar Index)
USDJPY, EURUSD, or other major FX pairs
U.S. 10-Year Yields (US10Y) or Fed Funds Rate (FEDFUNDS)
Add M2 as an overlay or sub-chart for macro context.
Use the "Compare" tool to visualize divergences with currency pairs.
📌 Final Thoughts
M2 might not give you minute-by-minute trade signals like an RSI or MACD, but it offers something far more powerful: macro context. When used with other indicators, it can help traders:
Anticipate currency trends
Understand shifts in monetary policy
Position for regime changes in risk appetite
Remember: the smartest traders aren’t just charting price—they’re charting liquidity. And M2 is the ultimate liquidity map.
put together by : @currencynerd

Tim's Fundamental View LayoutHere is the way that I view any stock for an initial analysis to get an idea of what the market is valuing and viewing the company.
I first look at the free cash flow, so that is directly under the price chart. Free cash flow is the life-blood of the company and can be used to pay dividends and to reinvest in the company to grow the top line or to buy back stock.
Next I look at the PSR or Price-To-Sales-Ratio. This ratio is paramount for me since the top line shows up first for companies and is the starting point for analysis. Companies with low or no sales growth get priced very differently from companies with high growth. Start with sales growth in your analysis. There are many great books on the topic written by Kenneth L. Fisher, the creator of the tool.
Next "Avg Basic Shares Outstanding" to see if the company is constantly diluting investors and raising capital or hiding expenses by giving out stock options each year. Old companies in slow growth industries tend to buy back stock and growth companies grow shares outstanding and is a strong headwind for investors.
Next is "Long Term Debt"... which is another extremely important variable to look at with any company. In the long run, debt is the cheapest capital since you can pay it off cheaply but it can also drag down a company when the future is uncertain and unpredictable. Companies with predictable sales and growth often load up on debt which enhances returns for equity owners, but increases the risk long term. Jet Blue NASDAQ:JBLU is case in point for this as in 2000 before the pandemic it had a $5 billion market cap with $1 billion in debt and now it has over $8 billion in debt and the market cap is down to $1.5 billion. It is very difficult to get out from under such a heavy debt load. Debt can be "death" for any company if overused.
Next is "Revenue" graphed annually. Essential to see if inflation impacts sales growth or if it can't keep up with inflation. The last 5 years was between 20%-50% inflation depending on the industry so if a company doesn't have higher revenues by at least 20% since 2019, then this reveals a weakness in their pricing power which is a very competitive market with likely declining or low margins.
Last is "Market Cap". It is always good to know the market capitalization of any stock that you own. It is the foundation for understanding if any investor would ever want to buy the whole company and what would it cost to buy it and what are the "returns" from owning the whole company.
I hope you can copy this layout for your own so you too can have a one-page view of the history of a company to help you get your mind around its valuation and potential along with understanding the risks all in one, easy picture.

Breadbasket Basics: Trading Wheat Futures🟡 1. Introduction
Wheat may be a breakfast-table staple, but for traders, it’s a globally sensitive asset — a commodity that reacts to geopolitics, climate patterns, and shifting demand from dozens of countries.
Despite its critical role in food security and its status as one of the most traded agricultural commodities, wheat is often overlooked by traders who focus on corn or soybeans. Yet wheat offers a unique combination of liquidity, volatility, and macro sensitivity that makes it highly attractive for both hedgers and speculators.
If you’re new to trading wheat, this guide gives you a solid foundation: how the wheat market works, who the key players are, and what makes wheat such a dynamic futures product.
🌍 2. Types of Wheat and Where It Grows
One of the first things traders need to understand is that wheat is not a single, uniform product. It’s a diverse group of grain types, each with its own characteristics, end uses, and pricing dynamics.
The major classes of wheat include:
Hard Red Winter (HRW): High-protein wheat grown in the central U.S. — used in bread and baking.
Soft Red Winter (SRW): Lower protein, used for pastries and crackers.
Hard Red Spring (HRS): Grown in the Northern Plains; prized for high gluten content.
Durum Wheat: Used for pasta, grown mainly in North Dakota and Canada.
White Wheat: Grown in the Pacific Northwest; used for noodles and cereals.
Each class responds differently to weather, demand, and regional risks — giving traders multiple ways to diversify or hedge.
Major global producers include:
United States
Russia
Canada
Ukraine
European Union
Australia
India
These regions experience different planting and harvesting calendars — and their weather cycles are often out of sync. This creates trading opportunities year-round.
🛠️ 3. CME Group Wheat Contracts
Wheat futures are traded on the Chicago Board of Trade (CBOT), part of the CME Group.
Here are the two key contracts:
o Standard Wheat
Ticker: ZW
Size = 5,000 bushels
Tick = 0.0025 = $12.50
Margin = ~$1,750
o Micro Wheat
Ticker: MZW
Size = 500 bushels
Tick = 0.0050 = $2.50
Margin = ~$175
Keep in mind that margins are subject to change — always confirm with your broker. Micro contracts are ideal for scaling in/out of trades or learning market structure without large capital risk.
📅 4. Wheat’s Seasonality and Supply Chain
Unlike corn or soybeans, wheat is planted and harvested across multiple seasons depending on the variety and geography.
In the U.S., winter wheat (HRW and SRW) is planted in the fall (September–November) and harvested in early summer (May–July). Spring wheat (HRS) is planted in spring (April–May) and harvested late summer.
Globally, things get even more staggered:
Australia’s wheat is harvested in November–December
Ukraine and Russia harvest in June–August
Argentina’s crop comes off the fields in December–January
This scattered global schedule means news headlines about one country’s weather or war (think Ukraine in 2022) can quickly shift sentiment across the entire futures curve.
📈 5. Who Trades Wheat and Why
Wheat is traded by a wide range of participants — each with their own objectives and strategies. Understanding their behavior can give you an edge in anticipating market moves.
Commercial hedgers:
Farmers lock in prices to protect against adverse weather or market crashes.
Grain elevators and exporters use futures to manage inventory risk.
Flour mills hedge their input costs to protect profit margins.
Speculators:
Hedge funds and CTAs trade wheat based on global macro trends, weather anomalies, or technical setups.
Retail traders increasingly use micro contracts to gain exposure to agricultural markets with lower capital risk.
Spread traders bet on pricing differences between wheat classes or harvest years.
🔍 For retail traders especially, micro contracts like XW open the door to professional markets without oversized exposure.
🧠 6. What Makes Wheat Unique in Futures Markets
Wheat is often considered the most geopolitically sensitive of the major grains. Here’s why:
Price can spike fast — even on rumor alone (e.g., export bans or missile strikes near ports).
Production risks are global — the market reacts not just to the U.S. crop, but to conditions in Russia, Ukraine, and Australia.
Storage and quality matter — protein levels and moisture content affect milling demand.
Unlike corn, wheat doesn’t have a single dominant industrial use (like ethanol). This means food demand is king, and food security often drives policy decisions that affect futures pricing.
📌 7. Summary / Takeaway
Wheat may not get as much media attention as corn or soybeans, but it’s a deeply important — and deeply tradable — market. Its global footprint, class differences, and sensitivity to weather and politics make it a must-know for serious agricultural futures traders.
Whether you're just starting out or looking to diversify your trading playbook, understanding wheat is an essential step. Learn its rhythms, follow its news, and respect the fact that every crop cycle brings a new story to the market.
🧭 This article is part of an ongoing educational series exploring futures trading in agricultural commodities.
📅 Watch for the next release: “Soybeans: The Global Protein Powerhouse.”
When charting futures, the data provided could be delayed. Traders working with the ticker symbols discussed in this idea may prefer to use CME Group real-time data plan on TradingView: www.tradingview.com - This consideration is particularly important for shorter-term traders, whereas it may be less critical for those focused on longer-term trading strategies.
General Disclaimer:
The trade ideas presented herein are solely for illustrative purposes forming a part of a case study intended to demonstrate key principles in risk management within the context of the specific market scenarios discussed. These ideas are not to be interpreted as investment recommendations or financial advice. They do not endorse or promote any specific trading strategies, financial products, or services. The information provided is based on data believed to be reliable; however, its accuracy or completeness cannot be guaranteed. Trading in financial markets involves risks, including the potential loss of principal. Each individual should conduct their own research and consult with professional financial advisors before making any investment decisions. The author or publisher of this content bears no responsibility for any actions taken based on the information provided or for any resultant financial or other losses.

Ratio Charts in TradingView and IAAbove you can see the Bitcoin to Ethereum ratio chart. Ratio analysis between two or more symbols is a critical method for comparing the strength and weakness of assets relative to each other. TradingView offers basic capabilities for this task, but with the help of artificial intelligence (AI) and custom scripts, much more advanced and creative analyses can be conducted.
Here are some practical ideas:
1. Creating Conditional Ratio Scripts
2. Comparing Relative Averages and Issuing Smart Signals
3. Calculating Composite Ratios of Multiple Assets
4. Smart Alerts Based on Price Pattern Breakouts
For more information, search Google for "How to Use Ratio Charts in TradingView: A Hidden Gem for Traders."

The Golden Grain: Trading Corn in Global Markets🟡 1. Introduction
Corn isn’t just something you eat off the cob at a summer barbecue — it’s one of the most widely traded agricultural commodities in the world. Behind every kernel lies a powerful story of food security, global trade, biofuels, and speculative capital.
Whether you’re a farmer managing risk, a trader chasing macro trends, or simply curious about how weather affects global prices, corn futures sit at the crossroads of agriculture and finance. In this article, we’ll explore what makes corn a global economic driver, how it behaves as a futures product, and what traders need to know to approach the corn market intelligently.
🌎 2. Where Corn Grows: Global Powerhouses
Corn is cultivated on every continent except Antarctica, but a handful of countries dominate production and exports.
United States – By far the largest producer and exporter. The “Corn Belt” — spanning Iowa, Illinois, Indiana, Nebraska, and parts of Ohio and Missouri — produces the majority of U.S. corn. U.S. exports also set global benchmarks for pricing.
Brazil & Argentina – These two South American powerhouses are crucial to the global corn supply, especially during the Northern Hemisphere’s off-season.
China – Though a top producer, China consumes most of its own supply and has become a key importer during deficit years.
Corn is typically planted in the U.S. between late April and early June and harvested from September through November. In Brazil, two crops per year are common — including the important safrinha (second crop), harvested mid-year.
Understanding where and when corn is grown is vital. Weather disruptions in any of these regions can ripple through the futures market within hours — or even minutes.
💹 3. Corn as a Futures Market Power Player
Corn is one of the most liquid agricultural futures markets in the world, traded primarily on the CME Group’s CBOT (Chicago Board of Trade). It attracts a diverse set of participants:
Producers and Commercials: Farmers, ethanol refiners, and food manufacturers use corn futures to hedge price risk.
Speculators and Funds: Hedge funds and retail traders speculate on corn price direction, volatility, and seasonal patterns.
Arbitrageurs and Spreads: Traders bet on relative price differences between contracts (e.g., old crop vs. new crop spreads).
The deep liquidity and relatively low tick size make corn accessible, but its price is highly sensitive to weather, government reports (like WASDE), and international trade policies.
🏗️ 4. CME Group Corn Futures: What You Can Trade
The CME Group offers both standard and micro-sized contracts for corn. Here’s a quick overview:
o Standard Corn
Ticker: ZC
Size = 5,000 bushels
Tick = 0.0025 = $12.50
Margin = ~$1,050
o Micro Corn
Ticker: XC
Size = 1,000 bushels
Tick = 0.0050 = $2.50
Margin = ~$105
⚠️ Always confirm margin requirements with your broker. They change with market volatility and exchange updates.
The availability of micro corn contracts has opened the door for smaller traders to manage risk or test strategies without over-leveraging.
📊 5. Historical Price Behavior & Seasonality
Corn is deeply seasonal — and so is its price action.
During planting season (April–May), traders watch weekly USDA crop progress reports and early weather forecasts like hawks. A wet spring can delay planting, leading to tighter supply expectations and early price spikes.
Then comes pollination (July) — the most critical stage. This is when heatwaves or drought can do serious damage to yield potential. If temperatures are unusually high or rainfall is scarce during this window, markets often react with urgency, bidding up futures prices in anticipation of reduced output.
By harvest (September–November), prices often stabilize — especially if production matches expectations. But early frost, wind storms, or excessive rain during harvest can still trigger sharp volatility.
Many experienced traders overlay weather models, soil moisture maps, and historical USDA data to anticipate season-driven price shifts.
Even international factors play a role. For example, when Brazil’s safrinha crop suffers a drought, global corn supply tightens — impacting CME prices even though the crop is thousands of miles away.
🧠 6. What Every New Trader Should Know
If you’re new to corn trading, here are some key principles:
Watch the Weather: It’s not optional. Daily forecasts, drought monitors, and precipitation anomalies can move markets. NOAA, Open-Meteo, and private ag weather services are your friends.
Know the Reports: The WASDE report (World Agricultural Supply and Demand Estimates), USDA Crop Progress, and Prospective Plantings reports can shake up pricing more than you might expect — even if changes seem small.
Mind the Time of Year: Seasonality affects liquidity, volatility, and trader behavior. March–August tends to be the most active period.
Understand Global Demand: The U.S. exports a huge portion of its crop — with China, Mexico, and Japan as major buyers. A tariff tweak or surprise Chinese cancellation can cause wild price swings.
🛠️ Good corn trading is 50% strategy, 50% meteorology.
🧭 This article is part of a broader educational series exploring the relationship between agricultural commodities and weather patterns. In the upcoming pieces, we’ll dive deeper into how temperature and precipitation affect corn, wheat, and soybeans — with real data, charts, and trading insights.
📅 Watch for the next release: “Breadbasket Basics: Trading Wheat Futures.”
When charting futures, the data provided could be delayed. Traders working with the ticker symbols discussed in this idea may prefer to use CME Group real-time data plan on TradingView: www.tradingview.com - This consideration is particularly important for shorter-term traders, whereas it may be less critical for those focused on longer-term trading strategies.
General Disclaimer:
The trade ideas presented herein are solely for illustrative purposes forming a part of a case study intended to demonstrate key principles in risk management within the context of the specific market scenarios discussed. These ideas are not to be interpreted as investment recommendations or financial advice. They do not endorse or promote any specific trading strategies, financial products, or services. The information provided is based on data believed to be reliable; however, its accuracy or completeness cannot be guaranteed. Trading in financial markets involves risks, including the potential loss of principal. Each individual should conduct their own research and consult with professional financial advisors before making any investment decisions. The author or publisher of this content bears no responsibility for any actions taken based on the information provided or for any resultant financial or other losses.

What Is Dollar-Cost Averaging (DCA) in Investing and Trading?What Is Dollar-Cost Averaging (DCA) in Investing and Trading?
Dollar-cost averaging (DCA) is a popular strategy used by investors and traders to manage market fluctuations and build positions over time. Instead of trying to time the market, DCA focuses on consistent, regular investments regardless of price movements. This article answers “What is DCA?”, its advantages and limitations, and how it can be applied in both investing and trading.
What Is Dollar-Cost Averaging (DCA)?
So what is DCA investing? Dollar-cost averaging (DCA) is a strategy that involves consistently investing a fixed sum at regular intervals, regardless of the asset’s current price. This approach helps distribute the cost of purchases over time, potentially reducing the impact of short-term price fluctuations. Instead of trying to time the market perfectly—a challenging task even for experienced traders—a dollar-cost averaging strategy focuses on regular contributions to average the cost of assets.
This method offers a straightforward, disciplined strategy for both long-term investors and traders who wish to build or adjust positions gradually. By spreading out purchases, a DCA strategy may help mitigate the effects of market volatility. For example, during a period of market decline, the fixed investment buys more units at a lower cost, which could result in higher returns when prices recover. Conversely, during a sustained rise, the investor buys fewer units, which helps avoid overexposure. For example, if you invest $50 every week and the market is rising, you will buy fewer stocks, but when the market is moving down, you will buy more with the same amount.
What does DCA mean for market participants? DCA is particularly useful in uncertain economic environments where price swings are common. It provides a systematic approach to entering the market, removing the need to make snap decisions based on short-term market movements, and fostering a steady accumulation of assets over time.
How Does DCA Work?
DCA investing operates by establishing a regular schedule for investing a set amount of money into a chosen asset, regardless of its current market price. Instead of waiting for a particular price or market condition, funds are allocated at consistent intervals—be it weekly, monthly, or quarterly. Over time, this means buying more units when prices are lower and fewer units when prices are higher, resulting in an average purchase price that can be lower than if the investment was made in one lump sum.
Consider an investor using DCA. They commit £100 every month to buy company shares. In the first month, the share price is £20, so they purchase 5 shares. The next month, the price drops to £10, allowing them to buy 10 shares with the same £100. In the third month, the price rises to £25, and they purchase 4 shares.
Over three months, the investor has spent £300 and acquired 19 shares in total. To calculate the average cost per share, divide £300 by 19, which equals approximately £15.79 per share. This average is lower than the highest price paid and reflects the effect of buying more shares when prices are low and fewer when prices are high.
DCA also simplifies the process of entering the market. By adhering to a set timetable, investors bypass the need for constant market analysis, making it particularly appealing for those who prefer a more hands-off strategy. This systematic approach can be applied not only to traditional investments like shares and funds but also to other assets that traders and investors engage with.
DCA in Trading
DCA isn't just for long-term investors; traders can also employ it to navigate the ups and downs of fast-moving markets. By spreading out their entries or exits, traders may potentially lower the average cost of a position or build on a winning trend, all while managing their exposure to volatile moves.
Lowering the Average Price
For traders facing a position that's moving against them, DCA offers a way to adjust the average entry cost. By allocating additional funds, the average price of the position may be reduced. This approach can create a potential opportunity to exit with better returns if the market reverses. However, it is important to note that this method also increases exposure, and additional entities might compound losses if the trend continues.
Adding to a Winner
Conversely, traders may apply DCA to increase their positions when an asset shows strength. By gradually adding to an effective trade, the overall exposure is built in a controlled manner, potentially capturing further movement without committing all capital at once. This method is particularly popular in markets where momentum builds slowly, allowing traders to gradually take advantage of the sustained trend.
Applications Across Markets
Using DCA in stocks can help manage entries during periods of volatility, especially when market sentiment shifts rapidly. Forex traders often use similar techniques to adjust positions in response to fluctuating currency pairs, while the high volatility seen in crypto* markets makes DCA an appealing strategy for building positions gradually.
When using DCA in trading, a disciplined approach is essential. Whether lowering the average cost in a losing position or building on an effective trade, traders should carefully consider the additional risk that comes with increased exposure.
Advantages of Dollar-Cost Averaging
Dollar-cost averaging offers a range of advantages that make it an attractive strategy for both investors and traders, especially when navigating uncertain markets.
Mitigating Market Volatility
By investing a fixed amount at regular intervals, DCA spreads out exposure over time. This approach can reduce the impact of sudden market swings. Instead of being affected by a one-off high price, the average cost is spread across different market conditions. This may help stabilise entry points and smooth out short-term volatility.
Disciplined Investment Approach
DCA promotes a structured investment routine. With regular contributions, there is less temptation to try timing the market. This disciplined approach might be particularly useful when markets are highly volatile or ahead of news and economic events. It encourages systematic investing, reducing the likelihood of making impulsive decisions driven by market noise.
Accessibility for All Traders
DCA does not require intricate market analysis or deep expertise in market timing. Its straightforward nature makes it appealing to both newcomers and seasoned traders looking for a simpler method to build positions over time. By providing a clear framework, DCA allows traders to focus on long-term goals without the pressure of constant market monitoring.
Limitations of Dollar-Cost Averaging
While dollar-cost averaging offers a structured approach to investing and trading, there are some limitations to consider.
Potential Opportunity Cost
Spreading out investments means funds are gradually deployed over time. In a market that is consistent, waiting to invest might lead to missed returns compared to committing all funds upfront. This method can reduce the impact of volatility but might underperform during extended trends.
Continued Exposure to Market Trends
Investors remain exposed to the market throughout the investment period. If the market experiences a prolonged trend, regular investments will accumulate at better prices, but overall returns may still suffer. This approach does not eliminate market risk and requires a long-term perspective to potentially see a turnaround.
Dependence on Consistency
The effectiveness of dollar-cost averaging relies heavily on maintaining a consistent investment schedule. Any interruption or inconsistency can dilute the intended advantages of the strategy. It also assumes that investors are able to commit regular funds, which may not be feasible in all financial situations.
Comparing DCA to Lump-Sum Investing
Comparing DCA to lump-sum investing offers insights into different approaches to managing market exposure and returns.
Risk Exposure
Lump-sum investing involves placing all available funds into an asset at once. This method can yield higher returns if the market moves in their favour, but it also exposes the investor to immediate risk if the market moves against them. In contrast, risk is spread over time through a dollar-cost average, meaning regular investments reduce the likelihood of entering the market at a high point and potentially lowering the overall average cost.
Market Conditions
The performance of each approach can vary depending on market trends. In steady trends, lump-sum investing may capture more returns since all funds are deployed early. However, in volatile or declining conditions, DCA could mitigate the effects of short-term fluctuations by smoothing out entry prices over time.
Flexibility and Commitment
Lump-sum investing requires confidence and a readiness to commit all funds immediately. DCA, on the other hand, offers a more measured entry into the market. This method is popular among those who prefer a systematic approach and might not have a large sum available at one time.
The Bottom Line
Understanding the dollar-cost averaging definition can help investors and traders potentially manage market volatility and reduce emotional decision-making. While it has its limitations, DCA can be an effective strategy for building positions over time.
FAQ
What Is an Example of Dollar-Cost Averaging?
Imagine investing £100 into a stock every month, regardless of its price. In January, the stock costs £20, so you buy five shares. In February, the price drops to £10, allowing you to buy 10 shares. In March, the price rises to £25, and you buy four shares. Over three months, you’ve invested £300 and purchased 19 shares, averaging out your cost per share to £15.79.
Is There the Best Dollar-Cost Averaging Strategy?
The most effective DCA strategy depends on individual goals. A consistent, long-term approach with regular investments—whether weekly or monthly—may help smooth out market volatility. Focusing on diversified assets could also reduce risk exposure.
What Is the Daily DCA Strategy?
This strategy involves investing a fixed amount every day through DCA, meaning it may help minimise the impact of short-term price fluctuations in volatile markets. However, it requires careful planning due to frequent transactions and potential fees.
Does Dollar-Cost Averaging Work With Stocks?
Yes, DCA is commonly used with stocks. It may help manage the effects of market volatility, allowing investors to build positions over time without worrying about short-term price swings.
What Does DCA Mean in Stocks?
DCA, or dollar-cost averaging, in stocks, means regularly investing a fixed amount, regardless of price, to average out the cost per share over time and manage market volatility. A similar answer is true for “What does DCA mean in crypto*?”, except it would involve a regular fixed investment in a particular cryptocurrency*.
How to Calculate DCA in Crypto* Investing?
There is a simple formula to calculate DCA, meaning in crypto*, an investor would just divide the total amount invested by the total number of units purchased. This provides the average cost per unit over time, regardless of price fluctuations.
*Important: At FXOpen UK, Cryptocurrency trading via CFDs is only available to our Professional clients. They are not available for trading by Retail clients. To find out more information about how this may affect you, please get in touch with our team.
This article represents the opinion of the Companies operating under the FXOpen brand only. It is not to be construed as an offer, solicitation, or recommendation with respect to products and services provided by the Companies operating under the FXOpen brand, nor is it to be considered financial advice.

Mastering Stop Losses: How Not to Trigger Them at the Worst TimeThere are few things more humiliating in trading than setting a stop loss… only to have the market tag it by a hair’s breadth before rocketing in the direction you knew it was going to go.
Oftentimes (hopefully not too often), stop losses are the financial equivalent of slipping on a banana peel you placed yourself.
But stop losses aren't the enemy. Their placement, however, could be.
If you’ve ever rage-quit your chart after being wicked out by a fakeout, this one’s for you. Let’s talk about how to master stop losses — without feeling like the market is personally out to get you.
😬 The Necessary Evil: Why Stop Losses Exist
First, let's acknowledge the elephant in the room: stop losses sometimes sting. They're like smoke alarms. Annoying when they chirp over burnt toast, lifesaving when there’s an actual fire.
The purpose of a stop loss isn’t to predict exactly when you’re wrong — it’s to limit how wrong you can be. It's the difference between losing a quick battle and losing the whole war.
Trading without a stop loss is like walking a tightrope without a net — all fine until it’s not.
🤔 The Amateur Mistake: "Where Should I Put My Stop?"
A lot of traders approach stop-loss placement like they're picking lottery numbers: random, emotional, hopeful.
"I’ll just slap it 10 pips below my entry. Seems safe."
But the market doesn’t care about your preferred round numbers. It cares about liquidity, volatility, and structure, regardless if it's the forex market , the crypto space , or the biggest stock gainers out there.
Good stop-loss placement is about logic, not luck. It's about asking:
Where is my trade idea invalidated?
Where does the market prove me wrong?
If you're placing stops based on how much you're "willing to lose" rather than where your setup breaks down, you’re setting yourself up to be triggered — emotionally and financially.
💪 The Art of "Strategic Suffering"
Good stops hurt a little when they’re hit. That’s how you know they were placed properly.
Stops shouldn't be so tight they get hit on routine noise, but they also shouldn't be so far away that you need therapy if it fails. Think of it as strategic suffering: you’re accepting controlled pain now to avoid catastrophic pain later.
Legendary trader Paul Tudor Jones famously said: “The most important rule of trading is to play great defense, not great offense.”
🤓 Where Smart Traders Place Their Stops
Want to know where smart money hides their stops? It's not random. It’s calculated.
Below key swing lows for long trades (how much below depends on the risk-reward ratio they’ve chosen to pursue)
Above key swing highs for shorts (how much above is, again, tied to the risk-reward ratio)
Outside of obvious support/resistance zones (also, risk-reward plays a role)
In other words: start thinking like the market. Where would a big player have to exit because the structure is truly broken? That’s where you want your stop.
👀 Avoiding the Stop-Hunter’s Trap
Is stop-hunting real? Oh yes. And no, it’s not personal. You're just very readable if you park your stops in obvious, lazy places.
The market loves liquidity. Price often pokes below swing lows or above highs because that’s where the money is. Stops create liquidity pockets that big players exploit to enter their trades at better prices.
So how do you avoid becoming easy prey?
Give stops a little breathing room past obvious levels.
Use volatility measures like ATR to set dynamic buffers.
Respect structure, not just random dollar/pip amounts.
A good stop is hidden in plain sight but protected by logic, not hope.
⚖️ Sizing Smarter: Risk per Trade Matters More Than Stop Distance (What’s Risk-Reward Ratio?)
Here’s where many traders mess up: they think tighter stops are always better. Wrong. Your stop distance and your position size are a package deal. If your trade idea requires a wider stop to be valid, your position size should shrink accordingly.
Trying to cram your usual size into a wide stop setup is how small losses turn into account-threatening disasters.
Hedge fund pioneer George Soros once said: “It’s not whether you’re right or wrong that's important, but how much you make when you're right and how much you lose when you're wrong.”
Master your sizing relative to your stop, and you master your survival. In other words, the risk-reward ratio should be playing a key role in placing your stop losses.
🥤 Mental Stops vs Hard Stops: Pick Your Poison
Some traders swear by mental stops: “I'll get out when it hits this level.” Others use hard stops: set-and-forget protective orders baked into the system.
Both have pros and cons:
Mental stops allow flexibility but risk emotional sabotage.
Hard stops guarantee protection but can trigger on sudden, hollow wicks.
Pro tip? Use hard stops if you’re new or undisciplined. You don’t want to be the guy saying “I’ll close it soon...” while watching your unrealized loss grow a second head.
🤯 Stop-Loss Psychology: It’s You, Not the Market
If you find yourself constantly blaming “stop-hunting whales” or “market manipulation” every time you get tagged out... maybe it’s not them. Maybe it's your stop placement.
Discipline in trading isn’t just about clicking buttons at the right time. It’s about planning for the tough times—and sticking to your plan even when it feels bad.
❤️ Final Thought: Love Your Stops (Or at Least Respect Them)
Stop losses aren't your enemy. They're your overprotective friends. Sometimes they’ll throw you out of a trade you "knew" would come back. But more often, they’ll save you from very dangerous outcomes.
Mastering stop losses isn't about never getting stopped out. It’s about getting stopped out properly — with dignity, with minimal damage, and with your account intact.
In trading, pain is inevitable. Wipeouts are optional.
Your move: How do you manage your stops — and have you ever been wicked out so badly you considered quitting trading? Drop your best (or worst) stop-loss stories below.

GBP/USD – 1992 Replay | George Soros “Broke the Bank” TradeHistorical Context Summary:
This chart revisits the iconic 1992 short by George Soros against the British Pound, which ultimately forced the UK to abandon its currency peg and exit the European Exchange Rate Mechanism (ERM). The marked zones reflect the approximate levels where Soros reportedly initiated and closed his short position, anticipating a collapse of the GBP against the USD.
Real-time Trade Thesis:
Soros identified that the British economy was fundamentally too weak to sustain a fixed exchange rate against the Deutsche Mark, enforced through the ERM. Inflation was high, the economy was slowing, and the government was hiking rates and burning through reserves to defend the pound. Meanwhile, Germany’s economy was far stronger, making the GBP significantly overvalued relative to its fundamentals.
The Quantum Fund went short over £10 billion worth of GBP using highly leveraged positions, primarily via GBP/USD. On September 16, 1992 ("Black Wednesday") , the Bank of England capitulated after failing to hold the peg, and the pound collapsed—securing Soros one of the most profitable trades in history with over $1 billion in gains.
Technical Analysis Context:
This GBP/USD chart highlights the upper “order activation” zone where Soros began scaling into his short, as price stalled near the artificially defended level. As speculative pressure intensified, the central bank’s interventions failed, leading to a violent breakdown. The lower box marks the approximate range where Soros likely began closing the trade and locking in profit as the peg failed and panic selling set in.
Key Lessons:
Pegged currencies can’t defy economic fundamentals forever.
Macro conviction + tactical timing = asymmetric return.
Central banks can lose to coordinated market pressure.
Use leverage wisely, only when your thesis is airtight.
Liquidity stress often precedes capitulation—watch reserve flows and bond yields.
History leaves patterns—legendary trades repeat in new forms across cycles.