Learn the 3 TYPES of MARKET ANALYSIS
In the today's post, we will discuss 3 types of analysis of a financial market.
🛠1 - Technical Analysis
Technical analysis focuses on price action, key levels, technical indicators and technical tools for the assessment of a market sentiment.
Pure technician thoroughly believes that the price chart reflects all the news, all the actions of big and small players. With a proper application of technical strategies, technical analysts make predictions and identify trading opportunities.
In the example above, the trader applies price action patterns, candlestick analysis, key levels and 2 technical indicators to make a prediction that the market will drop to a key horizontal support from a solid horizontal resistance.
📰2 - Fundamental Analysis
Fundamental analysts assess the key factors and related data that drive the value of an asset.
These factors are diverse: it can be geopolitical events, macro and micro economic news, financial statements, etc.
Fundamental traders usually make trading decision and forecasts, relying on fundamental data alone and completely neglecting a chart analysis.
Price action on Gold on a daily time frame could be easily predicted, applying a fundamental analysis.
A bearish trend was driven by FED Interest Rates tightening program,
while a strong bullish rally initiated after escalation of Israeli-Palestinian conflict.
📊🔬 3 - Combination of Technical and Fundamental Analysis
Such traders combine the principles of both Technical and Fundamental approaches.
When they are looking for trading opportunities, they analyze the price chart and make predictions accordingly.
Then, they analyze the current related fundamentals and compare the technical and fundamental biases.
If the outlooks match, one opens a trading position.
In the example above, Gold reached a solid horizontal daily support.
Testing the underlined structure, the price formed a falling wedge pattern and a double bottom, breaking both a horizontal neckline and a resistance of the wedge.
These were 2 significant bullish technical confirmation.
At the same time, the escalation of Israeli-Palestinian conflict left a very bullish fundamental confirmation.
It is an endless debate which method is better.
Each has its own pros and cons.
I strongly believe that one can make money mastering any of those.
Just choose the method that you prefer, study it, practice and one day you will make it.
❤️Please, support my work with like, thank you!❤️
Fundamental Analysis

SIGNAL PROVIDERS: EXPERT ADVISORSAs the world of trading evolves and expands, new signal providers are popping up every day, promising to help traders identify potential market opportunities. However, there are many problems among legitimate providers from one of them: signal providers offer fraudulent Expert Advisors (EAs). These unscrupulous providers promise extraordinary returns and flawless trading systems, but in reality, they disappoint and lead to financial losses for unsuspecting rookie traders. In this post, we will examine the reality of EA fraud and give important tips on how to protect yourself in the trading industry.
EA scams primarily target traders looking for automated trading solutions using EAs. 99% of the time these are traders who have been in the industry for no more than a year. Signal providers often use deceptive tactics to lure people into their schemes. The main signs of fraud can include:
1. Unrealistic promises:
This is the biggest red flag. Signal providers make big claims of guaranteed profits or excessively high returns in a short period of time. Things get to the point of nonsense like 100% capital growth every week. But in reality, no trading system can do such results in a short period of time completely eliminating risk or ensuring error-free success.
2. Fabricated results:
To attract inexperienced clients, scammers show fabricated evidence of high EA returns using fake data or false reviews. It is crucial to independently verify track records and performance data as our team has done.
3. Lack of transparency:
Signal providers often lack transparency in their operations. They may withhold important information such as the strategy or methodology behind their EAs, making it impossible for traders to evaluate their performance. An EA may be behind a sliding line crossover. As a consequence, the EA gives signals when the market is in sideways movement, which is likely to lead to losses.
Protecting against expert advisor scams:
1. Do your due diligence:
Before signing up with any signal provider or purchasing an EA, conduct thorough research. Read reputable sources of user reviews and independent analysis to assess the reliability and performance of the provider. Since the reputation of the provider itself comes first. If the provider has a good reputation, they will not offer anything that is not of any use.
2. Check the track record:
Request supporting documents from the signal provider or developer, such as statements from real trading accounts or third-party verification results like we do. Reliable providers should be transparent about their historical performance.
3. Be skeptical of unusual claims:
Be cautious when encountering providers promising guaranteed profits or unusually high returns, this is always a red flag. Remember that trading always involves risk, and no system can completely eliminate it.
4. Test periods and money back guarantees:
Choose signal or EA providers that offer trial periods or money back guarantees. Legitimate providers are confident in their services and allow traders to test them with minimal financial commitment.
5. Get professional advice:
We have reviewed hundreds of signal providers and if you are unsure or inexperienced in evaluating signal providers or advisors, get advice from professional traders who will help and show you the right way.
Conclusion:
Although there are both genuine signal providers and effective advisors in the trading industry, traders must remain vigilant to protect themselves from EA scams. By conducting thorough research, checking history, using regulated platforms, being skeptical of unusual claims, using trial periods and money-back guarantees, and seeking professional advice, traders can reduce the risk of falling victim to scammers.

Cathie Wood's Trading MethodologyUnderstanding Cathie Wood's Trading Methodology
1. Introduction
In the dynamic world of finance, few have garnered as much attention in recent years as Cathie Wood, the visionary founder and CEO of ARK Investment Management. Underpinning her meteoric rise is a trading methodology that champions disruptive innovation and a futuristic outlook. Let's dive deep into what makes Wood's strategies stand out.
2. Historical Context
Investment, for decades, thrived on the mantra of 'safety first.' Blue-chip stocks, steady dividends, and bonds defined portfolios. However, the digital revolution brought with it companies that didn’t fit the traditional mold. Here, Wood saw an opportunity, challenging traditional norms and adopting an approach anchored in tomorrow rather than yesterday.
3. Disruptive Innovation as the Core
At the heart of ARK's investment strategy lies disruptive innovation. These are technologies or business models that transform industries and often render old methods obsolete. Think about how streaming altered entertainment or how electric vehicles (EVs) are reshaping mobility. In these disruptions, Wood sees not just change but investment opportunities.
4. Research-Driven Approach
While many firms tout the depth of their research, ARK goes a step further. It actively bridges the gap between sectors, combining insights from tech, healthcare, energy, and finance. The firm even collaborates with academia, startups, and online communities, believing that understanding disruption requires diverse perspectives.
5. Active Management and Portfolio Construction
Passive investing, tracking indices, has its merits, but Wood's vision is anything but passive. ARK's active management is about agility. As new research insights emerge or market dynamics shift, ARK's portfolios evolve, ensuring they reflect the most promising opportunities in disruptive sectors.
6. Contrarian Views and High Conviction Bets
Wood has never shied away from making bold claims, be it her bullish price target for Tesla or her belief in Bitcoin's potential. These high conviction bets might seem risky, but for Wood and ARK, they're informed decisions, grounded in research and a genuine belief in a company's or technology's transformative potential.
7. Exit Strategies and Risk Management
Every investment strategy, no matter how bullish, requires an exit plan. ARK's exit strategies, while not always publicized, are undoubtedly rooted in their rigorous research. Changes in a company's fundamentals, regulatory landscapes, or unexpected industry shifts can all trigger an exit. Additionally, risk is actively managed, with diversification strategies and hedging to cushion potential downturns.
8. Transparency and Engagement with the Public
A distinctive hallmark of ARK is its commitment to transparency. Unlike many peers, ARK frequently publishes its research, trades, and theses. This openness invites both praise and scrutiny, fostering a two-way dialogue between ARK and the investor community.
9. Criticisms and Challenges
No strategy is beyond critique. Wood's high conviction bets, while often profitable, expose portfolios to potential volatility. Detractors also argue that her strategies are too growth-focused, potentially overlooking stable, value-driven opportunities. Furthermore, ARK's rapid ascent means it now manages a sizable asset pool, which brings with it challenges of scale and agility.
10. Key Takeaways
Cathie Wood's vision extends beyond current market trends, anchoring firmly in future possibilities.
ARK's interdisciplinary research approach offers a holistic perspective on disruption.
Active portfolio management ensures adaptability in a fluid market landscape.
Transparency, while a double-edged sword, sets ARK apart, fostering trust and facilitating informed discourse.
11. Conclusion
In an era defined by rapid technological evolution, Cathie Wood's forward-looking trading methodology offers a refreshing perspective on investment. While not without its challenges, her approach underscores the importance of adaptability, conviction, and a keen understanding of the interplay between technology and industry. As the line between tech and traditional sectors blurs, methodologies like Wood's are not just relevant but imperative.

How to Adapt to the Ever-Evolving Financial Markets – 4 WaysThe only constant with the financial markets is…
Change
The market is constantly changing in a way that it’s bringing:
New demand
New supply
New volume
and fresh changes in the complex algorithms.
If you want to thrive you need to learn to learn to adapt, evolve and grow with the markets.
I want to cover four elements to today’s topic.
The Inevitability of Market Change
Change is not only constant but inevitable in financial markets.
There will always be new elements streaming into the markets from:
Global and political events
Micro and macro aspects
Economic indicators
Regulatory shifts, and
Investor sentiment
These elements are perpetually at work, shaping and reshaping the market.
These catalysts can shift the trajectory of entire sectors, leading to volatile market movements.
Influx of New Volume on Market Dynamics
Every day, the market sees a deluge of new volume.
There are new traders and investors constantly joining the financial markets world.
And we are seeing an inflow of capital from retail traders, institutional investors, and high-frequency trading firms.
The big institutions like Smart Money (banks, hedge funds, brokers etc…) are causing the big volatile moves in the market.
The smaller guys – dumb money and retail traders – are also helping with liquidity in the markets.
Every transaction is causing a shift in the market. No matter how small it’s the “Butterfly Effect of the financial market”.
The Role of Algorithms in Market Evolution
In the era of digital transformation, algorithms have become a pivotal part of the financial markets.
Algorithmic trading or ‘algo-trading’ employs complex mathematical models to execute trades at lightning speed and frequency.
I’m talking about Copy Trader, Robinhood, AI trading bots, EA Expert Advisors and pre-determined automatic mechanical trading methods.
This practice is now an integral part of the trading landscape.
And they will continue to have an influence in price action, and market patterns.
Haven’t you noticed?
In the 50s through to the early 2000’s. The markets trended on a more consistent basis.
Any monkey could choose a list of good stocks and hold them until they were up 200% – 1000%.
But nowadays with derivatives, algorithms, shorts and automatic execution – markets have never been more volatile and more difficult to ride the trends.
Always Adapt to Thrive in Changing Markets
It’s our job to learn to be more flexible and to adapt to these market conditions.
As markets evolve, so must we evolve with them.
We need to always:
Apply new markets to our watchlists
Look for better trading instruments
Change the trading strategy to make it more conducive with the environments
Always look for the next best broker, trading and charting platform
Look for ways to reduce costs and maximise profits.
I’ll end off with this.
The market is constantly changing, adapting and evolving.
We need to embrace the change and not see it as a threat.
Have this mentality and you’ll always have the opportunities to improve, anticipate and grow as a trader.

The Art of Trading: Parallel Between Master Artists and Traders The world of trading, much like the realm of art, is filled with uncertainty, complexity, and the need for creativity. Both traders and artists embark on journeys of discovery, seeking to master their crafts and find a unique approach in their respective fields. Without further due, let’s delve into the fascinating parallels between the practices of famous artists and the strategies employed by successful traders, uncovering lessons that can be applied to excel in the volatile world of trading.
1. The Picasso Perspective: Pablo Picasso, a pioneer of modern art, was never afraid to take risks and break away from conventional artistic norms. His innovative spirit led to the creation of Cubism, a radical departure from traditional art forms.
Trading Lesson: Just as Picasso embraced risk to innovate in art, traders should cultivate a willingness to take calculated risks and explore unconventional strategies. The key is to manage risk effectively, ensuring that potential rewards justify the risks taken (we would strongly encourage 1% risk with risk/reward ratio of 1:3.5+).
2. The Van Gogh Paradox: Patience in the Midst of Turbulence Vincent van Gogh’s life and work exemplify the importance of patience and perseverance. Despite facing rejection and lack of recognition during his lifetime, Van Gogh continued to paint, ultimately leaving behind a legacy of masterpieces.
Trading Lesson: We can learn from Van Gogh’s unwavering commitment to his art, understanding that success in trading often requires patience and resilience. Even in turbulent markets, maintaining a long-term perspective and sticking to one’s trading plan can lead to eventual success. Although it is pretty common to see backlash from family and friends, if you stick to your goals and passion, there is no doubt you can be the next Van Gogh of trading.
3. The Da Vinci Code: Leonardo da Vinci, a true Renaissance man, was known for his disciplined approach to art and his insatiable curiosity. He meticulously studied various subjects, from anatomy to aerodynamics, to enhance his artistic abilities.
Trading Lesson: Traders can draw inspiration from Da Vinci’s disciplined nature and commitment to continuous learning. Staying informed about market trends, refining trading strategies, and maintaining discipline in executing trades are crucial for trading success. As cliché as it sounds, consistency is the key. Creating the trading plan is not that hard, sticking to it is what makes the real difference.
4. The Monet Method - The Beauty in Patterns and Trends: Claude Monet, a founding father of Impressionism, was renowned for his ability to capture the subtle nuances of light and color, often painting the same scene multiple times to depict different lighting conditions.
Trading Lesson: Just as Monet focused on patterns and trends in his artwork, traders should develop a keen eye for recognizing market patterns and trends. Technical analysis can be a powerful tool in a trader’s arsenal, helping to predict future price movements based on historical patterns.
5. The Matisse Approach - Simplicity and Clarity: Henri Matisse was known for his use of bold colors and simple shapes, stripping away unnecessary details to focus on the essential elements of his compositions.
Trading Lesson: In trading, simplicity can be a virtue. Traders can learn from Matisse’s approach by simplifying their trading strategies, focusing on key indicators, and avoiding unnecessary complexity. A clear and straightforward trading plan can lead to more consistent results.
6. The Michelangelo Mindset - Mastery Through Practice: Michelangelo, one of the greatest artists of all time, spent countless hours perfecting his craft, from sculpting masterpieces like David to painting the Sistine Chapel ceiling.
Trading Lesson: Trading mastery, much like artistic mastery, requires extensive practice and dedication. Traders should commit to honing their skills, practicing their strategies, and learning from both successes and failures. The journey to trading excellence is a marathon, not a sprint. Try having small positive months in a row, instead of 1 month with +100% return and account blown right after.
7. The Pollock Principle - Embracing Uncertainty: Jackson Pollock, famous for his abstract expressionist drip paintings, embraced randomness and uncertainty in his creative process, allowing the paint to fall where it may.
Trading Lesson: The financial markets are inherently uncertain, and traders must learn to embrace and navigate this uncertainty. Developing a robust risk management strategy and maintaining a balanced portfolio can help traders manage uncertainty and protect their capital. As you have probably heard from many other specialists: “Trading is the game of probability”.
8. The O’Keeffe Outlook - A Unique Perspective: Georgia O’Keeffe is celebrated for her distinctive style and her ability to see beauty in the simplest of forms, often magnifying flowers and other natural elements in her artwork.
Trading Lesson: Developing a unique trading perspective can give traders an edge in the markets. Traders should strive to think independently, conduct their own analysis, and avoid getting swayed by the crowd. A unique and well-informed perspective can lead to more profitable trading decisions. There is nothing wrong with being inspired by a post made by a well-known TradingView author, but that shouldn’t prevail over your own common sense and judgement.
9. The Warhol Way: Capitalizing on Trends: Andy Warhol was a master of identifying and capitalizing on cultural trends, turning everyday objects like Campbell’s soup cans into iconic works of art.
Trading Lesson: Identifying and capitalizing on market trends is a key skill for traders. By staying attuned to economic indicators, news events, and market sentiment, traders can position themselves to profit from prevailing trends. Just as Warhol transformed ordinary objects into valuable art, traders can turn market movements into trading opportunities. Don’t fight the trends, it’s a losing battle you don’t want to be a part of. In the fast-paced world of trading, the ability to adapt to changing market conditions is vital. Put the ego aside, if the trade is going against your initial plan, close it, reevaluate, and make proper adjustments.
If you made it all the way here, we would like to thank you for taking the time and reading our write-up all the way and we hope you have a wonderful trading week ahead!

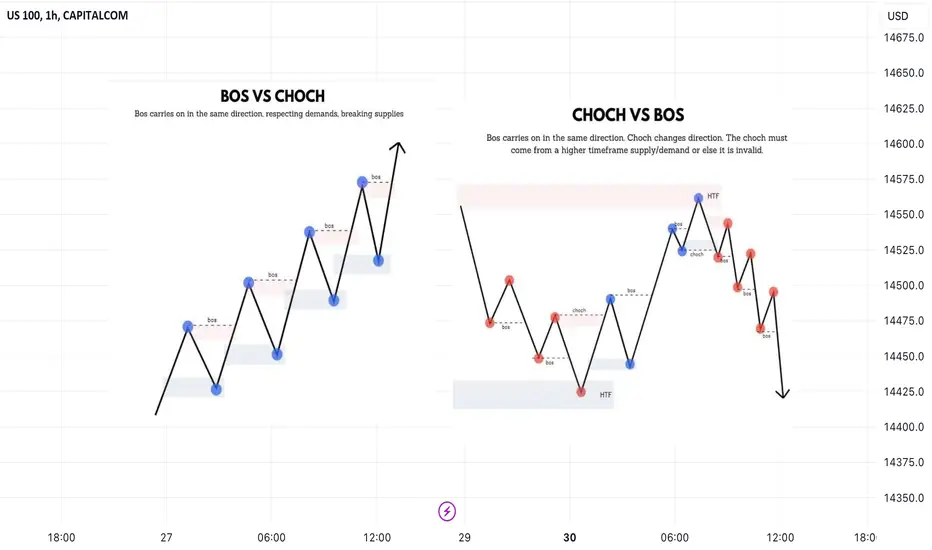
CHOCH vs BOS ‼️WHAT IS BOS ?
BOS - break of strucuture. I will use market structure bullish or bearish to understand if the institutions are buying or selling a financial asset.
To spot a bullish / bearish market structure we should see a higher highs and higher lows and viceversa, to spot the continuation of the bullish market structure we should see bullish price action above the last old high in the structure this is the BOS.
BOS for me is a confirmation that price will go higher after the retracement and we are still in a bullish move
WHAT IS CHOCH?
CHOCH - change of character. Also known as reversal, when the price fails to make a new higher high or lower low, then the price broke the structure and continue in other direction.
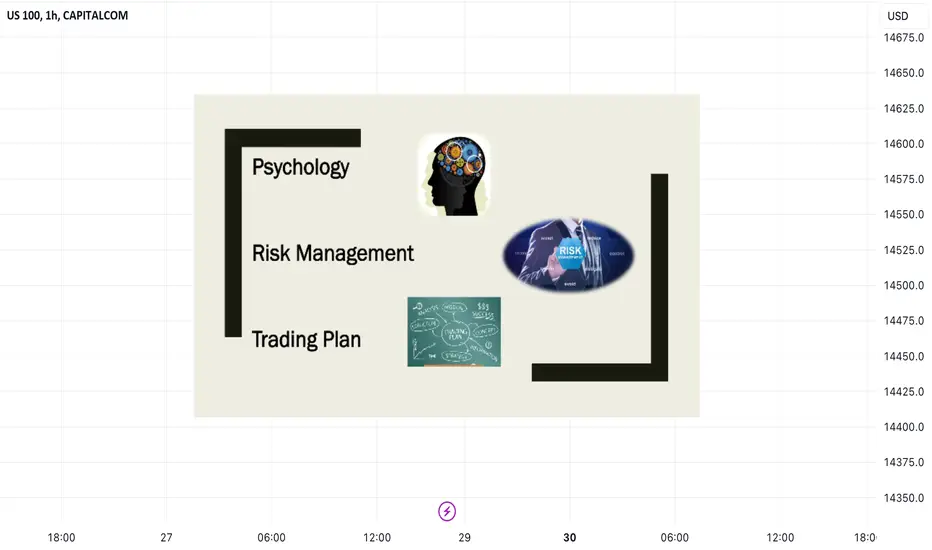
How to succeed in trading ✅From the experience I have in trading I have identified 3 pillars on which my success is based. I can't say that one is less important than another, so I try to combine all of them:
1) Psychology - is one of the most difficult aspects to master, which requires a lot of theoretical and practical knowledge, so I recommend first of all to study yourself, after you have managed to identify what kind of person you are, you will gain knowledge from books, videos, trainings that will help you control your emotions when trading. At the same time, this aspect can help you in your daily life.
2) Risk management - due to proper risk management, I managed to become funded. I also understood that in trading it is more important to tend to have a small risk, than a high profit, because greed for money can bring you into a less pleasant situation. I managed to take the account with a risk of 1% per trade and with an RR of at least 1: 2, which therefore showed me that even if I take 6 sls for 10 trades, I still remain profitable.
3) Trading plan - this is the aspect that motivates me to progress, once I have made a trading plan with well-defined goals, I tend to fulfill them. In addition to the purposes, a trading plan should contain the strategy applied, as well as the rules for entering / managing / exiting the transaction.
NEAR Q3 OverviewExecutive Summary
NEAR Protocol stands as a Layer-1 (L1) smart contract blockchain that couples a state-of-the-art sharded architecture with an emphasis on offering a user experience reminiscent of Web 2 platforms. While maintaining the security and decentralization integral to blockchains, NEAR aims to surpass the capabilities of prior chains, such as Ethereum, in terms of usability, efficiency, and scalability. Recognizing and aiming to overcome Ethereum's limitations, NEAR incorporates sharding. This key distinction allows the blockchain to significantly enhance its throughput, accommodating a more substantial transaction volume by dividing the blockchain into smaller, concurrent shards.
A pivotal differentiator for the NEAR Protocol, sharding was introduced in November 2021 as Nightshade. This technique allows validators to process only transactions specific to their assigned shards, enabling potentially infinite scalability. For end users and investors, Nightshade ensures quicker transaction speeds at reduced fees. Diverging from traditional sharding methods that split the blockchain into multiple states, NEAR's design maintains the blockchain as a singularly sharded entity. Additionally, a synchronized state mechanism ensures that a change in one block's state prompts adjustments in other shards correspondingly.
In March 2023, NEAR unveiled the Blockchain Operating System (BOS), a groundbreaking open-source platform that allows developers to craft applications across various blockchain environments using well-known programming languages. Moreover, it provides crypto users with an experience reminiscent of Web 2. Designed to be inclusive, BOS appeals to Web3 veterans and those new to the decentralized web. By ensuring easy onboarding, robust security, and seamless cross-chain interactions, BOS is setting a new paradigm for Web 3 application development.
The NEAR Foundation, with the inception of the NEAR Digital Collective (NDC) and a pivot to community DAOs, is pioneering a transition to a more democratized and decentralized framework compared to the conventional Board-based system. Launched in Q3 2022, the NDC represents a concerted effort to decentralize decision-making within the NEAR network, emphasizing transparency through defined treasury management and embracing decentralized governance with on-chain voting. Furthermore, the NDC aspires to advance validator decentralization and stimulate the development of the core protocol and infrastructure.
Looking forward into 2024, the Near protocol will introduce several pivotal milestones, including the next step in Nightshade sharding, meta transactions, zero-balance accounts, a Global Storage proposal, and more.
Introduction to Near
NEAR Protocol is a Layer-1 (L1) smart contract blockchain with a bleeding-edge sharded design and an emphasis on an intuitive Web 2-like customer experience, all while preserving the security and decentralization users expect with a blockchain. Established in 2018, it sets out to achieve improved usability, efficiency, and scalability over preceding chains like Ethereum. Founded by Illia Polosukhin and Alexander Skidanov and spearheaded by the Near Collective, the NEAR Protocol was envisioned to serve as a community-driven cloud computing PoS blockchain and a decentralized hub tailored explicitly for hosting innovative decentralized applications.
The central motivation behind NEAR's technology is to prevent network congestion and furnish a conducive environment for developers, thereby promoting on-chain protocol development. Early on, NEAR identified certain operational challenges in Ethereum, particularly related to network congestion and high/volatile gas fees, that it looked to solve. To do so, Near turned towards sharding.
A key differentiator for NEAR, sharding, in essence, provides the ability for a blockchain to increase its throughput and handle a larger number of transactions by partitioning the blockchain into smaller parallel shards. In its pursuits, Near introduced an original approach to sharding in November 2021 known as Nightshade, initially unveiled as Simple Nightshade. The underlying principle of Nightshade is that validators are not burdened with the task of processing every incoming transaction. Instead, they only handle transactions that are within specific shards. By doing so, Nightshade paves the way for theoretically limitless scalability. But what does this mean for the end user or investor? Primarily, this approach, which is entirely abstracted from the end-user experience, allows for reduced transaction fees while ensuring rapid transaction speeds.
Additionally, Near recently launched a new initiative in early 2023 known as the Blockchain Operating System (BOS). This development represents a significant shift in how we perceive blockchain platforms. The BOS is designed to integrate seamlessly with various blockchain systems while facilitating decentralization and discoverability, which have historically been impossible to achieve together.
Essentially, the BOS is grounded in blockchain technology but broadens its application by acting as a universal layer, making it adaptable to different blockchain frameworks. One of its primary features is the provision of a decentralized platform for front-end development. This platform aims to simplify the creation of blockchain applications by emphasizing clarity and flexibility.
One of the core advantages of BOS is its potential to decentralize user interactions, improve security protocols, and enhance the modularity of components. Additionally, it prioritizes compatibility across diverse blockchains, presenting developers with a more intuitive and straightforward development environment.
NEAR Technologies
Blockchain Operating System (BOS)
In March 2023, the NEAR protocol introduced the Blockchain Operating System (BOS), an open-source platform empowering developers with the flexibility to build across diverse blockchain environments using familiar programming languages and equipping crypto users with a familiar Web 2 UX. The BOS is designed to be inclusive and democratize the open, catering not only to seasoned web3 enthusiasts but also to the broader audience who might be newer to the decentralized web. A significant breakthrough in the system is eliminating the immediate need for a new user to own any cryptocurrency, substantially reducing the friction of user onboarding.
Additionally, the BOS interface streamlines access and navigation, making it more user-friendly for both developers and the general populace. Moreover, it enables users to search through a portal to diverse communities and applications, all the while prioritizing data privacy. Further, the BOS's user-centric design, coupled with its focus on accessibility, does not just simplify the onboarding experience but also bolsters the discovery of new applications.
Remarkably, the BOS functions both as a development platform and a social network. It’s an environment where users can both deploy and unearth new applications. In delivering straightforward onboarding procedures, unmatched security, and fluid interactions across all chains, the BOS is reshaping the framework for constructing Web 3 applications.
Source
BOS Under the Hood
The Blockchain Operating System (BOS) by NEAR seeks to redefine the landscape of Web3 applications through its unique architecture based on three pivotal elements: components, blockchains, and gateways. Here, we will delve into the significance of each element and examine how they collectively shape the BOS framework.
Components: The Building Blocks of BOS
Components exist at the decentralized application (dApp) layer and can be equated with notable platforms such as Lido, Uniswap, Compound, and others. They stand out for their on-chain storage, high degree of transparency, and their ability for developers to fork these applications, harnessing their functionalities and composability to craft comprehensive web applications. Storing the entirety of a component's code on-chain not only ensures auditability but also bolsters security. With the code readily available for scrutiny in blockchain explorers, users can operate these applications locally, enjoying resilience against potential censorship and a streamlined user experience. This ability to natively audit and locally run the applications represents a paradigm shift in the user-app relationship.
Blockchains: The Underlying Infrastructure
The versatility of components and the BOS becomes apparent in their ability to interact with numerous blockchains and smart contracts instead of just one chain. Currently, BOS offers compatibility with all EVM chains, such as Ethereum, Polygon, Arbitrum, and Optimism, as well as, the native NEAR platform. As EVM chains dominate the TVL in the DeFi space, the BOS’ ability to work across nearly all enables users to tap into nearly all the liquidity and top dApps in the crypto economy. NEAR's capability to efficiently and cost-effectively store HTML/CSS/JS makes it the preferred choice for hosting app source codes.
Gateways: Bridging the Gap to Decentralization
Gateways, the third pillar of the BOS, facilitate the delivery of decentralized front-ends to a broader audience. Each gateway is underpinned by a bespoke virtual machine (VM) equipped to load and run frontends for protocols, be they Ethereum-based, Layer 2 solutions, or alt-L1 platforms like NEAR. All code pertaining to these frontends finds its home on the NEAR blockchain. The gateways are diverse, ranging from wallets and portfolio tools to distinct applications like SWEAT. They cater to tasks as rudimentary as adding swap functionality or as intricate as erecting decentralized app stores. Integrating this expansive functionality requires just the addition of a JavaScript library, followed by a selection of desired app front-ends. Prominent gateway exemplars include near.org, bos.gg, near.social, Cantopia, and nearpad.dev.
The decentralization of composable front ends enabled by the BOS is unique to Near, filling a conspicuous and much-needed void in the crypto arena. Instead of relying on centralized data servers, these front ends are blockchain-stored, promoting both composability and resistance to potential censorship. Historical instances, such as Uniswap's token delisting and the sanctions imposed on Tornado Cash, underscore the vulnerabilities of front ends. BOS’s decentralized approach allows developers the flexibility to fork these front ends and build in the truly OSINT environment that the cryptocurrency movement was built upon.
BOS Advantages
The BOS aims to integrate decentralization with discoverability and developer flexibility. Central to the BOS framework is its array of Web3 development tools that are crafted with the intent of pushing Web3 mainstream. From the onset, the system is designed to enhance user onboarding, improve cross-chain development and app discoverability, and create a seamless UX for Web3 users.
This last point on abstracting away different blockchains for a seamless Web3 experience has benefits beyond simply improving UX. It can potentially also reduce the liquidity fragmentation and tribalism associated with a fragmented crypto economy built around disparate, siloed blockchains. The BOS proposes a solution to this by striving for a consistent user experience across multiple blockchains and allowing developers globally to access and implement various Web3 components. With users and developers now (potentially) unable to discern which blockchain they are using, there is no longer a need to promote one over the other.
None of this is possible without the composability offered by the BOS. The system aims to be chain and language-agnostic, allowing developers to reuse and adjust different components while utilizing the language of their choice. The BOS supports a variety of languages for smart contract development, including JavaScript, Rust, AssemblyScript, and Solidity. Complementing this are their collaborations with established cloud providers, namely Google, Seracle, and Alibaba Cloud, to make transitioning from Web2 to Web3 as comfortable as possible.
In addition, NEAR has initiated the NEAR Dev Hub, a platform envisioned as a resource hub for developers. Preliminary outputs from this initiative include sponsored hackathons and the establishment of community groups.
Thresholded Proof of Stake
The NEAR Protocol operates on a distinct consensus mechanism known as "Thresholded Proof of Stake" (TPoS). Similar to other PoS implementations, TPoS still uses validators, who must stake NEAR tokens to participate, to validate transactions and ensure the integrity/security of the network. However, within the TPoS environment, validators can assume one of four pivotal roles:
Chunk Producers: Their primary responsibility is to authenticate transactions on individual shards, subsequently crafting a chunk, often referred to as a "shard block", from their designated shard.
Block Producers: These validators gather chunks from their chunk-producing counterparts associated with discrete shards. Their function culminates in the production of a block, which is then added to the primary chain.
Hidden Validators: Operating under a veil of confidentiality, these validators authenticate random shards — shards whose identity remains a secret to them and is undisclosed to the public. This veil serves a dual purpose. Firstly, it considerably complicates the task for any malevolent entities attempting to compromise them. Secondly, it robustly augments the chain's overall security measures.
Fishermen: Actively overseeing certain chain segments, these validators act as the guardians against fraudulent activities. They constantly monitor, ready to flag any nefarious activities. Interestingly, their operational requirements are modest — a minimal stake. However, this role, though critical, doesn't confer any rewards.
Central to TPoS is its innovative auction system employed to select validators. This methodology, in essence, discourages the practice of pooling. When validators amass resources, they not only amplify their individual rewards but also consolidate control over the chain. Such centralization runs counter to the foundational principles of blockchain, which emphasize distributed control. The TPoS design confronts this challenge head-on by placing natural barriers against pooling.
Additionally, TPoS tackles the issue of consensus forking — a scenario in which multiple validators simultaneously contribute blocks to the chain. Such events can elongate the time required for transaction finality. By minimizing the possibility of these forking instances, TPoS ensures swifter transaction finality.
Validator Requirements
Validators bear the critical responsibility of validating and executing transactions across the entirety of NEAR's sharded blockchain. Additionally, they monitor their peers (other validators), ensuring no invalid blocks are produced or alternate chains are formed. Validators found compromising network stability undergo "slashing," where part or all of their staked assets are confiscated. To compensate for their services and inherent risks, NEAR validators receive a inflationary protocol rewards, amounting to 4.5% of the total supply annually.
Given the complexity of the validator role, there are stringent hardware requirements (e.g. costs) for anyone looking to run one. To effectively run a validator, a robust system configuration, consisting of an 8-Core CPU, 16GB of RAM, and 1 TB SSD storage, is necessary. Current estimates indicate that the monthly expenditure for hosting a block-producing validator node stands at $330+.
This excerpt just scratches the surface, for the full report, click here .

10 Proven Tips for TradersIn the fast-paced world of day trading, staying ahead of the curve is essential.
If you appreciate our charts, give us a quick 💜💜
Here are ten time-tested strategies to guide your journey towards trading success:
1. Craft a Concrete Plan:
A meticulously planned strategy is your foundation. Clearly define what, how much, and when you will trade. Rushing into trades without a plan can lead to costly mistakes.
2. Prioritize Risk Management:
Risk management is paramount. Establish a robust strategy, including stop-loss levels and trusted brokers. Safeguarding your capital ensures longevity in the trading game.
3. Leverage Technology:
Embrace cutting-edge tools. Utilize charting platforms for market analysis and backtest your strategies against historical data. Mobile apps offer real-time market access, empowering you to make informed decisions.
4. Embrace Continuous Learning:
Stay nimble by staying informed. Keep up with news, trading literature, and emerging market trends. Adaptability is key in evolving markets like cryptocurrencies.
5. Rely on Facts, Not Emotions:
Base your decisions on cold, hard facts. Emotional impulses can cloud your judgment. Trust your data-backed strategies, preventing impulsive and regrettable actions.
6. Set Entry and Exit Rules:
Discipline is your ally. Stick unwaveringly to your predefined entry and exit points. Deviating from your plan risks unnecessary losses.
7. Strategy Over Money:
Focus on strategy execution, not profits. Concentrating solely on money can lead to hasty, ill-informed decisions. Trust your strategy; profits will naturally follow.
8. Own Your Decisions:
Accept responsibility for both wins and losses. Learn from mistakes constructively. Pinpoint errors, adjust your approach, and fortify your strategy for future trades.
9. Maintain a Detailed Trade Journal:
Record every trade meticulously. Modern software simplifies this process, offering insights into your past trades. A trading journal is your compass, guiding you towards informed decisions.
10. Recognize When to Pause:
Acknowledge when your strategy falters. Avoid chasing losses; instead, recalibrate your approach. Knowing when to step back is a hallmark of a seasoned trader.
Continuously refining your skills with these principles can elevate your day trading prowess. Stay disciplined, adapt to the markets, and success will undoubtedly follow.
Happy trading! 💜

What is a REIT and how do they work?A. Let’s start with the basics:
REITs stands for 'Real Estate Investment Trusts'.
These are essentially property companies that are listed on the stock market which you'll find pretty much most of them on TradingView.
So how do they work?
Step 1: An individual decides to invest in a REIT company.
Step 2: The money is then collected into a large pool (like all trusts).
Step 3: The pooled money is then invested into the property that the company either owns, operates or finances.
Step 4: Over time the company starts to make revenue and profit.
Step 5: The profits are then accounted and collected.
Step 6: The profits are then distributed in parts to the initial investors who
helped finance the company through a REIT.
Sounds great in theory…
But in reality, there is always a catch…
And that catch is timing.
The Big five SA Reits have lost over R100bn in value since 2018.
The BIG five REITs are:
1. Growthpoint
2. Redefine
3. Resilient
4. Vukile and
5. Hyprop.
Of course, this could be seen as an opportunity but there are several other factors we need to consider before deciding the best time to trade this type of asset.
A trick will be to overlay the five companies on a chart. See how they move and operate in conjunction to each other.
And then we can decide which are buys or sells.
Apples with apples.

4 TIPS TO SPECULATE LIKE A SUCCESSFUL TRADER AND GET BACK ON TRA(1) Don’t Let Risk Change Your Behaviour
The biggest psychological obstacle for traders is the perception of losses (and the concept of losing). For traders, the pain of closing a trade and realizing a loss outweighs the excitement of realizing a winning trade of equal magnitude.
(2) Don’t let confidence get the best of you
After putting together a string of successes, it’s human nature to build up confidence around your dealings and this can be a good thing.
But once a trader has gone into the territory of being ‘over-confident’, risky habits may sneak into their approach, none more damaging than the willingness to bend their own trading rules simply because they feel it will be successful.
Therefore, traders should always look to strike that delicate balance between being scared or fearful, and over-confident.
(3) Bring a Positive Mindset to the Charts Every Day
Since you will inevitably be taking losses in this game of forex speculation, it’s important to deny those losses from altering your frame of mind.
Traders will often experience the disappointment of being stopped out and this can be very discouraging. As a result of this they take shortcuts on their analysis or question their own approach. This never ends well.
Well to conclude..
One of the best ways to manage your emotions is to trade with stops and set a positive risk to reward ratio.
Many traders believe that a trading strategy has to be perfect. Most times the best strategy is the simple strategy. Learn how to trade consistently without the perfect strategy.

Tech stock Vs Energy stocks. The Competition for Decades This is an education-style publication where the main graph is a comparison (ratio) between two ETFs (funds) managed by State Street Global Advisors Corporation, the creator of the world’s first ETF (well-known in nowadays as AMEX:SPY ) and an indexing pioneer.
The first one ETF is The Technology Select Sector SPDR Fund, AMEX:XLK .
👉 AMEX:XLK seeks to provide investment results that provide an effective representation of the Technology sector of the S&P 500 Index SP:SPX .
👉 AMEX:XLK seeks to provide precise exposure to companies from Technology hardware, storage, and peripherals; software; communications equipment; semiconductors and semiconductor equipment; IT services; and electronic equipment, instruments and components.
👉 AMEX:XLK is a place where securities of American World-known Technology companies like Apple Inc. NASDAQ:AAPL and Microsoft Corp. NASDAQ:MSFT , like Nvidia Corp. NASDAQ:NVDA and American Micro Devices NASDAQ:AMD , like Cisco Systems Inc. NASDAQ:CSCO and Adobe Inc. NASDAQ:ADBE meet together.
👉 In contrast with other Technology-related ETFs like NASDAQ:QQQ (Invesco Nasdaq 100 Index ETF) or NASDAQ:ONEQ (Fidelity Nasdaq Composite Index ETF), stocks allocation in AMEX:XLK depends not only on their market capitalization, but also hugely on Technology industry allocation (like software, technology hardware, storage & peripherals, semiconductors & semiconductor equipment, IT services, communications equipment, electronic equipment instruments & components).
That is why allocation of Top 3 holdings in AMEX:XLK ( Microsoft Corp. NASDAQ:MSFT , Apple Inc. NASDAQ:AAPL and Broadcom Inc. NASDAQ:AVGO ) prevails 50 percent of Funds assets under management.
👉 Typically AMEX:XLK holdings are Growth investing stocks.
The second one ETF is The Energy Select Sector SPDR Fund, AMEX:XLE .
👉 AMEX:XLE seeks to provide investment results that provide an effective representation of the energy sector of the S&P 500 Index SP:SPX .
👉 AMEX:XLE seeks to provide precise exposure to companies in the oil, gas and consumable fuel, energy equipment and services industries.
👉 AMEX:XLE allows investors to take strategic or tactical positions at a more targeted level than traditional style based investing.
👉 AMEX:XLE is a place where stocks of American World-known Oil companies like Exxon Mobil Corp. NYSE:XOM and Chevron Corp. NYSE:CVX , like EOG Resources Corp. NYSE:EOG and ConocoPhillips NYSE:COP , like Valero Energy Corp. NYSE:VLO and Phillips 66 NYSE:PSX meet each other.
👉 Weight of Top 3 holdings in AMEX:XLE (Exxon Mobil Corp. NYSE:XOM , Chevron Corp. NYSE:CVX and EOG Resources Corp. NYSE:EOG ) prevails 45 percent of Funds assets under management.
👉 Typically AMEX:XLE holdings are Value investing stocks.
The main graph represents different stock market stages of work
🔁 Early 2000s, or post Dot-com Bubble stage, that can be characterized as Energy Superiority Era. There were no solid Quantitative Easing and Money printing. U.S. Treasury Bond Interest rates TVC:TNX , TVC:TYX as well as U.S. Federal Funds Rate ECONOMICS:USINTR were huge like nowadays. Crude oil prices TVC:UKOIL , TVC:USOIL jumped as much as $150 per barrel.
The ratio between AMEX:XLK and AMEX:XLE funds collapsed more than in 10 times over this stage.
🔁 Late 2000s to early 2010s, or post Housing Bubble stage, that can be characterized as a Beginning of Quantitative Easing and Money printing. U.S. Treasury Bond Interest rates TVC:TNX , TVC:TYX as well as U.S. Federal Funds Rate ECONOMICS:USINTR turned lower. Bitcoin born.
The ratio between AMEX:XLK and AMEX:XLE funds hit the bottom.
🔁 Late 2010s to early 2020s, or post Brexit stage, that can be characterized as a Continuation of Quantitative Easing and Money printing. U.S. Treasury Bond Interest rates TVC:TNX , TVC:TYX as well as U.S. Federal Funds Rate ECONOMICS:USINTR turned to Zero or so. Crude oil turned to Negative prices in April 2020 while Bitcoin hit almost $70,000 per coin in 2021.
Ben Bernanke (14th Chairman of the Federal Reserve In office since Feb 1, 2006 until Jan 31, 2014) was awarded the 2022 Nobel Memorial Prize in Economic Sciences, jointly with Douglas Diamond and Philip H. Dybvig, "for research on banks and financial crises", "for bank failure research" and more specifically for his analysis of the Great Depression.
The ratio between AMEX:XLK and AMEX:XLE funds becomes great and respectively with monetary stimulus hit the all time high.
🔁 Early 2020s, or post Covid-19 Bubble stage, that specifically repeats early 2000s Energy Superiority Era. There is no again Quantitative Easing and Money printing. U.S. Treasury Bond Interest rates TVC:TNX , TVC:TYX as well as U.S. Federal Funds Rate ECONOMICS:USINTR are huge nowadays like many years ago. Commodities prices like Wheat CBOT:ZW1! , Cocoa ICEUS:CC1! , Coffee ICEUS:KC1! , Crude oil prices TVC:UKOIL , TVC:USOIL jump again to historical highs.
The ratio between AMEX:XLK and AMEX:XLE funds is fading to moderate levels that can be seen as 200-Month simple moving average.
💡 In a conclusion.. I wonder, how the history repeats itself.
This is all because markets are cyclical, and lessons of history always still remain unlearned.
💡 Author thanks PineCoders TradingView Community, especially to @disster PineCoder for its excellent and simple script Quantitative Easing Dates .
Based on this script, Easing Dates are highlighted at the graph.

Trading &/or GamblingThe difference between trading and gambling.
This article will shine a light on the most frequent mistakes that traders make. These mistakes blur the thin line between trading and gambling.
Many people have spoken on this topic, but we truly believe that it is still not sufficient, and traders should be better educated on how to avoid gambling behaviour and emotional outbursts. When we speak about trading versus gambling, we define gambling as the act of making irrational, emotional and quick decisions.
Most of the time, these decisions are based on greed, and sometimes fear of the trader. Let’s dive into the exact problems we have personally experienced thousands of times, and want to help others avoid.
1 ♠ Bad Money Management
This is something that everyone has heard at least once, but seems to naively ignore in the hopes that it is not that important .
It is the most important . When a trader enters trades, it is exceptionally alluring to enter with all of their money, or close to all of it. In gambling terms, that is going “All in”, or “All or nothing”.
As a rule of thumb, both traders and gamblers should only place or bet money that they can afford to lose.
Thankfully, at least in trading one can limit their loss for that specific trade, by placing a stop loss or exiting before total liquidation. In Poker, you can’t fold when you are “All in” and take a portion of your money back. However, that does not mean entering trades with full capital, even with a stop-loss, is going to give you exponential returns and feed your greed for profits.
Traders should enter positions with a small amount of their full capital, to limit the damage from losses. Yes, you also limit the possibility that you win a few trades in a row with all of your money and… There goes the greed we mentioned.
The “globally perfect” percent of equity you need to enter trades to reach that balance between being too cautious and too greedy does not exist. There are methods, like the Kelly Criterion, as described in our previous Idea (see related ideas below), that help you optimize your money management.
Always ask yourself, “How much can I afford to lose?”. Aim for a balanced approach. This way you can position yourself within the market for a long and a good time, not just for a few lucky wins. Greedy money management, or lack thereof, ends in liquidations and heartbreak.
2 ♣ The Use of Leverage
Anyone who has tried using leverage, knows how easy it is to lose your position (or full) capital in seconds. Using leverage is mainly sold to retail traders as a tool for them to loan money from the exchange or broker and bet with it. It is extremely profitable for institutions, since it multiplies the fees you pay them ten to one hundred-fold.
In our opinion, leverage isn’t something that should be entirely avoided. However, it should be limited as much as possible.
We cannot deny that using 1-5x leverage can be beneficial for people with small accounts and a thirst for growth, however as the leverage grows, the more of a gambler you become.
We often see people share profits made using 20+ times leverage. Some even use ridiculous leverages within the range of 50-125x.
If you are doing that, do you truly trust your entry so much that you believe the market won’t move 1% against your decision and liquidate you immediately?
At this point, the gambling aspect should be evident, and it goes without saying that you should not touch this “125x Golden Apple”, like Eve in the Garden of Eden. Especially when you see a snake-exchange promote it.
If you use a low amount of leverage, and grow your account to the point where you don’t need it for your personal goals in terms of monetary profit. You should consider stopping the use of it, and at least know you’ll be able to sleep at night.
3 ♥ Always Being In A Position
Always being either long or short leads to addiction and becomes gambling. While we don’t have scientific proof of that, we can give you our own experience as an example. To be a profitable trader, you do not need to always be in a position, or chase every single move on the market.
You need to develop the ability just to sit back and watch, analyse and make conscious decisions. Let the bad opportunities trick someone else, while you patiently wait for all your pre-defined conditions to give you a real signal.
When you think of trading, remember that the market has a trend the minority (around 20-30%) of the time. If you are always in a position, this means that 70-80% of the time you are hoping that something will happen in your favour. That, by definition, is gambling.
Another aspect, that we have experienced a lot, is that while you remain in a position, especially if you have used leverage, you are constantly paying your exchange fees. You can be in a short position for a week and pay daily fees which only damage your equity, and therefore margin ratio. So why not just sit back, be patient and define some concrete rules for entering and exiting?
Avoid risky situations, and let the market bring the profits whenever it decides to.
4 ♦ Chasing Huge Profits
Hold your horses, Warren Buffett. Through blood, sweat and tears, we can promise you that you cannot seriously expect to make 100% every month, no matter what magical backtesting or statistics you are calculating your future fortune on.
Moreover, you will realise that consistently making 2-5% a month is an excellent career for a trader.
Yes, the markets can be good friends for a while, you may stumble into a bull-run and start making double-digit profits from a trade from time to time. Double-digit losses will also follow if you lose your sight in a cloud of euphoria and greed.
Many times, you can follow the “profit is profit” principle, and exit at a small win if the risk of loss is increasing.
5 ♠ Being Sentimental Towards Given Assets
You may have a fondness for Bitcoin and Tesla, and we understand that because we too have our favourites. Perhaps you’re deeply attached to the vision, community and purpose of certain projects. On the flip side, there may be projects that you completely despise and hope their prices plummet to zero.
What you personally like and dislike, should not interfere with your work as a trader. Introducing such strong emotions into your trading will lead you into a loop of irrational decisions. You may find yourself asking, “Why isn’t this price going parabolic with how good the project is?”.
This sounds, from personal experience, quite similar to sitting at a Roulette table and asking: “Why does it keep landing on red when I’ve been constantly betting black? It has to change any moment now”.
First and foremost, you may be completely wrong, but most importantly – it could go parabolic, but trying to predict the exact time or expecting it to happen immediately and placing your “bet” on that is again, gambling.
Don’t get attached to projects when trading. If you are an investor who just wants to hold their shares in an awesome company, or cryptocurrency, that is perfectly fine, hold them as much as you want.
The key is to make an important distinction between trading and investing, and to base your strategy on the hand that the market provides you with.
6 ♣ Putting Your Eggs In One Basket
We all have heard of diversification, but how you approach it is crucial. A trader should always have their capital spread between at least a few assets. Furthermore, the trading strategy for each asset must be distinct, or in other words – they should not rely on the same entry and exit conditions for different assets.
The markets behave differently for each asset, and you cannot be profitable with some magical indicator or strategy with a “one-size-fits-all” style. Divide your trades into different pairs and asset classes, and study each market individually to properly diversify. Manage the equity you put into each trade carefully!
Conclusion
The takeaway we want you as a reader to have from this article is that trading without consciously controlling your emotions inevitably leads to great loss and most importantly, a lot of stress.
We hate stress. Trading and life in general is exponentially harder when you are under stress. Control your risk, sleep easy, and let the market bring you profits.
Reaching this level of Zen will not be easy, but it is inevitable. Be happy when you make a profit, no matter how small or big. A lot of small profits and proper money management complete the vision you have of a successful business. Ultimately, trading is just that – work, not gambling or a pastime activity. Treat it as work and always remember to never rely on luck.
The advice we’ve included here is written by a few experienced gamblers… Oops, I meant traders 😉.
We hope that some of the lessons we’ve had to painstakingly learn through trial and error can now be shared with those who are interested. Of course, none of this constitutes investment advice. It’s merely a friendly heads-up.

Why It Pays to be a Patient Trader – 10 PointsPatience, passion and persistence.
The three Ps of what it takes to make it as a trader.
We like to say 5% is action and 95% is waiting.
And that’s why I’ve written a complete guide to being a patient trader.
Let’s start…
No Impulsive Decisions
Impulsive decisions are the bane of any trader.
The market is known to be volatile, jumpy, fickle and are prone to make sudden swings.
These swings can cause panic, fear and can lead to really poor trading choices.
If you have the patience to wait for your setup, the right market environment and for your trade to play out – you’ll stop the impulsive and emotional decisions.
Wait for the right and conducive market conditions
Many trading systems are designed to work optimally under certain market conditions.
For trend, momentum, and breakout traders – we need to let the market move and continue to move in the directions.
Patient traders will need to continue taking their trades, when the system lines up.
And only when the environment is right, will they make money.
That’s why you need to learn to risk little with the losses.
And when the winners kick in, they’ll make up for the dips and will help your portfolio flourish eventually.
Spot only the high and medium probability trades
Don’t be a rash trader.
When you jump with every opportunity you can.
There are low, medium and high probability setups.
Wait for only the high and medium probability trades.
Skip the low probability trades that align or risk very little (0.5%).
Only trade those that align with your system’s strength and exhibit strong, favourable signals.
This will help boost your win rate and drop the chances of loss.
Hold onto winners
To grow your portfolio, you need to let your winners run.
Let the great trades, run their course.
Many traders, especially beginners, often exit winning trades too soon due to fear of a reversal.
They also exit quickly as they don’t want to take the trade to turn into a loss.
And as a result, they bank a measly gain.
A patient trader understands that great profits are made when you ride the big trends.
This will require you to resist the urge to close a winning position prematurely.
Wait it out
A trader must sometimes wait:
Wait for a setup to come to fruition.
Wait for the trade to play out.
Wait for unfavourable trading periods to end.
Emotional stability
While you’re being patient.
Cut out the emotions.
That feeling of ants in your pants. Rather learn to maintain emotional stability, and avoid the emotional highs and lows.
Your trading should not feel like an emotional rollercoaster. Just do your job and treat it as a job.
Not as the lottery. Not as a gamble. Not as a be all and end all situation.
Don’t let anything cloud your judgement that can lead you to trading bad.
Master your trading strategy
Just because you have a trading strategy and gameplan.
Does not mean, you know how it works over the long haul.
A patient trader takes time to master their trading strategy.
Back, forward and real test the strategy carefully.
Trade them on different markets. See how they work taking into account the costs (brokerages, daily interest charges and even spreads).
Know how the game-plan works in all different situations and environments until you are consistent and have a proven and tested methodical execution.
Avoid overtrading
Patience helps traders avoid overtrading.
This is a common pitfall where too many positions are taken.
You have to stop revenge trading (to make up for losses).
You have to stop over trading (to try make more gains in a day).
Stick to high probability trades, a careful selection of markets and the best times to trade.
Learn from mistakes
The main time you’ll actually learn, adapt and grow as a trader – is through your mistakes.
When you make a mistake, do not sweep it under the rug.
Take the time to write them down, screenshot them and jot down a memo to yourself about these mistakes.
When you learn from them, it will prevent you from making them again and you’ll even be able to refine your strategy to avoid them.
Develop discipline into integration
Patience cultivates discipline.
That is trading well every single day or week.
Once you adapt into a routine and you have the discipline to act accordingly.
Then you will enter into a lifestyle integration.
You won’t think twice. You won’t need anything to motivate you to trade.
You will just trade well like you brush your teeth, sleep or eat everyday.
Once you have integration, there’ll be no need for motivation.
Summary
Patience in trading is a trader’s virtue.
It is an essential strategy for you, if you wish to attain long-term success in the financial markets.
Here are the key points we mentioned in this complete patience guide.
No Impulsive Decisions
Wait for the right and conducive market conditions
Spot only the high and medium probability trades
Hold onto winners
Wait it out
Emotional stability
Master your trading strategy
Avoid overtrading
Learn from mistakes
Develop discipline into integration

Looming Threats to Food and Energy SecurityThe global food and energy markets face growing uncertainty and volatility in the coming years due to converging factors that could lead to supply shortages, price spikes, and potential shocks.
One concern is the impact of declining sunspot cycles on the climate. Scientists predict that a grand solar minimum could occur in the coming decades, causing global cooling and disruptive weather patterns, negatively affecting grain production in key agricultural. With grain supplies tightened, any further demand increases would send prices a lot higher.
Global grain consumption has grown steadily, increasing by over 2% in the last 25 years. Rising disposable incomes in developing countries have enabled consumers to add more protein foods like meat and dairy to their diets. However, this dietary shift puts pressure on grains, since over 8 pounds of grain is needed to produce just 1 pound of beef. Hence, increased meat consumption indirectly leads to higher demand for grains.
The ongoing war in Ukraine has severely impacted global grain markets, compounding the risks. Combined, Russia and Ukraine account for nearly 25-30% of worldwide wheat exports. With both countries blocking or threatening to destroy grain shipments, the conflict poses a huge threat to food security especially in import-dependent regions like North Africa and the Middle East. Export restrictions like India's recent rice export ban to protect domestic food security are also tightening global grains trade. As supplies dwindle, agricultural commodities become more vulnerable to price shocks.
These supply uncertainties make soft commodities like cocoa, coffee, and sugar especially at risk of price spikes in coming years. Prolonged droughts related to climate cycles like La Niña and El Niño could severely reduce yields of these crops grown in tropical regions of Southeast Asia, Africa, and South America. For instance, a drought in West Africa's prime cocoa-growing areas could significantly impact production. Cocoa prices are already trading near 6-year highs in anticipation of shortages. If drought hits key coffee-growing regions of Vietnam and Brazil, substantial price increases could follow.
Similar severe drought potential exists in the U.S. Midwest this summer. Lack of rainfall and moisture could cause severe yield reductions in America's corn and soybean belts. Since the U.S. is the world's largest corn and soybean exporter, this would cause severe upward price pressures globally. The rise in agricultural commodities ETF Invesco DBA likely reflects investor concerns about impending supply shortages across farming sectors, and its price might be leading the spot price of agricultural commodities.
Fertilizer prices also contribute to food market uncertainty. In 2021-2022 fertilizer prices skyrocketed due to energy costs rising, directly raising the cost of food production. When fertilizer prices surge, it puts immense pressure on farmers' costs to grow crops and indirectly influences food prices. However, falling fertilizer prices do not necessarily translate into lower food costs for consumers. Fertilizer prices have dropped substantially over the last year, without that meaning everything is fine with fertilizer production. Dropping fertilizer prices could actually indicate a slowdown in agriculture, as, lower demand for fertilizers could mean fewer farmers are investing in maximizing crop yields. In that case, food production may decline leading to higher prices due to supply and demand fundamentals. At the same time, if other farm expenses like machinery, seeds, or labor rise due to factors like high energy costs, overall production costs could still increase even as fertilizer prices decline.
The energy markets face a similar mix of uncertainty and volatility ahead. Despite substantial declines in prices, the energy sector ETF XLE has held up well, suggesting investors anticipate a rebound in oil and natural gas. Fundamentally, both commodities could trade a lot higher in the long term, however in the medium term I believe that oil is poised to drop further to the $55-60 area before tightening supplies lead to much higher prices. Essentially what’s missing is a capitulation to flush bullish sentiment, and then lead to much higher prices. At the moment the market has found a balance between a weakening global economy and OPEC+ supply cuts.
A key uncertainty is China's massive oil stockpiling in recent years, now totaling nearly 1 billion barrels. If oil exceeds $80-85 per barrel, China could temper price rallies by releasing some of these reserves, as it did in 2021. With China's economy in turmoil, further reserve releases may be needed to stimulate growth, but it’s unclear whether its economy will be able to come back easily. Weak demand from China is already an issue for the oil market, and releases from the Chinese SPR could restrain oil prices over the next year. However, on the bullish side, the world remains heavily dependent on fossil fuels lacking viable large-scale alternatives, even as ESG trends continue. OPEC's dwindling spare production capacity raises risks of undersupply. Even an economic recession may only briefly dampen oil prices before supply cuts by major producers again tighten markets.
Ultimately, sustained high energy prices will restrain broader economic growth by reducing demand across sectors. The outlook for food and energy markets remains uncertain, with significant risks of continued volatility over the next few years. Multiple converging factors point to potential supply shortages and price spikes across agricultural commodities and fossil fuels. While prices may fluctuate in the short-term (6-12 months), the medium-term trajectory appears to be toward tighter supplies and higher costs for food and energy (2-5 years). To close on a more positive note, I believe that food and energy prices will see significant deflation as extreme technological progress pushes prices down in the long term (5+ years).

Roaring 2020s trading-investing economyAs you can see on the presented chart we made current economy started in 1998 with the crash of the LTCM, MFG, Bankruptcy of Russian Federation and BoE. With occasional dumps in liquidity we're heading into new golden era of global finance. Let us introduce you to what we think is the most impotant financal instruments in the world right now. Said instruments is the most liquid financial markets in the world leaving aside rest of the economy we will speak about later. So it would be Standart and Poors which is the most profitable companies in the United States of America, numbers about this field are presented on the top of the chart. Second to this further to the bottom of the presented chart are numbers about gold market, New York Stock Exchange volatility, United States of America 20 year yield, GDP, Labour Inflation, Oil markets, Russian Federation GDP, Russian Federation Moscow Exchange liquidity which is equivalent to quintillion rubles, said exchange volatility level called RVI, Inflation of Labour of the same country. After this goes Passives/Actives of the most expensive venture in the dynamically changing world Federal Reserve. And last but not the least goes 20 year yield of China Republic and Russian Federation. Try to analyse presented chart with your idea of public markets and how they react on the events you see as important or playing a big role in life. Thank you for your attention please read and comment see you in later events. And remember correlation do not present cause effect. We wish you luck in roaring 2020s keep yourself in the peace mood of mind.

Become a Trading Machine – 11 Ways!If you want to trade well and consistently.
You have to be more mechanically orientated.
I’ll be literally quick and brief.
Saying “literally” was unnecessary and made it longer.
Sorry.
Here are the pointers:
1. Stay committed
2. Cultivate patience
3. Avoid herd mentality
4. Be long-term oriented
5. Stop crying over losers
6. Review your performance
7. Stop celebrating winners
8. Adapt to market conditions
9. Keep your emotions in check
10. Don’t think of quick success
11. Adapt and advance with technology
Are there any ways you take to be a trading machine?
Let me know!

Top 10 books in tradingAs a trader now of over 23 years, I have read a few hundred trading books in that time. It is always really interesting to have other people's perspective, strategies, hint, tips and tools.
However, the main issue is not knowing if you are likely to get value from the book you purchase as it is also very subjective. You either have issues such as the book is too basic, or the other end of the scale, it's too advanced.
During the 20 plus years, I found a number of great books that helped me - but also ones I have shared with others over the years. Regardless of your level of knowledge how do you know what works or would work for you or your style of trading?
I put this list together in no real order, but I'll try to summarise each with a little about what I liked or what you can take away.
==============================================================
"The Wall Street Jungle"
Written by Richard Ney, first published in 1970. In this book, Ney provides readers with an insider's perspective on the world of finance and investment. He delves into the complexities and pitfalls of Wall Street, offering a critical examination of the stock market and the investment industry.
Ney, a former Wall Street insider himself, reveals the often deceptive practices and psychological games played by brokers and financial institutions. He discusses the dangers of following investment advice blindly and emphasizes the importance of informed decision-making when it comes to managing one's finances.
Throughout the book, Ney uses real-life examples and anecdotes to illustrate the challenges and temptations that investors face. He also explores the psychological aspects of investing, discussing how emotions can influence financial decisions and lead to costly mistakes.
What I like about this is the emphasis put on the market makers, as a trader who uses Wyckoff Techniques, it made more sense when identifying with Composite Man theory.
"Trading in the Zone"
By Mark Douglas that focuses on the psychology of trading and investing. Published in 2000, the book offers valuable insights into the mental aspects of successful trading. Douglas emphasizes the idea that trading is not just about mastering technical analysis or market fundamentals but also about mastering one's own emotions and mindset.
This book was one of the best in terms of psychology, every trader has a different appetite for risk and even profits, this is a huge factor in trading especially early on. If you struggle with psychology of trading or the emotions, I would 100% recommend this one.
"The Wealth of Nations"
Written by the Scottish economist and philosopher Adam Smith, first published in 1776. This influential work is considered one of the foundational texts in the field of economics and is often regarded as the birth of modern economics.
In the book Smith explores the principles of a free-market capitalist system and the mechanisms that drive economic prosperity. He famously introduces the concept of the "invisible hand," which suggests that individuals pursuing their self-interest in a competitive market inadvertently contribute to the greater good of society.
For me, the rules of economics have not changed much since the creation of this book. appreciating moves such as DXY up = Gold down, is simple economics. The main take away is again around Wyckoff theory for me and the fact the "invisible hand" is exactly why and how some fail and some profit.
"The Go-Giver"
Although not technically a trading book, it's one of the best little business/life stories.
self-help book co-authored by Bob Burg and John David Mann. Published in 2007, it presents a unique and compelling philosophy on success and achieving one's goals.
The book revolves around the story of a young, ambitious professional named Joe who is seeking success in his career. Through a series of encounters with a mentor named Pindar, Joe learns the "Five Laws of Stratospheric Success." These laws, which are principles of giving, value, influence, authenticity, and receptivity, guide him on a transformative journey toward becoming a true "go-giver."
The way I saw this from a trading perspective is pretty much, the value given by stocks or companies is something Warren Buffet and Benjamin Graham investment theory was all about. Although a different type of value - you can understand why instruments such as gold or oil have a place, a value and this can be deemed as expensive or fair at any given point. These waves are what really moves the market.
"The Zurich Axioms"
A book written by Max Gunther, originally published in 1985. This book offers a set of investment and risk management principles derived from the wisdom and practices of Swiss bankers in Zurich. The Zurich Axioms provide a unique and unconventional approach to investing and wealth management.
The book presents a series of investment "axioms," or guidelines, that challenge conventional wisdom in the world of finance. These axioms emphasize risk management, flexibility, and the willingness to take calculated risks. They encourage investors to think independently and avoid the herd mentality often associated with financial markets.
For me it's more about investing and less about trading. But the deep down message is all to do with ultimately wealth preservation, I have been in the wealth management and investment space and found it interesting that the more an investor has, the less about making money it becomes and more about safe guarding that capital it gets.
"Mastering the Market Cycle: Getting the Odds on Your Side"
Written by Howard Marks, a renowned investor and co-founder of Oaktree Capital Management. Published in 2018, the book delves into the critical concept of market cycles and provides insights on how investors can navigate them to enhance their investment strategies.
In the book, Marks emphasizes the cyclical nature of financial markets and discusses the inevitability of market fluctuations. He explores the factors and indicators that drive market cycles, such as economic data, investor sentiment, and market psychology. Marks' central thesis is that investors can improve their chances of success by understanding where they are in the market cycle and adjusting their investment decisions accordingly.
I had a spooky delve into market cycles, I have a good friend who told me he did not trade price, instead time. This was something I could not really figure out, but was so fascinating that the markets can work in cycles. It was interesting that Larry Williams also discussed a similar thing with the Orange Juice market's in one of his books.
"How I Made One Million Dollars Last Year Trading Commodities"
And here is Larry Williams' book. provides an insider's perspective on his successful journey as a commodities trader. In this book, Williams shares his personal experiences, strategies, and insights into the world of commodity trading. He outlines the specific techniques and tactics he used to achieve remarkable profits in a single year. While the book may not offer a guaranteed formula for success, it offers valuable lessons on risk management, market analysis, and the psychology of trading. It serves as both an inspiration for aspiring traders and a guide for those looking to improve their trading skills in the volatile world of commodities.
For me, the COT intel is invaluable. When you learn what drives markets really, COT is such a useful tool to have at your disposal.
"Nature's Law: The Secret of the Universe"
A groundbreaking book by Ralph Nelson Elliott, the creator of the Elliott Wave Theory. Published in the early 20th century, this influential work introduced a novel perspective on market analysis and price prediction. Elliott's theory posits that financial markets and other natural phenomena follow a repetitive, fractal pattern that can be analyzed through wave patterns. He outlines the concept of impulsive and corrective waves and demonstrates how these waves form trends in various financial markets.
The book delves into the idea that the market's movements are not entirely random but instead exhibit an underlying order, governed by these wave patterns. Elliott's ideas have had a profound impact on technical analysis and have been adopted by traders and analysts worldwide. "Nature's Law" serves as the foundation of the Elliott Wave Theory, offering valuable insights for anyone interested in understanding and predicting financial markets based on natural patterns and mathematical principles.
If you want to learn about Elliott Waves - here it is from the horse's mouth as they say.
"Master the art of Trading"
By Lewis Daniels - Master the Art of Trading trader, offers a quick, easy, and comprehensive roadmap to trading. It explores the grand theories and behavioural economics underpinning the markets, from Elliot Wave Theory to Composite Man. It unpicks visual data, such as candlestick graphs and trend lines. It equips readers with the correct tools to make sense of the data and to make better trades. And it helps readers uncover their innate strengths, realise their propensity for risk, and discover what sort of trader they are - on order to optimise their behaviour to make them as effective as possible.
This book puts together all of the core trading requirements from the basic trendline through to psychology and technical techniques.
"The Intelligent Investor"
a classic and highly influential book on the subject of value investing, written by Benjamin Graham and first published in 1949. Graham, a renowned economist and investor, is often considered the "father of value investing."
The book offers a comprehensive guide to the principles and strategies of sound, long-term investing. Graham's central concept is the distinction between two types of investors: the defensive, "intelligent" investor and the speculative investor. He emphasizes the importance of conducting in-depth analysis and due diligence to make informed investment decisions, rather than engaging in market speculation.
I don't think any list of trading books is complete without this one! It's the Warren Buffer Holy Grail. For me, it's about risk management, finding value - especially with investments like value stocks. Using compounding interest and the factor of time to your advantage.
=====================================================================
I would be keen to get comments and other book recommendations from the trading community here on Tradingview.

Risk/Reward Ratios 101In trading, the risk/reward ratio stands as the beacon guiding every trader's decisions. But what exactly is this ratio, and how does it define your success in the market?
In this article we will describe how risk/reward ratio affects your trading performance.
If you appreciate our charts, give us a quick 💜💜
Understanding the Risk/Reward Ratio:
At its core, the risk/reward ratio quantifies the balance between the potential gain and the potential loss in a trade. It’s a critical tool that aids traders in choosing trades wisely, ensuring they opt for opportunities that promise high rewards while keeping risks minimal.
Calculating the Ratio:
The calculation itself is straightforward. By dividing the potential loss by the potential profit, traders can gauge the attractiveness of a trade. For instance, if a trade has a potential loss of $5 and a potential profit of $15, the risk/reward ratio would be 1:3, indicating that for every unit of risk, there's the potential for three units of reward.
Implementing the Ratio in Trading:
Successful traders plan their trades, setting predetermined entry and exit points. This strategy allows to calculate the risk/reward ratio accurately, ensuring trades with favorable ratios.
For instance, consider a scenario where a trader aims for a 15% profit and sets a stop-loss at 5%. By maintaining a discipline of setting targets based on market analysis rather than arbitrary numbers, traders can achieve a consistent profits.
The Synergy with Win Rates:
Combining the risk/reward ratio with win rates elevates a trader's strategy. A higher win rate indicates more successful trades, further enhancing the overall profitability. For instance, a trader with a 60% win rate can afford a lower ratio, say 1:1 minumum, as the majority of their trades are profitable.
The Power of the Risk/Reward Calculation:
The true power of the risk/reward ratio lies in its ability to provide traders with an asymmetric opportunity. This means that the potential upside is significantly greater than the potential downside, leading to more profitable trades over the long term.
Keeping Records for Improvement:
Maintaining a trading journal is crucial. By documenting trades, traders gain a comprehensive understanding of their strategies' performance. Analyzing these records aids in adapting strategies for different market conditions and asset classes, leading to refined decision-making.
In conclusion, mastering the risk/reward ratio is paramount for every trader aiming for consistent profitability. By understanding, calculating, and implementing this ratio alongside win rates, traders can make informed decisions, mitigate risks, and ensure sustainable success in the volatile world of trading. So, remember, in the world of trading, it's not just about how much you win; it's about how much you win concerning what you risk.

Do This And You Will Never Blow Your Accounts Again, Or PropfirmHello guys, in this video, I reveal the secret strategy I use for trading which helps me not to blow any account in forex trading.
If you enjoy this video, give it a boost, drop a comment and follow me here on tradingview.

PUT TO BED: Trading VS GamblingIt’s a big debate that runs the financial market.
Is trading gambling?
Well I’m going to try put it to bed in just a few sentences.
There are two types of gambling.
Gambling by chance and total randomness like slot machines, lotteries, Bingo, Wheel of Fortune and flipping coins.
And strategic gambling which allows you elements of control of coming out with a probabilistic chance of winning.
I believe trading is a form of strategic gambling.
Let’s talk about the similarities between certain strategic gambling games and see how we can learn from them with trading.
Game #1: Trading and Poker: Skill, Strategy, and a Bit of Luck
In poker, each player gets a unique hand of cards.
To win, players must devise a strategy based on their understanding of the game, their observation of their opponents, and their willingness to take risks.
Players can choose to play, bet or fold.
The same principles apply to trading.
Traders have their ‘hand’ in the form of markets to choose to trade.
To yield profit, they must understand market trends, observe competitors’ behaviours, and manage risks.
In poker, one needs to know when to fold and when to bet aggressively.
In trading we have stop losses to get us out of the trade.
We have take profits to bank our wins.
We have volume choices of how much to buy or sell.
And we have the choice to stay out completely.
Poker also teaches the importance of emotional control and patience, which are crucial in trading, where emotional decisions can lead to significant losses.
Game #2: Trading and Roulette: Understanding Probabilities
Roulette is largely a game of chance where players bet on numbers, colours, or sets of numbers.
You choose whether you want to bet on red, black, even, odd, specific numbers and so on…
Although the outcomes are random, players can use probability to guide their decisions.
In trading, while certain market movements can’t be predicted with absolute certainty, we rely heavily on technical, fundamental, statistical analysis and probabilities to make trading decisions.
Trading, much like roulette, is where you need to diversify your positions and bets.
But instead of placing chips on certain numbers, we place deposits (margins) in the hopes of a probable outcome.
Game #3: Trading and Blackjack: Playing Against the Market (House)
Blackjack involves strategic decisions, where players decide to ‘hit’ or ‘stand’ based on their current hand and the dealer’s visible card.
The main goal is to try and get the cards we’re dealt to hit 21, be close to 21 or be closer to 21 than our opponent’s hand.
Bet too high past 21 and you burn.
In trading, technical analysis serves a similar purpose by predicting future market movements based on past data.
Bet too high with trading and you stand to lose a lot more.
And if you can’t count with Black Jack, then you have a much bigger disadvantage to the game.
If you don’t have strong and stringent money management principles, then good luck trying to maintain, preserve and protect your portfolio.
Game #4: Trading and Horse Racing: Know your horse!
Horse racing involves choosing the right horse based on its:
Form
Characteristics
Conditions of the race
Weather on the day
and other factors.
This is like trading. You need to understand each market you trade.
It has its own personality, form, movements, and style.
You also need to know which market is conducive for your trading portfolio.
And you need to choose the right stock or asset to trade based on its performance history, current market conditions, and other factors.
In horse racing, experienced bettors also diversify their bets across multiple races and horses to spread risk.
With trading we diversify our portfolios over different accounts, markets, sectors, instruments and types.
Game #5: Trading and Sports Betting: Predictive Analysis and Risk
Sports betting also works similar to trading.
You need to know how to analyse a team’s or player’s form, weather conditions, home and away records, and more to predict an outcome.
Whether it’s football, rugby or cricket – you need to know your team players, strategy and likelihood of who is to win what game.
Traders also conduct similar analyses, studying companies’ financial health, market trends, and technical indicators to predict market movements.
And as always, there are both risks that need to be calculated and managed for high probability successful outcomes.
So next time when someone tells you trading is just gambling. You tell them, they are right but it’s strategic gambling rather than gambling by chance.

The Mind of an Ego Trader – 10 ActionsWe always hear of the two most dangerous states of trading.
Fear and greed.
But I think there is one more state, that really drives a trader to financial collapse.
EGO.
Ego is thinking you’re always right where you ignore risk and caution.
It’s the voice in your head that tells you to make risky choices because you believe you know better.
To overcome being an ego trader, we need to go inside the mind of one.
Let’s start…
Ego traders overtrade
One of the most common pitfalls of ego trading is overtrading.
This is the act of buying and selling markets way more than you should.
They believe that the more they trade, the more profits they will make.
Solution:
Adopt a well-defined trading strategy and stick to it. You need to know how and where to enter your trades with strict risk management.
Remember, quality should always be prioritized over quantity.
Ego traders like to revenge Trade
Ego traders refuse to be wrong.
They’ll take a trade in one direction, bank a loss.
And then immediately get in again, but in the opposite direction – to make up for losses.
Their goal is not to trade well but to recoup any losses ASAP.
This behaviour is often driven by the ego’s inability to accept a loss. And this will drive them crazy until they blow a big portion of their account.
Solution:
Acceptance is key.
Every trader is going to take losses.
You need to take the loss (see it as the cost of trading), and come back the next day.
Take a step back, analyse the situation objectively, and stick to your trading plan.
Ego traders ignore risk management
Egotistical traders think like this.
“I want to grow rich quickly and refuse to only bank 3% to 4% of my portfolio per trade”.
They instead risk 5%, 10% and sometimes go full port.
They have this invincibility complex, that the more money they risk the more likely they’ll build their account quickly.
But this is reckless and your portfolio won’t last long. This will often lead to disproportionate losses.
Solution:
I sound like a parrot by now.
Always adhere to your risk management rules.
Determine your risk tolerance, set risk-reward ratios for your trades, and never risk more than you’re willing to lose on a single trade. You know this!
Dismiss Market Analysis
Ego traders are emotional.
They mainly trust their feelings, their jiminy cricket voices and their instincts over solid and proven market analysis.
This will obviously lead to discretionary trading decisions, which will eventually lead them with no strategy, no discipline, no rules, and no portfolio.
Solution:
Become a trading machine.
Think like a robot and always base your decisions on thorough market analysis.
This includes both technical analysis (price trends, indicators, etc.) and fundamental analysis (economic, financial, and other qualitative and quantitative factors).
Ego traders blame everything
Ego traders often blame the market, their broker, their children, the media, or unexpected news for their losses.
You need to grow up and take on the mature approach. Every financial decision and action you make, is solely your responsibility.
Solution:
Take responsibility for your actions.
Understand that the market is unpredictable and losses are a part of trading.
Don’t trade if you’re feeling distracted,
Don’t trade if you’re feeling you’ll blame something or someone.
Learn from your mistakes and learn to humble yourself before the market does.
Ego trader are trend top and bottom pickers
These are the guys that literally try to ‘predict’ bottoms or tops.
They go against the current trend, and instead guess that the price will turn from here.
They give you every reason why the market will turn.
They know privy info that no one else does (even though all info is in the public domain).
They know strategies and indicators that make these predictions (even though all indicators are based on past data).
They see and feel out of their asses about change in trends.
And when they’re wrong (which most times they are), they find every reason, news event and indicator to guess when the market will turn.
This usually results in entering at a bad price and subsequently facing a huge loss.
Solution:
Leave the tops and bottoms.
Seriously, ignore the first 10% of the bottom. Leave 10% of the top.
Claim the 80% market move when the trend has confirmed and is showing strong momentum.
Enjoy going with the trend not against it.
Ego traders over leverage
It confounds me that traders want more leverage.
They show off about 20 times, 50 times up to 500 times.
You know what that means right?
You can lose 20, 50 or 500 times the money you put in.
Leverage is a double-edged sword.
You desire the big wins and only think of the big wins.
When then you are wrong (and you will be), you end up losing a colossal amount.
Solution:
Use leverage responsibly.
Lower the leverage, the better you can manage your risk and reward management.
Ego traders disregard stop losses
Stop losses are designed to limit a trader’s loss on a position.
However, there are two types of ego traders.
The ones that trade naked (without a stop loss) and the trade goes heavily against them where they lose their hat.
Then there are the ones that put in their stop loss. But then they move their stop loss FURTHER away where they can risk more.
Once this happens, they marry into their trade.
And they’ll keep moving the stop loss away again and again and again and then BOOK.
Gone.
Solution:
First rule – Always set a stop loss.
Second rule – NEVER move your stop loss where you can risk more.
Super important.
Ego traders dismiss discipline
They have major commitment issues.
They choose their days and times.
They trade now and then when they feel like it.
And this dismisses the discipline of taking every trade, one needs to take to build a consistent portfolio.
Solution:
See trading as a business. See trading as a job.
See your trading strategy as your boss.
Work accordingly like your life and livelihood depends on it.
Discipline is key in trading.
Maintain your discipline and eventually it’ll turn into integration.
Then you’re sorted.
Ego traders fail to adapt
The market is constantly changing.
There are always new markets.
There are always new platforms.
There are always new brokers.
There are always new innovations and features.
And yet ego traders, stay put.
You need to learn to adapt to market changes.
You need to constantly update yourself as a trader, your strategy, your watchlist and stay with the times.
With discipline, a clear plan, and a bit of humility, traders can better navigate the markets and improve their chances of success.
Let’s sum up the Mind of an Ego trader so you know how to overcome it.
Ego traders overtrade
Ego traders like to revenge Trade
Ego traders ignore risk management
Dismiss Market Analysis
Ego traders blame everything
Ego trader are trend top and bottom pickers
Ego traders over leverage
Ego traders disregard stop losses
Ego traders dismiss discipline
Ego traders fail to adapt

Decoding DeFi MetricsIn Decentralized Finance (DeFi), deciphering the wealth of new projects can be akin to navigating uncharted waters. However, amidst the chaos, fundamental analysis stands as a beacon, guiding investors and traders towards discerning the true value of DeFi assets.
1. Total Value Locked (TVL):
TVL, the sum of funds nestled within a DeFi protocol, provides a vital glimpse into market interest. Whether measured in ETH or USD, it illuminates a protocol's market saturation and investor confidence.
2. Price-to-Sales Ratio (P/S Ratio):
In DeFi, just like traditional businesses, evaluating a protocol's value against its revenue stream offers a unique perspective. A lower P/S ratio suggests undervaluation, indicating a potential investment opportunity.
3. Token Supply on Exchanges:
Monitoring tokens on centralized exchanges unveils market dynamics. While a surplus may hint at sell-offs, complexities arise due to collateralized holdings, necessitating nuanced analysis.
4. Token Balance Changes on Exchanges:
Sudden shifts in token balances on exchanges signal imminent volatility. Large withdrawals hint at strategic accumulation, underscoring the importance of tracking market movements.
5. Unique Address Count:
More addresses usually imply widespread adoption. But beware! This metric can be deceptive. Cross-reference with other data for a clearer picture.
6. Non-Speculative Usage:
A token's utility is paramount. Assess its purpose beyond speculation. Transactions occurring outside exchanges signify genuine use, a testament to its value.
7. Inflation Rate:
While scarcity is a virtue, a token's inflation rate demands attention. Striking a balance between supply growth and value preservation is crucial, emphasizing the need for a holistic evaluation approach.
In the intricate DeFi landscape, these metrics serve as the foundations of strategic decision-making. Each data point unravels a layer of complexity, empowering investors to make astute choices. As you delve into the world of decentralized finance, armed with these insights thrive in the boundless universe of DeFi possibilities! 🚀💡
