Inflation's Impact on Stock ReturnsInflation's Impact on Stock Returns
Inflation's pervasive influence on the financial landscape cannot be understated. It affects everything from everyday spending to large-scale investing. This FXOpen article dives into the intricate relationship between inflation and stock returns, unravelling the multifaceted dynamics at play. Join us as we dissect the mechanics of the impact of inflation on the stock market, offering clarity in a world of economic ebbs and flows.
Understanding Inflation
Inflation represents the rising prices of goods and services over time. While a moderate level of inflation is often viewed as a sign of a growing economy, high inflation can erode purchasing power, making everyday items more expensive for consumers. Those trading and investing during high inflation face challenges as it can diminish the real returns on investments.
Stock Returns Defined
Stock returns denote the gains or losses an investor realises from stock investments. These returns typically manifest in two ways: dividends and capital appreciation. Dividends are regular payments made by corporations to shareholders from their profits.
Capital appreciation, on the other hand, refers to the increase in a stock's price over time. It's important to note that stock returns can also be negative if a stock's price decreases. Influencing these returns are a myriad of factors, including company performance, market sentiment, and broader economic conditions.
Mechanisms: How Inflation Affects Stock Prices
Inflation, with its overarching grip on the economy, wields a substantial influence on stock prices. Understanding this dynamic is vital for traders looking to navigate the stock market during inflation. Below, we'll delve into the various mechanisms through which inflation affects stocks.
Cost of Goods Sold and Company Profitability
When there's inflation, the costs of raw materials and production generally rise. This escalation can squeeze a company's profit margins unless they pass these increased costs onto the consumers. For some industries, hiking prices might result in decreased demand, further impacting profitability. Consequently, stock prices can see downward pressure as potential investors foresee lower earnings.
Consumer Purchasing Power
Inflation erodes the value of money, meaning consumers can buy less with the same amount of money as before. This diminished purchasing power can lead to reduced consumer spending. Companies, especially those in the retail and consumer goods sector, may witness a dip in revenue. As revenues play a crucial role in determining stock value, a decline can lead to lower stock prices.
Central Bank Responses and Interest Rates
Central banks often intervene to counteract high inflation, primarily by raising interest rates. When interest rates rise, borrowing becomes more expensive for companies, which can hinder expansion plans and reduce profitability. Additionally, when inflation and interest rates rise, alternative investments like bonds become more appealing than stocks, leading to reduced demand for stocks.
By grasping these mechanisms, traders can better anticipate inflation's effect on stocks and devise strategies that account for the intricate relationship between inflation and the stock market.
Inflation's Dual Impact: Sectors and Market Caps
The impact of inflation isn't uniform across the board; it varies significantly between sectors and company sizes. Certain sectors, like commodities or energy, might benefit from rising prices, turning inflation into an advantage. Conversely, retail or consumer goods sectors might suffer as consumers' purchasing power diminishes, leading to decreased spending.
When examining company sizes, the inflation rate and stock market dynamics reveal nuanced patterns. Large-cap companies, with their diversified operations and global reach, often have better tools to hedge against inflationary pressures. In contrast, small-cap stocks, which might be more regionally focused and have fewer resources, can be more vulnerable to the negative effects of high inflation.
Historical Perspective: Inflation and Stock Market Performance
Historical data provides traders with valuable insights into the dynamics between inflation and stock market performance. For instance, during the 1970s, the US experienced a period of stagflation—simultaneous high inflation and stagnant economic growth. This era saw the S&P 500 struggle to provide real returns, largely due to soaring oil prices and tight monetary policy.
Another example can be traced to emerging markets like Argentina in the early 2000s. Faced with skyrocketing inflation rates, the stock market initially surged as locals shifted money into assets to retain value. However, long-term sustainability was challenged by economic instability and a lack of foreign investments.
Mitigation: How Traders Can Prepare for Inflation
Inflation can unsettle even the savviest traders, but with proper preparation, its challenges can be mitigated.
When investing during inflation, diversifying assets becomes paramount. Spreading investments across different asset classes and instruments can act as a buffer against inflation's adverse effects. For instance, you can trade forex or commodity, cryptocurrency*, and ETF CFDs on FXOpen’s TickTrader platform and further equip yourselves with the real-time data and tools necessary to make effective decisions.
Additionally, stocks of companies with strong pricing power, which can pass on increased costs to consumers, might fare better than others. Moreover, bonds, especially those with interest rates adjusting to inflation, can be among the best investments during inflation, offering a degree of protection to portfolios.
The Bottom Line
In understanding inflation's intricate relationship with stock returns, traders arm themselves with valuable insights. To navigate these economic complexities and optimise trading strategies, consider taking the next step: open an FXOpen account, a trusted broker that provides the tools and resources to thrive in ever-evolving financial markets.
*At FXOpen UK and FXOpen AU, Cryptocurrency CFDs are only available for trading by those clients categorised as Professional clients under FCA Rules and Professional clients under ASIC Rules, respectively. They are not available for trading by Retail clients.
This article represents the opinion of the Companies operating under the FXOpen brand only. It is not to be construed as an offer, solicitation, or recommendation with respect to products and services provided by the Companies operating under the FXOpen brand, nor is it to be considered financial advice.
Fundamental Analysis

Mind Over Market: The Burden Of Continuous Chart WatchingNovice traders are often swayed by their emotions. Even when equipped with knowledge of technical and fundamental analysis, as well as risk management, individuals are invariably guided by psychological factors. This influence isn't limited to emotional extremes such as greed, excitement, or despair. It also encompasses feelings like curiosity, self-assertion, and the quest for validation of one’s decisions. While these feelings aren't inherently wrong, they do come with certain nuances.
One research agency conducted an analysis of a broker's database, choosing to keep the names confidential to avoid advertising. The agency itself noted that the research was intended for private insights rather than a comprehensive analysis. The primary objective was to identify the actions traders tend to take most frequently. The findings revealed that the most predictable action among traders is closing a position. Interestingly, market orders are closed twice as often as limit orders. This suggests that most traders tend to follow market trends and manually close their trades, which may conflict with established risk management principles. This fact has been termed the “Monitoring Effect”.
📍 WHAT IS THE MONITORING EFFECT?
The monitoring effect in trading describes a psychological phenomenon where excessive scrutiny of short-term market fluctuations leads to impulsive and often detrimental trading decisions. When a trader spends too much time staring at the chart, this constant observation distorts their perception of market movements. In essence, a trader who continuously monitors the chart may interpret the data differently than someone who examines it after a few hours of absence. This prolonged focus can create a skewed view of the market, resulting in rash choices that might not align with their overall trading strategy.
📍 NEGATIVE IMPACTS OF MONITORING EFFECTS ON TRADERS
• Overemphasizing Short-Term Information. Traders may place excessive importance on recent price movements or news events, leading them to make reactionary decisions. For instance, an impulsive urge to close a trade can arise from a fleeting negative signal, such as a false pattern or a false breakout, even if the overall trading strategy remains sound.
• False Perception of News. By constantly tracking news and events, traders can overestimate their significance, prompting rash decisions based on short-term fluctuations. This can lead to trades that are not aligned with long-term strategy or analysis.
• Frequent Position Changes. The urge to change positions often is exacerbated by constant monitoring. Traders may respond to momentary shifts in market direction, resulting in frequent reversals of positions. This behavior not only increases trading costs due to commissions and spreads but can also lead to overall reduced profitability. A trader may incur losses as they jump in and out of trades based on short-lived movements.
• Emotional Stress. Ongoing market observation can heighten emotional stress and lead to fatigue. As traders become more engrossed in monitoring, their ability to think clearly and make rational decisions diminishes. This emotional toll can distort judgment, further complicating the trading process.
• Increased Risk Appetite. Prolonged engagement with the market can result in an increased appetite for risk. As traders become accustomed to fluctuations, they may become more willing to take on higher-risk trades, often without a solid foundation in their analysis. This increased risk tolerance can lead to larger potential losses, especially if the market moves against them.
To watch the chart or not to watch the chart? The monitoring effect has some positive aspects. Firstly, you train your skills of instant reaction to an event. Secondly, you learn to quickly recognize patterns and find levels.
📍 TIPS TO MANAGE CHART MONITORING
1. Wait After News Releases
Avoid Immediate Reaction. It’s crucial to refrain from making quick trades immediately after major news releases due to potential volatility and false spikes. Prices may not reflect fair value during that time, leading to uncertain outcomes.
Trade After the Dust Settles. Waiting for 30-60 minutes allows the initial market reaction to stabilize, providing a clearer market direction and reducing the likelihood of entering a trade based on erratic price movements.
2. Develop Psychological Stability
Practice Mindfulness. Engage in mindfulness techniques such as meditation or deep breathing exercises to enhance emotional regulation.
Set Realistic Expectations. Understand that losses are a part of trading and work on accepting them without letting them influence your emotional state.
Simulate Trading. Use demo accounts to practice trading strategies without real financial pressure, keeping emotions in check.
3. Focus on the Trading Process
Emphasize Strategy Over Outcomes. Concentrate on executing your trading plan and strategies instead of being fixated on profit and loss. This shift in mindset can reduce stress and enhance performance.
Track Your Progress. Regularly review your trades to identify patterns in behavior and decision-making, making adjustments as necessary without getting bogged down by the results of individual trades.
4. Avoid Unrealistic Goals
Set Achievable Milestones. Goals should be specific, measurable, and realistic based on your skill level and market conditions. Aim for gradual improvement rather than sudden leaps in performance.
Focus on Personal Growth. Compare your progress against your own benchmarks rather than against other traders, which can help foster a healthy mindset.
5. Use and Stick to a Trading Plan
Define Your Strategy. Clearly outline entry and exit strategies, risk management rules, and market conditions for trading. A well-structured plan reduces impulsive decisions.
Review and Adapt. Regularly review your trading plan to ensure it aligns with market conditions and your evolving trading style. Adjust it as needed, but avoid impulsive changes based on short-term outcomes.
To mitigate the effects of constant monitoring, traders are encouraged to develop a clear trading plan that includes well-defined rules for entering and exiting trades. Utilizing automatic stop losses and take-profit orders is essential for effective risk management. Additionally, setting specific time frames for checking trading positions can help avoid the pitfalls of incessantly watching the market. For instance, you might establish a schedule to check in on your trades five minutes after the start of each new hourly candle. The key is to cultivate the discipline to adhere to this schedule and resist the temptation to deviate from it.
📍 CONCLUSION
Everything is good in moderation. Long-term trading strategies do not require constant monitoring; instead, a quick five-minute check of the chart every few hours are often sufficient. Utilizing pending orders that align with your risk management guidelines can also enhance your trading approach. Taking breaks after each 1H candle can be beneficial. If there are no clear trading signals, allow yourself to step away from the chart for the duration of one hour. During this time, it's not necessary to search for signals on lower timeframes. Embracing this disciplined approach can help you maintain focus and improve your overall trading performance.
Traders, If you liked this educational post🎓, give it a boost 🚀 and drop a comment 📣

PIP VALUE IN CANADIAN DOLLARS (CAD) FOR FOREX x/7uHMm4Vr/
For the forex accounts with CAD balance, will help you to calculate the value of pips in different lot types. An important thing to understand before you place the trade.

Exploring Trading Basics: Expert Tips for New TradersWelcome to the thrilling world of trading, future market experts! If you’re stepping into this arena for the first time, it’s natural to feel both excited and a little overwhelmed. No worries — we’ve set up this nice value-packed TradingView Idea to make you feel at home. Read on for practical tips that will help you kick off your trading journey to a strong start. Ready, set, go? Let’s roll!
1. Get Yourself Familiarized
Action Step : Your first step as a fresh trader is to familiarize yourself with the market fundamentals. Start by getting a solid grasp of basic market concepts. Learn about different asset classes like stocks , forex , or crypto .
Understand how they work and what news or events influence prices across the board (spoiler: if you’re looking at the bigger picture and keep it high level, there aren’t too many things to consider — check the Economic Calendar Related Idea below). Spend an hour or two each week reading about market fundamentals. Knowledge of these basics will make you more confident in your trading approach and also help you see where you feel most comfortable putting your money. And don't forget about the trading psychology part .
2. Set Clear, Achievable Goals
Action Step : Write down your trading goals and stick them somewhere you can see them. Aim for specific, measurable targets like “Hit a 2% monthly return” or “Learn a new trading strategy weekly.” This keeps your efforts focused and on track.
But don’t stop there. Keep revisiting, updating, and refining your trading goals. Think of them as your compass or map that you need to follow in order to get where you want. In contrast, not having a goal or goals might throw you out in the open where you wander without a clear path or direction.
3. Stick to Your Budget
Action Step: Decide on your total trading capital and how much you’re willing to risk per trade. Use the 1-2% rule: never risk more than 1% or 2% of your total capital on a single trade. This will help you protect your account from total wipeout.
It’s easy to get swayed by some massive move in the market (yes, we know about Bitcoin BTC/USD ), but catching these waves is rarely an easy game. The better you are at sticking to a healthy level of risk exposure, the better your chances to stay in the game for as long as possible.
4. Stay Updated with Market News
Action Step : Dedicate 15 minutes each morning to checking financial news. Keeping tabs on major economic reports and events will give you an understanding of what investors regard as important so you can add it to your agenda too.
We’ve set up a nice and easygoing Top stories news stream that serves you only top-tier market-moving scoops, published daily and updated in real time. Make sure to frequent them so you can raise your level of knowing what’s happening in the markets.
5. Keep a Trading Journal
Action Step : For every trade, jot down the details in a journal. Include entry and exit points, your reasons for the trade, and the outcome. Review your journal weekly to identify patterns and areas for improvement.
If you want to get an even more precise look at your trading performance, add more columns to it and include prospect trades, or a watchlist of positions you’re interested in. Mark your monthly performance, year-to-date returns, and even how much you paid in commissions.
6. Start Small and Scale Up
Action Step : Begin with small trades to minimize risk while you’re learning. For example, if you have $1,000, start with trades of $50-$100 and keep your stop tight around the 2% mark. That way, you’ll gain experience and see how you feel when you have an open trade.
Leave a trade overnight, watch it actively or let it run for a few days (provided you use a stop loss , more on it in the Stop Loss Related Idea below) — all these will help you ease into smoother trading and build better confidence. After that, you can gradually increase your trade size for bigger profits. And — most importantly — don’t rush it. The markets will be there tomorrow; but will you?
7. Use Stop-Loss Orders
Action Step : Always set a stop-loss order when placing a trade. For instance, if you buy a stock at $100, set a stop-loss at $95. This means your position will be automatically sold if the price drops to $95, limiting your loss to $5 per share.
The use of stop-loss orders, or simply stop losses, can’t be emphasized enough. No matter how confident you are on a trade, how much conviction you have to go big, always think of the downside, or how much you’re willing to lose.
8. Join a Trading Community
Action Step : If you’re reading this, then you’ve already nailed this step. TradingView is the world’s largest finance, markets, and charting platform, boasting more than 60 million monthly visitors — one big, big community .
This is the place where traders share tips and strategies, show off their charts, discoveries, patterns, price targets, and trading ideas. So, stick around, engage, ask questions, and learn from the experiences of others.
9. Diversify Your Portfolio
Action Step : Spread your investments across different sectors and asset classes. Don’t just buy big tech stocks ; consider some auto companies as well or the volatile corner of cryptocurrencies.
Diversifying your portfolio (learn about it in the Diversification Related Idea below) will help you balance your risk, ideally without reducing the potential for returns. You don’t have to go all-in on a trade and YOLO your entire life savings into a Solana meme coin. Think of the long term and tread carefully. Sometimes, you’re as good as your last trade.
10. Continuously Improve Your Skills
Action Step : Dedicate time each week to learning something new about trading. Watch educational videos , read books, or dive into financial podcasts where big market events get broken down or where traders and investors share their experience and what made them successful.
The markets renew each day, never resting, never ceasing to oscillate and presenting new trading opportunities. Always learn, never get complacent, and keep striving for more!
Share Your Thoughts!
So there you have it, folks! With these practical, actionable tips, you’re ready to jump into the trading game with some added confidence. Remember, every pro was once a newbie. Stay cool, stay informed, and most importantly, have fun with it (but also be smart). Happy trading! 🚀📈

Understanding Tokenomics- Short Guide for Crypto InvestmentsEveryone dreams of finding that 100x crypto gem, but if you want to have a fighting chance beyond just buying random coins and praying that one hits, there’s one thing you need to do: master tokenomics. Tokenomics is the key to a crypto project’s price performance, and nearly every 100x crypto gem in history has had great tokenomics. This guide will teach you tokenomics from top to bottom, making you a savvier investor.
What is Tokenomics?
Tokenomics refers to the economic structure and financial model behind a cryptocurrency. It encompasses everything from supply and demand dynamics to token distribution and utility. Understanding these factors can give you a significant edge in identifying potential high-reward investments.
Supply and Demand
At its core, tokenomics boils down to two things: supply and demand. These two elements have a massive impact on a token's price. Even if a project has the best tech and marketing, it may not translate into great price performance unless it also has solid tokenomics.
Supply-Side Tokenomics
Supply-side tokenomics involves factors that control a cryptocurrency's supply. There are three types of supplies, but for the purposes of finding 100x gems, we focus on two: maximum supply and circulating supply.
Maximum Supply: This is the maximum number of coins that can ever exist for a particular project. For example, Bitcoin has a maximum supply of 21 million, which means there will never be more than 21 million Bitcoins in existence.
Circulating Supply: This is the amount of coins that are circulating in the open markets and are readily tradable. Websites like CoinMarketCap or CoinGecko can provide these values for most crypto projects.
Example: Bitcoin has a maximum supply of 21 million, making it a highly sought-after asset, especially in countries with high inflation. In contrast, Solana has a circulating supply of over 400 million but a maximum supply of infinity due to inflation, where the supply increases forever as the network creates more coins to reward miners or validators.
Inflation and Deflation
Inflation: Some projects have constant token inflation, where the supply goes up forever. While we generally prefer not to have inflation in tokenomics, some inflationary coins perform well as long as the inflation is reasonable. To determine if inflation is reasonable, convert the yearly inflation percentage to a daily dollar amount and compare it to market demand.
Deflation: Some projects have deflationary mechanisms where tokens are removed from circulation through methods like token burns. For example, Ethereum burns a part of the gas fee with every transaction, potentially making it net deflationary.
Rule of Thumb: Prefer projects with deflationary tokenomics or a maximum supply. Some inflation is okay if it’s reasonable and supported by market demand.
Market Cap
Market cap is another critical factor, defined as circulating supply multiplied by price. To find coins with 10x or even 100x potential, look for ones with lower market caps. For instance, a cryptocurrency with a market cap under $100 million, or even under $50 or $10 million, offers more upside potential but also carries more risk.
Example: Binance Coin (BNB) has a market cap of around $84 billion 579 USD at the time of writing). For a 10x gain, it would need to reach a $870 billion market cap, which is highly unlikely anytime soon. Hence, smaller projects with lower market caps are preferable.
Unit Bias
The price of the token can affect its performance due to unit bias, where investors prefer to own a large number of tokens rather than a fraction of a more expensive one. This psychological phenomenon makes smaller unit prices preferable for 100x gems, assuming all else is equal.
Fully Diluted Value (FDV)
FDV is calculated as maximum supply times price. Be cautious of projects with a large difference between their market cap and FDV, as it indicates potential future dilution. A good rule of thumb is to look for an FDV of less than 10x the current market cap.
Trading Volume
High trading volume relative to market cap ensures that the market cap number is reliable. A volume-to-market-cap ratio above 0,001 is decent.
Initial and Current Distribution
Initial Distribution: Check how widely the tokens were initially distributed. Avoid projects where a significant percentage of tokens are held by founders or venture capitalists.
Current Distribution: Use tools like Etherscan to analyze the current distribution of tokens. Look for a large number of unique holders and a low percentage held by the top 100 holders.
Vesting Schedule: Analyze the vesting schedule to understand when team or investor tokens will be unlocked, as these can impact the token's price.
Demand-Side Tokenomics
Demand-side tokenomics refers to factors that drive demand for a token, such as its utility and financial incentives.
Token Utility
The primary driver of demand is a token’s utility. Strong utilities include:
Paying for gas fees on a network
Holding to access a protocol
Getting discounts on trading fees
Governance tokens generally lack strong utility unless they are actively used and valued by the community.
Financial Incentives
Staking rewards and profit-sharing models, like those offered by GMX, incentivize holding tokens long-term. Sustainable financial incentives drive demand.
Growth and Marketing Allocation
Allocations for growth initiatives, such as influencer marketing, community rewards, or airdrops, help generate demand indirectly. Look for projects with healthy allocations for growth and marketing.
Conclusion
Tokenomics is the most crucial factor in analyzing and finding potential 100x crypto gems. However, other aspects like the underlying technology, marketing, and community also play significant roles. Combining a thorough understanding of tokenomics with broader fundamental analysis will enhance your investment decisions.

DON’T Look at a screen all day! - Here's whyStop Watching Your Trades All Day
Have you ever found yourself glued to your screens, watching every tick of the market, and feeling the stress levels rise?
If so, you’re not alone.
You might find it productive and what is essential but it’s actually a more dangerous habit than you might think.
Watching every tick will rise your cortisol (stress) levels.
It might cause you to take impusive trades.
And you might adjust your trading levels when you shouldn’t.
And so in this piece of writing I’m going to show you why you should stop watching the screens all day.
The Cortisol Rush
Every time you check the market and see a fluctuation in your trades, your body responds by releasing cortisol, the stress hormone.
While cortisol is useful in fight-or-flight situations, in trading, it can lead to quick and unnecessary decisions.
And you’ll end up taking more lower probability trades than you should.
It’s time you lead a more balanced, stress free and calmer trading life.
Distraction from Higher Priorities
Trading should be a part of your life, not the entirety of it.
You shouldn’t obsess over every market movement.
Your job is to wait for high probability trades to line up, take them and then let the market take over.
Also, you the trick is to focus on other vital aspects of your life like: family, health, and even your full-time job if you have one.
Balance is key to sustain success in both your personal and professional life.
Now there are a number of benefits when NOT looking at a screen all day.
Benefit #1: Beter Decision-Making
When you’re not constantly reacting to market volatility, you have more time to analyze your strategies and make more informed decisions.
This way you can priortise in what is absolutely needed to act on when you do trade.
Benefit #2: Improved Quality of Life
Life is NOT just about trading.
So once you’ve taken a trade and reduced your screen time, you will be able to free up time for other activities that enhance your well-being.
I’m talking about things like exercise, hobbies, and time with loved ones.
A well-rounded life supports better mental health, which in turn can improve your trading performance.
Benefit #3: Increased Productivity
Believe it or not, spending less time watching your trades can actually make you more productive.
You will also have the right amount of energy and focus to set specific times to check the market and stick to a trading plan.
Time management is everything.
This disciplined approach can lead to better outcomes than erratic, all-day monitoring.
So how do you use your time for when you trade?
ACTION #1: Use Alerts Wisely:
Analyse and set up your trading alerts for specific price levels, when your strategy lines up or wait for my trading ideas where I do all the work for you.
Let technology or a mentor help you t so you don’t have to watch the markets to do the monitoring for you.
ACTION #2: Create a Balanced Schedule:
You should also take the time to Incorporate other important activities into your daily schedule.
This could include exercise, reading, or spending time on a hobby.
It’s all about creating a healthy work-life balance.
ACTION #3: Check and review your Trading Plan Regularly:
When you review and check your trading track record and journal, this will tell you whether you’re on the right path to growing your portfolio.
You need to base this time on looking at the stats, metrics, seeing the mistakes you made.
And where you are with your trading in total.
This only requires you to do this once a week or so.
And it will reduce the time you think you need to constantly check the markets.
FINAL WORDS:
As I always like to say sometimes less is more.
Drop the screen time and focus on what is important.
Lower your stress and keep to a well-balanced trading life.
This way you’ll be able to integrate trading in a more effective and profitable way.
Trade well, build wealth.

Managing Portfolio Drawdowns EffectivelyDrawdowns, or peak-to-trough declines in portfolio value, are inevitable in investing and portfolio trading. However, managing these drawdowns effectively can significantly enhance long-term returns and reduce stress for investors and traders alike.
1️⃣ Implementing Stop-Loss Strategies
Stop-loss orders are one of the most straightforward and effective ways to manage drawdowns on long term investment portfolios. These orders automatically sell a security/asset when its price falls to a predetermined level, thus limiting potential losses.
Example: If you hold a long position in EUR/USD at 1.2000 and set a stop-loss order at 1.1950, your maximum loss is limited to 50 pips. By consistently applying stop-loss orders, you can prevent small losses from escalating into significant drawdowns.
2️⃣ Utilizing Trailing Stops
Trailing stops are a dynamic form of stop-loss orders that adjust as the price moves in your favor. This allows you to lock in profits while still providing downside protection.
Example: If you set a trailing stop 100 pips below the current market price for a long position in gold futures, the stop price will move up as the market price increases. If gold rises from $2,300 to $2,350, the trailing stop will adjust from $2,200 to $2,250, thus protecting your gains.
3️⃣ Damage Control Hedging
Hedging involves taking offsetting positions in different assets (or sometimes on the asset itself) to mitigate risks. For mixed portfolios, this can include using instruments across forex, commodity, or indices to hedge against adverse price movements on any given position.
Example: If you have a substantial long position in crude oil and expect short-term volatility, you can buy put options on crude oil futures or take a position in an inversely correlated asset. This hedge will protect you from downside risk while allowing you to benefit from potential upside movements.
4️⃣ Risk Parity Allocation
Risk parity aims to allocate capital based on the risk contribution of each asset, rather than traditional capital allocation. This approach ensures that each asset contributes equally to the portfolio's overall risk, thereby reducing the impact of any single asset's drawdown.
Example: In a portfolio containing forex, commodities, and indices, you would adjust the position sizes so that the volatility of each position contributes equally to the portfolio's total risk. This might mean reducing exposure to more volatile assets like commodities and increasing exposure to less volatile indices.
5️⃣ Diversification Across Uncorrelated Assets
Diversification is a fundamental risk management strategy that involves spreading investments and trades across different assets to reduce the overall risk. Including uncorrelated assets in your portfolio can significantly reduce drawdowns.
A portfolio diversified with forex pairs, commodities like gold and crude oil, and equity indices can weather market turbulence better than a concentrated portfolio.
6️⃣ Volatility Targeting
Volatility targeting involves adjusting portfolio allocation to maintain a consistent level of volatility. This strategy helps in managing drawdowns by scaling exposure up or down based on market volatility.
Example: If market volatility increases, you reduce your positions in forex, commodities, and indices to keep overall portfolio volatility at a target level, such as 10%. Conversely, if volatility decreases, you can increase your exposure. This approach helps in avoiding significant drawdowns during volatile periods.
7️⃣ Regular Portfolio Rebalancing
Regular rebalancing involves adjusting the weights of assets in a portfolio to maintain a desired allocation. This ensures that no single asset class disproportionately affects the portfolio’s performance, reducing unwanted overexposure. You can do the same within asset classes themselves, by looking at currency exposures individually within the FX portion of your portfolio.
Example: If your target allocation is 40% forex, 30% commodities, and 30% indices, and forex performs exceptionally well, growing to 50% of the portfolio, rebalancing would involve selling some forex positions and buying more commodities and indices to restore the original allocation. This practice not only locks in profits but also reduces the risk of drawdowns from overexposure to a single asset class.
Effective drawdown management is crucial for maintaining a resilient and profitable investment portfolio. By implementing techniques such as stop-loss strategies, trailing stops, hedging and washing, risk parity allocation, diversification, volatility targeting, and regular rebalancing, you can significantly mitigate risks and enhance long-term returns.

Insider Knowledge: Exploiting the House Money EffectIntroduction
In trading and investing, psychological biases significantly influence decision-making. One such bias is the "House Money Effect." Understanding this effect can help traders avoid common pitfalls and take advantage of this phenomenon.
What is the House Money Effect?
The House Money Effect is a psychological phenomenon where individuals are more likely to take risks with money they have won rather than their initial capital. In trading, this means traders become more risk-tolerant after experiencing gains, treating profits as "house money" and taking on higher risks than they would with their own capital.
Why Does It Happen?
The House Money Effect occurs due to several psychological factors:
Mental Accounting : People tend to treat money differently based on its source. Profits are often seen as less valuable than initial capital.
Overconfidence : After a winning streak, traders may become overconfident in their abilities, leading to riskier trades.
Loss Aversion : Gains are perceived as a buffer, reducing the fear of losses and encouraging riskier behavior.
Example of the House Money Effect on Crypto
In the 2021 Crypto Bull Market, we saw Bitcoin soar to all time highs. This subsequently caused many altcoins to rally really hard resulting in some 100-500x and numerous 2-3x tokens. If you observed at what point in the timeline this happened, this happened towards the end of the bull run, when everyone already knew about crypto and everybody was seemingly getting rich by buying cryptocurrencies. This was the peak of retail activity, which includes newcomers as well as those who got rich from holding tokens earlier.
This is a perfect example of the phenomenon with several key characteristics
Was after a period of extreme gains
Was causing risk assets to outperform, suggesting a higher risk tolerance in the market
Immediately after the markets tanked, clearly indicating this was a massive retail loss
By understanding and spotting the House Money Effect, traders can better manage their emotions and make more rational trading decisions. Recognizing this bias is the first step toward mitigating its impact and maintaining a disciplined trading strategy. We hope you enjoyed reading this idea.

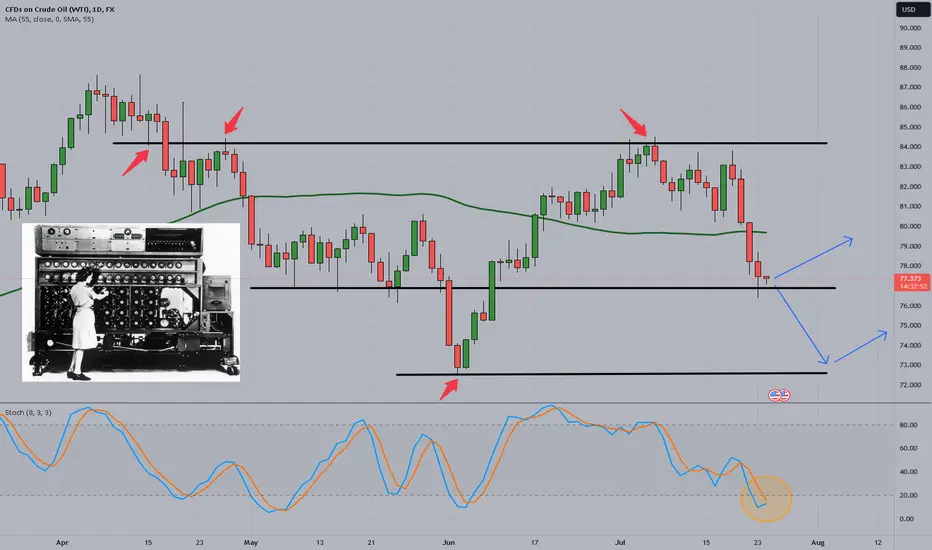
why you should avoid trading after a trending marketHello traders,
I saw This learning post today in the London session(24-7-24).
you can go for 5 minutes to understand this concept better, you can see a clear pattern on the chart, trending -> sideways/choppy -> trending -> sideways/choppy.
in the trending market, you see fast movement; in the choppy market, you see lots of SL hunting and wicks.
try to avoid such a market so you can make money in trending.
Note : not a finance advice

Looking to start your day with an edge in trading?Good morning FX traders! 🌍 Looking to start your day with an edge in currency trading? Here's the best way to read market sentiment every morning:
1️⃣Economic calendar: Begin by checking the economic calendar for scheduled releases of important economic indicators, such as interest rate decisions, employment data, inflation figures, and GDP reports. These events can shape currency sentiment. Compare overnight data to your previous session's baseline bias.
2️⃣Central bank communications: Monitor upcoming and review overnight statements, speeches, and press conferences from central banks, especially those of major economies. Central bank actions and policymakers' comments can heavily influence currency market sentiment. Here too, compare your new bias to previous baseline to see if anything has changed.
3️⃣Technical analysis: Utilize technical tools like support and resistance levels, trendlines, and Fibs to analyze currency pairs' price action. Patterns and key indicators like RSI, Stochastics or MACD can offer insights into market sentiment. Reading price action momentum is important in order to come up with the best trade ideas. TradingView makes this extremely easy!
4️⃣Sentiment indicators: Keep an eye on sentiment indicators specifically tailored for currency markets, such as the COT report (Commitments of Traders), which reveals the positioning of large traders in futures markets. It can indicate prevailing sentiment. You can also use Central Banks odds trackers (such as FEDwatch), the FEAR/GREED meter and your own risk reading markers (I mostly use equities, Yen, commodity currencies and bond yields).
5️⃣News wires and social media: Follow trusted news wires and forex-focused social media accounts to stay updated on geopolitical developments, breaking news, and market chatter. This can provide valuable context and sentiment analysis, especially if you cannot afford a squawk service.
Remember, currency market sentiment is influenced by a multitude of factors. Stay well-informed, evaluate various sources, and trust your own analysis. Adapt swiftly and make prudent trading decisions. Wishing you profitable trades this week!
5 tips for building a professional trading mindsetHey traders
Building a professional trading mindset is crucial for success in the forex market. Here are five tips to help develop and maintain a professional approach:
1 . Develop Discipline and Patience:
Stick to a Trading Plan: Develop a detailed trading plan that outlines your strategies, risk management rules, and goals. Adhere to this plan consistently to avoid impulsive decisions.
Be Patient: Understand that success in trading doesn't happen overnight. Be patient and wait for the right trading opportunities that align with your plan.
2 . Embrace Continuous Learning:
Stay Informed: Keep up-to-date with market news, economic indicators, and geopolitical events that can impact the forex market.
Learn from Mistakes: Analyse your trades, both successful and unsuccessful, to identify what worked and what didn’t. Use this knowledge to improve your strategies.
3 .Manage Emotions:
Stay Calm Under Pressure: Trading can be stressful, especially during volatile market conditions. Practice techniques to manage stress and maintain a clear, focused mind.
Avoid Overtrading: Don’t let emotions drive you to overtrade. Stick to your trading plan and avoid chasing losses or getting overly greedy after wins.
4 . Implement Strong Risk Management:
Use Stop-Loss Orders: Protect your capital by setting stop-loss orders to limit potential losses on each trade.
Diversify Trades: Avoid putting all your capital into a single trade.
Diversify your trades to spread risk across different currency pairs or financial instruments.
5 . Set Realistic Goals and Expectations:
Define Clear Objectives: Set specific, measurable, achievable, relevant, and time-bound (SMART) goals for your trading activities.
Understand the Learning Curve: Recognise that becoming a successful trader takes time and effort. Set realistic expectations regarding your progress and returns.
By incorporating these tips into your trading routine, you can build a professional mindset that enhances your decision-making, improves your performance, and increases your chances of long-term success in forex trading.

What Is Yield Farming In Crypto? Yield farming can be likened to traditional bank deposits, where an investor puts in money and earns returns over time. However, in the world of cryptocurrencies, the concept takes on a more complex form. Yield farming is a broad term that encompasses various activities, including liquidity mining and staking. While these methods share similarities, they differ in their objectives, such as whether they involve issuing new tokens or not.
📍 HOW YIELD FARMING WORKS
Yield farming is a way for cryptocurrency holders to generate income by lending or providing liquidity to decentralized financial (DeFi) protocols. By contributing their assets, users can earn rewards in the form of additional tokens or interest income. This opportunity allows individuals to participate in the DeFi ecosystem and benefit from the growing demand for decentralized financial services.
📍 THE PROCESS:
1. Providing liquidity: Users deposit their cryptocurrency assets into liquidity pools on the DeFi platform, which facilitates various financial transactions such as token exchanges, lending, and borrowing.
2. Earning rewards: In return for providing liquidity, users receive rewards, including:
Commissions from transactions passing through the liquidity pool
Native tokens of the platform (e.g. management tokens)
Additional tokens through various incentive programs
📍 EXAMPLES OF DEFI PLATFORMS:
Uniswap: A decentralized exchange (DEX) where users deposit tokens into liquidity pools, earning commissions on each transaction made through these pools.
Compound: A lending platform where users can lend their cryptocurrencies and earn interest on their deposits. Borrowers pay interest on the use of these assets, providing a revenue stream for lenders.
Aave: A platform that allows users to earn interest on deposited assets and use them as collateral for loans, providing a dual income stream.
SushiSwap: A DEX similar to Uniswap, but with an additional twist - liquidity providers are rewarded with SUSHI tokens, providing an additional incentive to participate in the platform.
📍 MAKING PROFIT IN DEFI:
1. Analyze and Choose a Platform: Select a reputable platform with a stable income stream. Carefully review the terms and conditions of liquidity provision to ensure you understand the risks involved.
2. Diversify Your Assets: Spread your investments across multiple platforms and pools to minimize risks. This will help you ride out market fluctuations and potential platform-specific issues.
3. Optimize Your Strategy: Continuously compare different pools and platforms to find the best terms for your investments. Some platforms offer combination strategies that can help maximize returns.
4. Monitor and Adapt : Regularly review your investments and adjust your strategy as market conditions change. This will help you stay ahead of the game and mitigate potential losses.
📍 RISKS OF YIELD FARMING:
• Technical Risks: Smart contract vulnerabilities can lead to irreversible losses, compromising the security of your funds.
• Market Risks: Cryptocurrency price fluctuations can impact your income. In many cases, you're unable to withdraw your funds immediately, leaving you vulnerable to potential losses if token values decline.
• Liquidity Risks: Low liquidity in pools can result in significant spreads and reduced returns, limiting your earning potential.
• Platform Risks: The risk of platform hacking or closure can result in the loss of your invested funds, leaving you without access to your assets.
📍 CONCLUSION
While yield farming can be an attractive option for earning additional income, one of the most significant risks is the potential for a price drop and the inability to quickly withdraw your locked coins. However, for those who have a long-term perspective and plan to hold their cryptocurrency for at least a year or more, temporary drawdowns are unlikely to significantly impact their overall returns. On the other hand, yield farming offers the possibility of generating significant additional income, potentially exceeding 10-15% per year. By carefully weighing the risks and rewards, investors can make informed decisions about whether yield farming is a suitable strategy for their investment goals.

My Latest Open Source Indicator: Stef's Dollar Volume CounterStef's Dollar Volume Counter is my second script that I've worked on and coded. It is free and open source for everyone! Get it here:
I am proud of this script because it does something very, very important: it counts the amount of money traded, not just the number of shares or contracts. In this educational post, I want to share why I think it matters and explain some concepts of markets along the way.
1. This is key for understanding where the big and small money is flowing in the market. By focusing on the dollar volume, traders can gain insights into liquidity and significant money movements over time.
2. Watch the money, not the shares. This script is totally different from other volume scripts because it shows the amount of money traded, not just the shares, contracts, or coins. More importantly, it stands out from other volume indicators because it specifically showcases dollar volume amounts either as a table or a label. This focus helps traders track the sheer money movements.
3. Know your perspective! I personally am most pleased with two important features that the indicator offers: it shows the Dollar Volume Counter table that illustrates the highest and lowest and average dollar volumes over a specific period that YOU can customize in the settings menu.
Fun little feature: In the spirit of Doge, I added a text lable that says "Wow! Much Money!" which highlights the top three recent highest dollar volumes within the visible chart area, emphasizing significant trading periods. You can toggle this on or off in the settings menu.
Thanks for reading! I look forward to hearing your feedback.

THE CORRELATION BETWEEN FOREX & COMMODITIESThe Correlation Between Forex Currencies and Commodities🌟
🔰The interplay between forex (foreign exchange) markets and commodities is intricate and multifaceted. Understanding these connections can provide valuable insights for traders and investors. Here are some key points to consider👇
🔰Commodity Pairs (Commodity Currencies):
Certain currency pairs are closely tied to changes in commodity prices. These pairs are often referred to as “commodity pairs” or “commodity currencies.”
🔰Commodity currencies come from countries with substantial commodity reserves. These nations produce and export various commodities, which significantly influence their economies.
⭐The three primary commodity currencies are👇
🔰Australian Dollar (AUD): Australia is a major gold producer, and its currency tends to correlate with gold prices. Additionally, Australia exports other commodities like iron ore and coal!!
🔰Canadian Dollar (CAD): Canada is a significant exporter of oil, making its economy sensitive to oil prices. The CAD is closely linked to crude oil!
🔰New Zealand Dollar (NZD): New Zealand’s economy is also tied to commodities, particularly dairy products. Hence, the NZD has correlations with dairy prices.
❗Other currencies, such as the Swiss Franc (CHF) and the Japanese Yen (JPY), are impacted by commodity prices but exhibit weaker correlations. For instance, the CHF and JPY tend to rise when commodity prices fall.
⭐Understanding Correlations👇
🔰Currency traders can capitalize on the fact that specific currencies tend to move in sync with commodity prices. This alignment often occurs when a country’s economy heavily relies on natural resources.
🔰When commodity prices rise, the currencies of resource-dependent countries tend to strengthen, and vice versa.
🔰Monitoring correlations in real-time is crucial. There are times when relationships break down, and failing to recognize these shifts can be costly for traders.
🔰Traders should consider factors like commissions, spreads, liquidity, and access to information when deciding which currency/commodity relationships to trade.
⭐Examples of Correlations👇
🔰CAD/JPY (Canadian Dollar vs. Japanese Yen): Canada’s economy is significantly affected by oil prices due to its oil exports. Japan, on the other hand, is a major oil importer. As a result, the CAD/JPY positively correlates with oil prices. Traders can monitor this pair along with the USD/CAD.
🔰USD/CAD (US Dollar vs. Canadian Dollar): Since oil is priced in US dollars globally, fluctuations in the dollar impact oil prices (and vice versa). Both the US and Canada are major oil importers and exporters, making the USD/CAD relevant for tracking oil-related movements.
AUD/USD (Australian Dollar vs. US Dollar): Australia’s strong ties to gold production and other commodities create a correlation between the AUD and commodity prices.
🔰NZD/USD (New Zealand Dollar vs. US Dollar): New Zealand’s dairy exports influence the NZD’s movements.
⭐Using Correlation Indicators👇
🔰Traders can employ correlation indicators to visualize real-time correlations between commodities and currency pairs over specific periods.
🔰These indicators help capture small divergences and provide insights for trading decisions.
In summary, the relationship between forex and commodities is dynamic. Changes in commodity prices can impact currency values, and understanding these interconnections can enhance your trading strategies. Remember to stay informed, monitor correlations, and adapt to market shifts! 🌟

High-Impact News Trading StrategiesHigh-Impact News Trading Strategies
Trading in the dynamic world of foreign exchange demands a constant adaptation to the ever-evolving factors influencing currency markets. Among these factors, high-impact forex news stands out as a catalyst capable of reshaping market action. In this article, we explore some of the nuances of high-impact news trading, aiming to offer insights that may help manage high volatility and harness its power.
Trading High-Impact News
Understanding which news releases wield significant influence over the forex market and what market reaction can be expected is paramount for any trader.
Forex News with High Impact
High-impact news includes events like interest rate decisions, inflation rates, retail sales, consumer spending, labour market data, and nonfarm payroll reports. The impact of these events can be profound, affecting market sentiment and, thus, currency values. Traders keen on mastering this domain must comprehend the dynamics that drive market reactions to such news and position themselves accordingly. It's important to note that these news events can cause extreme volatility in either direction, creating both challenges and opportunities.
Forex News Impact Analysis
Traders analyse the potential impact of events on currency pairs, employing a combination of technical and fundamental analysis.
Fundamental Impact of Economic Data
Fundamental analysis involves evaluating the economic factors that underpin a currency's value based on the country's economic health. Traders delve into the consensus forecast, scrutinise historical data, and gauge the prevailing economic climate to gain insights into how these fundamental elements might shape market reactions.
Technical Analysis
Simultaneously, technical analysis plays a vital role in deciphering the market sentiment and potential price movements. Utilising technical analysis tools such as indicators, support and resistance levels, and trendlines, traders can identify key entry and exit points. By integrating technical analysis, traders gain a more comprehensive view of the market, potentially enhancing their ability to make informed decisions.
Forex News Trading Strategies
Considering the expected impact of economic data and utilising advanced technical analysis tools based on past forex rates performance, traders can design viable trading strategies at times of major news releases.
Retracement Trading: Unveiling Potential Reversals
Retracement trading is a strategic approach that capitalises on market pullbacks following significant movements triggered by high-impact news. Look at the example of trading on the US CPI announcement in November 2023:
- Fibonacci Retracement: Helps identify key support and resistance areas where price corrections may occur.
- Moving Averages: The 9- and 20-period MAs can be applied as a trend confirmation.
Entry
Traders identify significant Fibonacci retracement levels, typically 38.2%, 50%, 61.8%, or 78.6%, and look for alignment with a bullish/bearish MA crossover to confirm entry points for a long/short position.
Stop Loss
Stop loss may be placed just below (for long positions) or above (for short positions) the identified Fibonacci retracement level to safeguard against unexpected market reversals.
Take Profit
A potential signal for a take-profit point could be an MA crossover in the opposite direction of a trade following a failed attempt of the price to break a resistance/support level that coincides with a Fibonacci extension level.
Do you already have a strategy for the upcoming high-impact forex news today? Visit FXOpen and trade on the free TickTrader forex trading platform.
Trend-Change Trading Strategy
Trading during major news releases demands a nimble and precise approach to capitalise on medium-term price fluctuations. This strategy incorporates three technical indicators simultaneously to evaluate the strength of the price movement and determine potential entry and exit points. In this approach, we utilise:
- Relative Strength Index (RSI): Identifying overbought or oversold conditions.
- Stochastic Oscillator: Gauging the strength of a price trend.
- Average True Range (ATR): Measuring market volatility, helping to settle appropriate stop-loss levels.
Entry
Following a major price move on the news event, traders could identify weakness in an uptrend/downtrend by observing the divergence of both RSI and Stochastic indicators with the price movement. A potential entry for a long/short position involves aligning bullish/bearish signals from RSI and Stochastic, such as crossing above/below oversold/overbought areas.
Stop Loss
Stop loss could be placed just below recent lows or above recent highs for long and short trades, respectively, factoring in the ATR to account for potential market volatility.
Take Profit
Traders may determine possible take-profit points by considering bearish/bullish signals from RSI and Stochastics.
Exploiting Increased Volatility
Trading during high-impact news events requires a specialised strategy that accounts for increased market volatility. A sound volatility-based approach implements specific indicators so traders may be able to capitalise on rapid forex rate deviations. The chart shows trading on Japan’s industrial production data release at the end of October 2023, and we use:
- Bollinger Bands: These help identify potential surges in volatility through band expansion.
- ATR (Average True Range): This can be used for trailing stop-loss levels
- MACD (Moving Average Convergence Divergence): A surge in buying or selling pressure can be reflected in MACD crossovers.
Entry
Traders would monitor Bollinger Bands for an expansion preceding news events. Price cross above/below the middle Bollinger Band after the release may signal an entry point for long/short positions. This should align with a bullish/bearish MACD crossover.
Stop Loss
Traders may place stop-loss orders just beyond recent price extremes to account for potential market reversals and limit possible losses and use the ATR indicator to calculate trailing stop-loss levels.
Take Profit
A possible take-profit level for long/short trades can be derived from a bearish/bullish reversal of the MACD indicator, or it can be set based on the expected price range derived from the ATR.
Concluding Thoughts
Trading high-impact forex news requires a mix of market analysis, risk management, and strategic execution. By understanding the dynamics of high-impact events and implementing robust trading strategies, traders may navigate the volatility inherent in these situations. Ready to trade on major economic news? You can open an FXOpen account and try out your strategies.
This article represents the opinion of the Companies operating under the FXOpen brand only. It is not to be construed as an offer, solicitation, or recommendation with respect to products and services provided by the Companies operating under the FXOpen brand, nor is it to be considered financial advice.

Why it PAYS to be a PATIENT trader - 5 ReasonsPatience isn’t just a virtue.
Patience is your portfolio’s best friend.
Now you might think that patience is just sitting on your hands and doing nothing.
It’s not!
It’s about taking the time to prepare, analyse and wait for when the moment arrives.
And that’s why you have to keep your eyes peeled and ready to take on the big bad market.
So here are 5 reasons why it pays to be a patient trade.
🚦 #1: Stops You From Making Impulsive Decisions
Ever caught yourself hitting the ‘buy’ button for the sake of taking a trade?
You’re not alone.
Impulse is the enemy of reason, and in trading, it’s the fast track to a thinner wallet.
Remember, the market will always be there tomorrow, but the same can’t be said for your capital.
Impulsive decisions normally yields LOW probability trades. And that’s a reason in itself to STOP doing it.
Why take the risk?
🔍 #2: Helps You Spot High Probability Trades
The markets speak to those who listen.
Patience gives you the superpower to cut through the noise and hone in on high-probability trades.
It’s like having a financial crystal probability ball.
Instead of predictive qualities, you’re armed with analysis, trends, and a likelihood of how a trade is more likely to play out.
Remember, more trades from all types of markets don’t mean more wins.
Often, they just mean more fees, more stress and more losses.
🤲 #3: Hold Onto Winners
Got a winner in play?
Cool…
Patience says, “Hold it, let’s ride this wave a bit longer.”
It’s the difference between a quick sprint and a marathon.
Sure, locking in profits feels good and it looks promising on the portfolio.
But in the medium to long run, it’s a traders kryptonite to defeat.
Trading patience whispers in your ear,
“There’s more to come,” and more often than not, it’s right.
🧠 #4: Takes Away Fixation
Obsession is a trader’s Achilles heel.
Patience frees you from the chains of market fixation.
This will allow you to take a step back, focus on other things and not get hung up on every markets ticks.
Stop fixating on your trades once you’re in.
You have the strategy in play, you have risk and reward levels setup.
Let them be and follow your strategy (regardless of whether it’s a winner or a loser).
🐆 #5: Wait for the Prey
In the wild, the most successful predators are those that can wait, watch, and pounce at the perfect moment.
A leopard will wait for hours in the tall grass. But when the probability is high and the leopard has done its instinctual calculations – it will pounce and WIN.
You’re not chasing every gazelle; you’re waiting for the right one, the one that’s worth the energy.
It’s about being proactive, not reactive.
You set your terms, your entry, and exit points, and then you wait.
The market will move; it always does. And when it moves into your crosshairs, that’s when you strike.
So let’s sum up the reasons it pays to be a patient trader.
🚦 #1: Stops You From Making Impulsive Decisions
🔍 #2: Helps You Spot High Probability Trades
🤲 #3: Hold Onto Winners
🧠 #4: Takes Away Fixation
🐆 #5: Wait for the Prey

Engage: Type of trading Day { DOUBLE DISTRIBUTION TREND DAY}DOUBLE DISTRIBUTION TREND DAY
A double distribution trend day is an extension of a regular trend day. It exhibits two distinct price distribution phases within the trading session, with each phase characterized by a different price range. The first distribution typically follows the morning market open, while the second occurs later in the day.
Key features:
The market opens with brief consolidation phase
After the consolidation, a new trend emerges, usually with higher volatility
Followed by another consolidation phase
Trading strategies:
Use Initial base Breakout trade.
The Concept shared from the Book " Secrets of a Pivot Boss: Revealing Proven Methods for Profiting in the Market " by Frank O Ochoa (Author)

The Psychology of Trading:Identifying and Overcoming FrustrationFrustration in trading is an emotional state that traders experience as a result of unsuccessful trades, losing money, or being unable to follow their trading plan. It can be caused by a number of factors including unexpected changes in the market, errors in analysis or lack of discipline. Frustration occurs when expected results do not match reality or when a trader fails to achieve his or her goals.
Imagine this scenario: you've been eyeing a specific gift for your birthday, available exclusively at a single store. However, when the time finally arrives to make the purchase, you discover that the item is sold out – and there's no alternative option. This sense of disappointment, accompanied by feelings of annoyance and irritation, is a common experience known as frustration.
In the context of trading, frustration can manifest in similar ways. Imagine spending hours analyzing market trends, only to watch your carefully crafted trading plan fall apart due to unexpected market fluctuations. Or, picture yourself agonizing over a losing trade, unable to extricate yourself from a losing position despite your best efforts. In both cases, the emotional toll can be significant, leading to feelings of frustration that can compromise your decision-making and ultimately impact your overall performance.
📍 THE IMPACT OF FRUSTRATION IN TRADING:
➡️ Emotional Responses to Trading Challenges. Traders may experience a range of emotional responses to trading challenges, including irritation, anger, anxiety, and depression. Frustration can be particularly debilitating, as it can lead to feelings of dissatisfaction with oneself due to perceived missed opportunities or imperfect decisions.
➡️ Self-Doubt and Loss of Confidence. Frustration can also erode a trader's confidence in their abilities. A series of losing trades can lead to self-doubt, causing a trader to question their skills and judgment. This can have a negative impact on subsequent trades, ultimately resulting in significant losses.
➡️ Impulsive Decision-Making. Frustration can also prompt traders to re-evaluate their earlier decisions and seek changes to their strategies without sufficient analysis. This impulsive decision-making can lead to further mistakes and exacerbate the situation.
➡️ Loss of Motivation. As frustration builds, traders may experience a loss of motivation. The desire to achieve a goal or make progress in the market can fade, leaving them feeling disconnected from their trading activities. Without motivation, traders are less likely to make informed decisions or take calculated risks, which can hinder their long-term success.
Frustration in trading can have far-reaching consequences, extending beyond the trading arena to impact one's overall well-being. Prolonged frustration can lead to nervous system disorders, insomnia, depression, and even unhealthy habits. However, in the early stages, frustration can be leveraged as a motivating force. Its benefits include:
⚡️ Increased Motivation and Perseverance: Frustration can propel an individual to redouble their efforts and push harder to achieve their goals. Those who are initially unsuccessful may be more likely to give up, but those who persist despite setbacks can emerge stronger and more resilient.
⚡️ Creative Problem-Solving: Frustration can stimulate innovative thinking and inspire out-of-the-box solutions. When standard approaches fail, individuals may need to think creatively to overcome challenges, leading to novel and effective problem-solving strategies.
📍 MANAGING FRUSTRATION: A STEP-BY-STEP APPROACH
To effectively manage frustration, it's essential to first acknowledge and accept your emotions. Recognize when you're feeling frustrated and avoid denying the issue. Instead, focus on finding solutions.
🔹 Identify the Root Cause. To address the frustration, identify the specific trigger or event that led to it. This could be a particular action, situation, or decision. Once you understand the cause, you can develop a plan to address it.
🔹 Develop a Plan of Action. Create a plan that outlines potential solutions to the problem causing your frustration. This will help you feel more in control and empowered to take action.
🔹 Seek a Fresh Perspective. Talking to someone about your frustration can provide a valuable fresh perspective. They may help you see the situation from a different angle, and you may realize that the problem is not as severe as you thought.
🔹 Set Realistic Goals. When setting goals, aim for something achievable. Setting unrealistic expectations can lead to disappointment and further frustration. Instead, strive for a middle ground that is challenging yet attainable.
🔹 Work on Your Self-Esteem. Maintaining a healthy self-esteem is crucial for confidence and setting realistic goals. Avoid underestimating or overestimating your abilities, and focus on building a balanced sense of self-worth.
🔹 Emotional Management. Lastly, learn to manage your emotions by quickly shifting your focus away from negativity. Try to find something positive in the situation or practice mindfulness techniques to maintain a calm and centered state.
📍 CONCLUSION
In the realm of trading psychology, several emotions and thought patterns are common pitfalls that can hinder performance. Frustration, Fear of Missing Out, and rumination are all closely related to mistakes and failures, which can snowball into negative consequences if left unchecked. However, it is crucial to recognize that these psychological states can be transformed from liabilities into assets.
By acknowledging our mistakes, incorporating them into our learning process, and approaching challenges with creativity and resourcefulness, we can turn any psychological obstacle into an opportunity for growth. By doing so, we can break free from the cycle of negative thinking and cultivate a mindset that is resilient, adaptable, and ultimately successful.
Traders, If you liked this educational post🎓, give it a boost 🚀 and drop a comment 📣

Technical Analysis vs. Fundamental Analysis: Why Not Both?Hey there, fellow traders and market mavens! Ever found yourself staring confused at the screen and not making sense of things that happen in trading?
So you decided to wander off deep into technical analysis shutting out its other half — fundamental analysis? Or vice versa — you digested every economic report that big media outlets churned out and yet failed to factor in some support and resistance levels?
Fear not, for we've got the lowdown on why you don't have to pick sides and go with either the Fibonacci sequence or the latest jobs data . In fact, we're here to tell you why embracing both might just be your secret to trading success. So, grab your charts and financial reports and let's dive into the world where candlesticks meet earnings reports!
Technical Analysis: The Lost Art of Tape Reading
Technical analysis is like the cool, intuitive friend who always seems to know what's going to happen next. It's all about reading the market's mood through price charts, patterns and indicators. Here's why tech analysis should be in your skill set:
Trend Spotting : Ever wished you could predict the next big trend? With moving averages, trend lines and momentum indicators like the MACD, you can ride the waves like a pro surfer and let the market carry your trades into a sea of profits.
Timing is Everything : Candlestick patterns and support/resistance levels are your besties when it comes to perfect timing. The more you study them, the more you elevate your chances of entering and exiting trades with ninja-like precision.
Market Sentiment : Tools like the Relative Strength Index (RSI) and Bollinger Bands give you the scoop on whether the market's feeling overbought, oversold or just right. Learn these if you want to increase the probability of correctly gauging the market’s mood.
But hold up, before you get lost in the charts, let's not forget about the fundamentals.
Fundamental Analysis: Making Sense of Things
If technical analysis is your go-to for instant market vibes, fundamental analysis is the place to figure out why things happened in the first place. Here’s why fundamentals are a big deal and can help you to a) learn what moves markets and b) become fluent in marketspeak and own every trading conversation:
Long-Term Vision : While technical analysis can sometimes feel like guesswork, fundamental analysis is spitting facts. Earnings reports, P/E ratios and economic indicators help you see the bigger picture and educate you into a better, more knowledgeable trader.
Value Hunting : Ever heard of value investing legends like Warren Buffett? They thrive on finding undervalued gems through rigorous fundamental analysis. And, some say, this approach to investing is not reserved for companies only. It works for crypto, too.
Economic Health Check : Understanding GDP growth, interest rates and inflation can feel like having a crystal ball for market trends. And, one big plus is that you’ll become a lot more interesting when you explain things like monetary policy or forward-looking guidance to your uncle at the Thanksgiving table.
The Power Couple: Combining Technical and Fundamental Analysis
Now, here’s the kicker: Why choose one when you can have both? Imagine the synergy when you combine the swift foresightedness of technical analysis with the solid foundation of fundamental analysis. Here’s how to make this dynamic duo work for you:
Double-Check Your Entries and Exits : Use technical analysis for pinpointing your entry and exit points but back it up with fundamental analysis to build a convincing narrative of the asset’s long-term potential.
Confirm the Trend : Spot a promising trend with technical indicators? Validate it with strong fundamentals to make sure it’s not just a flash in the pan.
Risk Management : Technical analysis can help set your stop-loss levels, while fundamental analysis keeps you informed about any potential game-changers in the market.
Diversification : Fundamental analysis might show you the hottest sectors right now, while technical analysis can help you call tops and bottoms if an indicator you trust is showing oversold or overbought levels.
Wrapping Up
So, there you have it, folks! Technical analysis and fundamental analysis don’t have to be opposite camps. Think of them as your dynamic duo, Batman and Robin, peanut butter and jelly — better together. By blending the best of both worlds, you’ll increase your chances of success in trading and do yourself a favor — you’ll get to know a lot and become more interesting!
Ready to take your trading game to the next level? Start combining technical and fundamental analysis and watch as your trading strategies transform into a market-crushing masterpiece. Happy trading and may your profits be ever in your favor!

Compound Interest - A Trader's Secret WeaponIn this video I give you a perspective that traders often neglect - Compound Interest.
Compounding is probably the most important part in terms of becoming a trader that survives in the long run. Social media is filled with traders nowadays, and some of them are pretty good at trading. However, shortsightedness gets to them as they forget about the one thing that ensures longevity in this game. It is way easier dig yourself into drawdown than it is increase your wealth, it is just math. The technique that greatly rewards the disciplined and patient trader is COMPOUNDING.
As Albert Einstein said according to some sources although not verified is that "Compound interest is the 8th wonder of the world".
- R2F

Why Are Bonds Still Crashing?Why are US, UK, and EU bonds still crashing since March 2020?
In this video, we are going to study the relationship between bonds, yields, and interest rates, which many of us find confusing. How can we understand them, and why are bond prices leading the yield, followed by interest rates this season?
10 Year Yield Futures
Ticker: 10Y
Minimum fluctuation:
0.001 Index points (1/10th basis point per annum) = $1.00
Disclaimer:
• What presented here is not a recommendation, please consult your licensed broker.
• Our mission is to create lateral thinking skills for every investor and trader, knowing when to take a calculated risk with market uncertainty and a bolder risk when opportunity arises.
CME Real-time Market Data help identify trading set-ups in real-time and express my market views. If you have futures in your trading portfolio, you can check out on CME Group data plans available that suit your trading needs www.tradingview.com

Liquidity is KEY to the MarketsIn this video I go through more about liquidity and why it is important.
The markets move because of liquidity. Without liquidity, there is no trading. The larger the trader, the larger the liquidity required. Understanding the concept of liquidity and the fractal nature of price, trading becomes very interesting. A whole new world opens up to you and you no longer have to keep guessing where price is going. You no longer have to keep chasing candles.
I hope you find this video insightful.
- R2F

Nasdaq's Stellar Returns, Potential Risks AheadThe Nasdaq-100 has been a stellar performer since its debut in 1985, rising 22,900% (with dividends reinvested) for a 14.8% compounded annual total rate of return. By comparison, the S&P 500 returned 7,200% over the same period with dividends reinvested, an 11.5% compounded return (Figure 1).
Figure 1: Since the inception of the Nasdaq-100 index in 1985, it has outperformed the S&P
Source: Bloomberg Professional (XNDX and SPXT)
However, the Nasdaq’s outperformance can partly be attributed to higher risk levels. It has been consistently more volatile than the S&P 500 (Figure 2) and has been subject to much greater drawdowns. On March 28, 2000, Nasdaq began a drawdown that reached -81.76% on August 5, 2002 (Figure 3). The total return index didn’t hit a new high-water mark until February 12, 2015. It also had a sharper drawdown during the 2022 bear market.
Figure 2: The Nasdaq-100 has nearly always been more volatile than the S&P 500
Source: Bloomberg Professional (XNDX and SPXT), CME Economic Research Calculations
Figure 3: From 2000 to 2002, the Nasdaq-100 fell by nearly 82% and didn’t recover until 2015.
Source: Bloomberg Professional (XNDX and SPXT), CME Economic Research Calculations
A large part of the reason for the Nasdaq’s greater overall return, higher volatility and its heightened susceptibility to deep and long drawdowns is its dependence on one sector: information technology. Since at least the 1990s, Nasdaq has been nearly synonymous with the tech sector.
While nearly every sector has at least some presence in the Nasdaq, since its launch in 1999 it has always had a near-perfect correlation with the S&P 500 Information Technology Index (the basis for the S&P E-Mini Technology Select Sector futures launched in 2011). That correlation has never fallen below +0.9 and has sometimes been as high as +0.98. In the past 12 months the correlation has been +0.95 (Figure 4).
Figure 4: The Nasdaq-100 has always had extremely high correlations with the tech sector
Source: Bloomberg Professional (NDX, S5INFT, S5UTIL, S5ENRS, S5FINL, S5HLTH, S5CONS, S5COND, S5MATR, S5INDU, S5TELS)
The preponderance of technology stocks in the Nasdaq is largely a function of history. Nasdaq was founded in 1971 as the world’s first electronic stock market and it began to attract technology companies, in part, because it had more flexible listing requirements regarding revenue and profitability than other venues. Over time the technology ecosystem settled largely on this market and came to dominate the Nasdaq-100 Index.
Those who need to minimize tracking risks with respect to the S&P 500 Information Technology Index can do so with the Select Sector futures. However, those who wish to increase or decrease exposure to the technology sector more generally, and for whom tracking risks is a less of a concern can easily increase or reduce their exposure with the Nasdaq-100 futures.
Also launched in June 1999 were E-mini Nasdaq-100 futures, which are now turning 25 years old. The contracts caught on quickly, and today trade at more than 668K contracts or $60 billion in notional value each day.
E-mini Nasdaq-100 futures offer capital-efficient exposure to the Nasdaq-100 index, and allow investors to trade and track one NQ futures contract versus 100 stocks to achieve nearly identical exposure. These futures also help mitigate risk against the top-heavy nature of the Nasdaq-100 index, where the so-called Magnificent Seven companies—Microsoft, Apple, Nvidia, Amazon.com, Meta Platforms, Google-parent Alphabet and Tesla—have dominated recently. Broad exposure to this index acts as a hedge if the Magnificent Seven stocks decline.
The Nasdaq has also correlated highly in recent years with consumer discretionary stocks as well as telecoms. By contrast, it has typically low correlations with traditional high-dividend sectors such as consumer staples, energy and utilities which tend to be listed on other exchanges. The exception to this rule is during down markets, when stocks tend to become more highly correlated.
The Nasdaq also has very different interest rate sensitivities than its peers. For starters, high short-term interest rates seem to benefit the Nasdaq-100 companies as many of them have large reserves of cash that are earning high rates of return by sitting in T-Bills and other short-term maturities. This is a sharp contrast to the Russell 2000 index, which has suffered as Federal Reserve (Fed) rate hikes have increased the cost of financing for smaller and mid-sized firms, which borrow from banks rather than bond holders and don’t usually have substantial cash reserves.
By contrast, the Nasdaq has shown a very negative sensitivity to higher long-term bond yields. Many of the technology stocks in the Nasdaq-100 are trading at high earnings multiples. Some have market capitalization exceeding $1 trillion. Higher long-term bond yields are a potential threat because much the value of these corporations is what equity analysts might refer to as their “value in perpetuity,” meaning beyond any reasonable forecast horizon. Typically, such earnings are discounted using long-term bond yields and the higher those yields go, the lower the net present value of those future earnings. Additionally, higher long-term bond yields can also induce investors to switch out of highly volatile and expensive equity portfolios into the relatively less volatile, fixed- income securities.
The Nasdaq’s high sensitivity to long-term bond yields may explain why the index sold off so sharply in 2022 alongside a steep fall in the price of long-dated U.S. Treasuries, whose yields were rising in anticipation of Fed tightening and due to concerns about the persistence of inflation. By contrast, the Nasdaq has done well since October 2022 despite the Fed continuing to raise short-term rates through July 2023 and subsequently keeping those rates high. On the one hand, many of the cash-rich Nasdaq companies are benefitting from higher returns on their holdings of short-term securities. On the other hand, they are also benefitting from the fact that higher short-term rates have steadied long-term bond yields by making it clear that the Fed is taking inflation seriously.
This isn’t to suggest that the Nasdaq is immune from downside risks. History shows that the risks are very real, especially in the event of an economic downturn. In the 2001 tech wreck recession, the Fed cut short-term rates from 6.5% to 1% but long-term bond yields remained relatively high, which was not a helpful combination for the tech sector. In addition to its 82% decline during the tech wreck recession, it also fell sharply during the global financial crisis, though not as badly as the S&P 500, which had a far larger weighting to bank stocks.
This time around, potential threats to the Nasdaq include:
The possibility of an economic downturn which could crimp corporate profits.
Rate cuts which would reduce the return on cash positions.
Large budget deficits and quantitative tightening which could push up long-term bond yields.
Possibly tighter regulation of the tech sector in the U.S. and abroad.
If you have futures in your trading portfolio, you can check out on CME Group data plans available that suit your trading needs www.tradingview.com
By Erik Norland, Executive Director and Senior Economist, CME Group
*CME Group futures are not suitable for all investors and involve the risk of loss. Copyright © 2023 CME Group Inc.
**All examples in this report are hypothetical interpretations of situations and are used for explanation purposes only. The views in this report reflect solely those of the author and not necessarily those of CME Group or its affiliated institutions. This report and the information herein should not be considered investment advice or the results of actual market experience.
