PEV Price BandThe PEV Price Band shows prices calculated using the high and low P/FQ EV of the previous period. (price to enterprise value per share for the last quarter) multiplied by FQ's current EVPS (similar to comparing marketcap to enterprise value but edit equations that are close to the theory of P/E)
If the current price is lower than the minimum P/EVPS, it is considered cheap. In other words, a current price is above the maximum is considered expensive.
PEV Price Band consists of 2 parts.
- First of all, the current P/EVPS value is "green" (if the markecap is less than the enterprise value) or "red" (if the marketcap is more than the enterprise value) or "gold" (if the market value is less than the enterprise value and less than equity)
- Second, the blue line is the closing price.
Fundamental Analysis
Bitcoin Production CostFirst inspired by the amazing @capriole_charles, I decided to create my own version of calculating the Bitcoin production cost and to share it with you guys.
One of the main difference is the electricity cost calculation. I used a country-specific input system that calculates the weighted electricity cost leveraged by the distribution of the Bitcoin network hashrate. I like the fact that it requires little updating although it is less realistic for past calculations (further in the past production costs seems too low).
How to use:
- Add the indicator to your chart.
- Adjust the inputs if needed. Update the percentage of Bitcoin network Hashrate or electricity Cost per countries. Update the mining hardware stats to the most recent hardware. For example I used a Bitcoin Miner S21 Pro stats.
- Check the multiple variables in the data window.
- Turn on/off the halving event in the style tab

Macro Risk On/Off SentimentOverview
As an Ichimoku trader, I've always found it crucial to understand the broader market sentiment before entering trades. That's why I developed this Macro Risk On/Off Sentiment Indicator. It's designed to provide a comprehensive view of global market risk sentiment by analysing multiple factors across different asset classes. By combining nine key market indicators, it produces an overall risk sentiment score, giving me a clearer picture of the market's mood before I apply my Ichimoku strategy.
Rationale
While Ichimoku is powerful for identifying trends and potential entry points, I realised it doesn't always capture the broader market context. Markets don't exist in isolation—they're influenced by a myriad of factors including volatility, economic indicators, and cross-asset relationships. By creating this indicator, I aimed to fill that gap, providing myself with a macro view that complements my Ichimoku analysis.
How It Works
The indicator analyses nine different market factors:
VIX (Volatility Index): Measures market expectations of near-term volatility.
S&P 500 Performance: Represents the overall US stock market performance.
US 10-Year Treasury Yield: Indicates bond market sentiment and economic outlook.
Gold Price Movement: Often seen as a safe-haven asset.
US Dollar Index: Measures the strength of the USD against a basket of currencies.
Emerging Markets Performance: Represents risk appetite for higher-risk markets.
High Yield Bond Spreads: Indicates credit market risk sentiment.
Copper/Gold Ratio: An economic growth indicator.
Put/Call Ratio: Measures overall market sentiment based on options trading.
Each factor is assigned a score based on its z-score relative to its recent history, then weighted according to its perceived importance. The overall risk score is a weighted average of these individual scores.
How I Use It
Before applying my Ichimoku strategy, I first check this indicator to gauge the overall market sentiment:
I look at the blue line plotted on the chart, which represents the overall risk score.
I note the background colour: green for risk-on (positive score) and red for risk-off (negative score).
I check the label in the lower-left corner, which provides specific FX pair recommendations and market expectations.
In a risk-on environment (positive score):
I focus on long positions in AUD/JPY, NZD/JPY, EUR/USD, etc.
I look for short opportunities in USD/CAD, USD/NOK, etc.
I expect commodities and yields to rise
In a risk-off environment (negative score):
I focus on long positions in USD/JPY, USD/CHF, USD/CAD
I look for short opportunities in AUD/USD, NZD/USD, EUR/USD
I expect increased volatility and falling yields
The strength of the sentiment is reflected in how close the score is to either 1 (strong risk-on) or -1 (strong risk-off). This helps me gauge how aggressive or conservative I should be with my Ichimoku trades.
Customisation
I've designed this indicator to be flexible. You can modify it to:
Adjust the lookback period and moving average length (both default to 30)
Change the weighting of different factors in the final score calculation
Include or exclude specific factors based on your analysis needs
By combining this Macro Risk On/Off Sentiment Indicator with my Ichimoku analysis, I've found I can make more informed trading decisions, taking into account both the technical setups I see on the chart and the broader market context.

Unfilled Gaps TrackerIndicator Description: Unfilled Gaps Tracker
Overview:
The Unfilled Gaps Tracker is a powerful TradingView indicator designed to identify and visualize unfilled gaps on a price chart. This indicator highlights bullish and bearish gaps with continuous horizontal bars, helping traders quickly identify potential areas of support and resistance.
Features:
Gap Detection: Automatically detects bullish gaps (where the current low is higher than the previous close) and bearish gaps (where the current high is lower than the previous close).
Continuous Visualization: Displays gaps as horizontal bars extending to the most recent candle. Bullish gaps are filled with green, and bearish gaps are filled with red.
Single Label per Gap: Each gap is labeled once, ensuring a clean and uncluttered chart. Labels move with the gap's right edge as new bars are added.
Dynamic Updates: Gaps are dynamically updated, and the visualization adjusts as new bars are added. Gaps are removed from the chart once they are filled by subsequent price action.
Multiple Gaps: Tracks multiple gaps simultaneously, providing a comprehensive view of unfilled gaps over time.
Usage:
Adding the Indicator:
To add the Unfilled Gaps Tracker to your chart, search for "Unfilled Gaps Tracker" in the TradingView indicators menu and apply it to your desired chart.
Interpreting the Indicator:
Bullish Gaps: Represented by green horizontal bars with the label "Bull Gap." These indicate areas where the price gapped up, potentially acting as future support levels.
Bearish Gaps: Represented by red horizontal bars with the label "Bear Gap." These indicate areas where the price gapped down, potentially acting as future resistance levels.
Trading Strategy:
Use the identified gaps to inform your trading strategy. Unfilled bullish gaps can be potential buy zones, while unfilled bearish gaps can be potential sell zones.
Monitor how the price interacts with these gaps. A gap fill (where the price moves back to close the gap) can provide valuable trading signals.

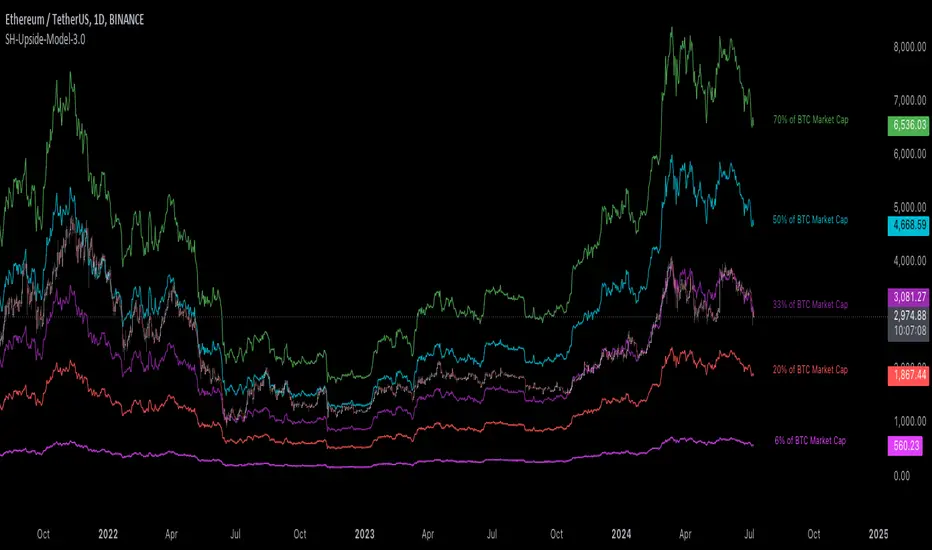
[Suitable Hope] Crypto Upside Model 3.0The "Crypto Upside Model 3.0" indicator dynamically calculates the potential price of any cryptocurrency based on various percentages of Ethereum or Bitcoin's market capitalization.
By fetching and analyzing marketcap data from TradingView sources, it allows traders to visualize potential price targets if their chosen cryptocurrency reaches specific market dominance levels. This tool is designed for daily timeframe analysis and can be used to set informed price expectations and strategic investment goals, providing valuable insights for long-term investment planning.
Why using the Crypto Upside Model 3.0?
Strategic Planning: Helps traders and investors set realistic price targets and investment goals by visualizing potential market cap scenarios.
Informed Decision-Making: Provides a data-driven approach to understanding how a cryptocurrency might perform relative to major assets like Bitcoin and Ethereum.
Customizable Analysis: Allows users to choose different comparison assets (ETH or BTC) and visualize various market cap dominance percentages, offering tailored insights.
Daily Timeframe Focus: Ideal for swing traders and long-term investors who operate on a daily analysis timeframe, providing relevant and actionable data.
Bull Markets: Identify potential price targets if your cryptocurrency's market cap increases significantly.
Bear Markets: Assess how much value could be retained relative to major cryptocurrencies.
Strategic Entry/Exit Points: Use the visualized targets to plan entry or exit points in your trading strategy.
Comparative Advantage
Dynamic Adaptation: Unlike fixed indicators, this tool adapts to any active chart, making it versatile for multiple cryptocurrencies.
Market Cap Insights: Provides a unique perspective by linking price targets to market cap dominance, a critical factor in the crypto market.
User Instructions
Setup: Add the " Upside Model 3.0" indicator to your TradingView chart.
Configuration: Use the input settings to select the comparison cryptocurrency (ETH or BTC) and enable the desired market cap percentage plots.
Analysis: The indicator will display potential price targets based on the selected market cap percentages, providing a visual guide for setting price expectations.
Limitations
Marketcap Data Availability: The indicator relies on marketcap data from TradingView, which may not be available for all cryptocurrencies. If the data is unavailable, the indicator will not function for that asset. This tool is more likely to work with older, established cryptocurrencies, as marketcap data for newer cryptocurrencies may not yet be available.
Daily Timeframe Restriction: The indicator is designed to work exclusively on the daily timeframe, limiting its applicability for intraday trading.
Assumptions of Market Dynamics: The calculations assume a direct correlation between market dominance and price, which may not account for other market dynamics and external factors influencing prices.
Data Accuracy: The accuracy of the indicator depends on the reliability of the data provided by TradingView, which may sometimes experience delays or inaccuracies.
Currently available cryptocurrencies: Bitcoin, Ethereum, Solana, Binance Coin, Cardano, Ripple, Polkadot, Avalanche, Chainlink, Litecoin, Dogecoin, Terra, Uniswap, VeChain, Stellar, Internet Computer, Hedera, Filecoin, Monero, Aave, TRON, NEAR Protocol, Compound, Maker,... For all compatible cryptocurrencies, please consult CRYPTOCAP's documentation.
Final notes
Although various sources ask a payment or user data for similar kind of private indicators, this one is entirely free and open source. "Uncanny" isn't it? I hope this indicator will provide you value. Feel free to leave a message if you have any questions or constructive feedback.
Examples of how I use this indicator
When using ETH's historical price as a reference compared to Bitcoin's marketcap, we can notice that price generally has been held between the +-30% and 50% lines of BTC's marketcap. If history is repeating again, we can expect major resistances around the 50% looking ahead into the future. This for me would be a great area to potentially reduce my ETH spot position.
When using SOL's historical price action, we can notice that the 15% line of ETH's marketcap has been a top in the previous cycle. Today SOL (July 2024), is back at this level. Could this be a top again or could price break this 15% level and head perhaps towards 30% which currently sits around $260? Time will tell.
These are 2 simple example of how I interpret the data. I'm keen to hear what other findings with other pairs you can find.
Sector Analysis This indicator offers a straightforward yet effective way to analyze and compare the performance of various sectors within the market. By normalizing and plotting sector-specific data as lines on the chart, it enables users to quickly assess sector rotations, relative strength, and potential shifts in market dynamics. The sector labels further enhance usability by clearly identifying each line’s corresponding sector, facilitating easy interpretation and analysis.

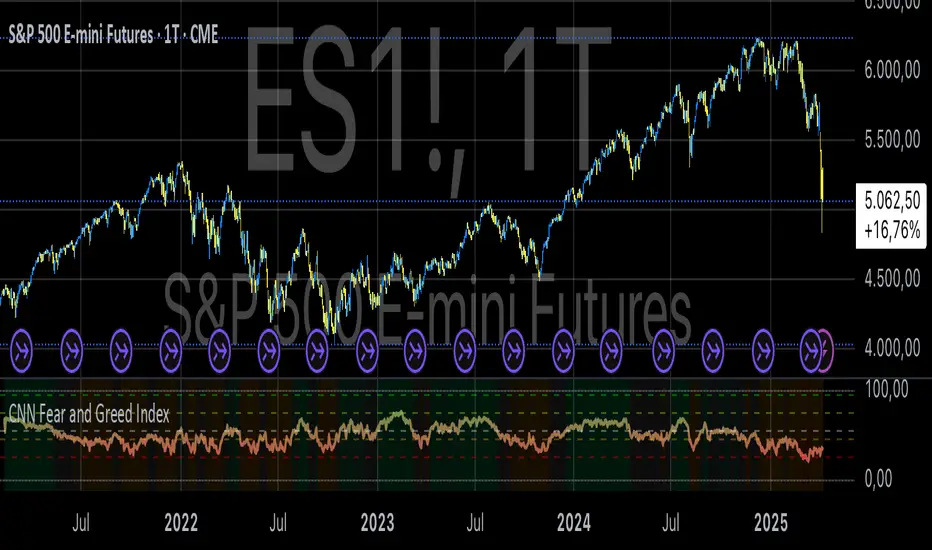
CNN Fear and Greed IndexThe “CNN Fear and Greed Index” indicator in this context is designed to gauge market sentiment based on a combination of several fundamental indicators. Here’s a breakdown of how this indicator works and what it represents:
Components of the Indicator:
1. Stock Price Momentum:
• Calculates the momentum of the S&P 500 index relative to its 125-day moving average. Momentum is essentially the rate of acceleration or deceleration of price movements over time.
2. Stock Price Strength:
• Measures the breadth of the market by comparing the number of stocks hitting 52-week highs versus lows. This provides insights into the overall strength or weakness of the market trend.
3. Stock Price Breadth:
• Evaluates the volume of shares trading on the rise versus the falling volume. Higher volume on rising days suggests positive market breadth, while higher volume on declining days indicates negative breadth.
4. Put and Call Options Ratio (Put/Call Ratio):
• This ratio indicates the sentiment of investors in the options market. A higher put/call ratio typically signals increased bearish sentiment (more puts relative to calls) and vice versa.
5. Market Volatility (VIX):
• Also known as the “fear gauge,” the VIX measures the expected volatility in the market over the next 30 days. Higher VIX values indicate higher expected volatility and often correlate with increased fear or uncertainty in the market.
6. Safe Haven Demand:
• Compares the returns of stocks (represented by S&P 500) versus safer investments like 10-year Treasury bonds. Higher returns on bonds relative to stocks suggest a flight to safety or risk aversion.
7. Junk Bond Demand:
• Measures the spread between yields on high-yield (junk) bonds and investment-grade bonds. Widening spreads may indicate increasing risk aversion as investors demand higher yields for riskier bonds.
Normalization and Weighting:
• Normalization: Each component is normalized to a scale of 0 to 100 using a function that adjusts the range based on historical highs and lows of the respective indicator.
• Weighting: The user can adjust the relative importance (weight) of each component using input parameters. This customization allows for different interpretations of market sentiment based on which factors are considered more influential.
Fear and Greed Index Calculation:
• The Fear and Greed Index is calculated as a weighted average of all normalized components. This index provides a single numerical value that summarizes the overall sentiment of the market based on the selected indicators.
Usage:
• Visualization: The indicator plots the Fear and Greed Index and its components on the chart. This allows traders and analysts to visually assess the sentiment trends over time.
• Analysis: Changes in the Fear and Greed Index can signal shifts in market sentiment. For example, a rising index may indicate increasing greed and potential overbought conditions, while a falling index may suggest increasing fear and potential oversold conditions.
• Customization: Traders can customize the indicator by adjusting the weights assigned to each component based on their trading strategies and market insights.
By integrating multiple fundamental indicators into a single index, the “CNN Fear and Greed Index” provides a comprehensive snapshot of market sentiment, helping traders make informed decisions about market entry, exit, and risk management strategies.
[INVX] Post-Earnings Announcement DriftWhat does this strategy do?
This Pine Script strategy implements the Post-earnings announcement drift (PEAD) strategy, which is a financial market anomaly where a stock's price tends to drift in the direction of the firm's earnings surprise for an extended period of time.
Ref: en.wikipedia.org
An earnings announcement is an official public statement of a company's profitability for a specific time period, typically a quarter or a year. It includes various financial metrics but the most watched figure is the Earnings Per Share (EPS). Analysts estimate the EPS before the announcement, and the actual EPS is compared to this estimate to determine if there was an earnings surprise.
An earnings surprise occurs when the actual EPS is significantly different from the analysts' estimates. A positive earnings surprise indicates that the actual EPS is higher than the estimate, while a negative earnings surprise suggests the EPS is lower than anticipated.
The script takes the following inputs
" Holding periods (bar) " : This input defines the number of periods (or bars) the script will hold a position after the earnings announcement.
" Surprise threshold (%) ": This input sets the minimum percentage for an earnings surprise, which triggers the strategy to enter either a long or short position. In essence, it represents the minimum deviation between the estimated and actual Earnings Per Share (EPS) that will trigger a trade. A higher threshold may lead to fewer, potentially more significant trades, while a lower threshold might result in more frequent, possibly less impactful trades. This parameter allows you to adjust the sensitivity of the strategy to earnings surprises.
Positive earnings surprise
After the earnings announcement, the script compares the actual EPS with the estimated EPS to identify an earnings surprise. If there is a positive earnings surprise, the script will enter a long position. A long position is a bullish strategy where the investor expects the stock price to rise.
Negative earnings surprise
On the other hand, if there is a negative earnings surprise, the script will enter a short position. A short position is a bearish strategy where the investor expects the stock price to fall.
In both scenarios, the position (either long or short) is held for the number of periods specified in the "Holding periods (bar)" input. This strategy is based on the assumption that the stock price will continue to drift in the direction of the earnings surprise for the specified holding period.
Disclaimer: The script provided herein is for educational purposes only. It should not be considered as investment advice or a recommendation of any particular security, strategy or investment product. Past performance is not indicative of future results.
The results of the Pine Script backtesting are hypothetical and should not be considered as a true reflection of the results that might be achieved in a live trading environment. The backtest results are based on historical data and may not take into account certain factors such as actual transaction costs, taxes, or changes in market conditions.
Investors should consult with their financial advisor before making any investment decisions. All investments involve risk, including the potential loss of all invested capital.

Performance IndicatorsDescription:
The Performance Indicators tool provides traders with a comprehensive overview of both fundamental and technical performance metrics of a security. This dual approach helps traders make informed decisions by evaluating the security's intrinsic value as well as its market behavior.
Fundamental Performance Indicators:
EPS Year Over Year % Growth : Measures the percentage growth in earnings per share (EPS) compared to the same quarter in the previous year. This helps in understanding the company's profitability trends.
EPS 3 Quarters Year Over Year % Growth : Analyzes the percentage growth in EPS over the last three quarters compared to the same quarters in the previous year, providing insight into the company's recent earnings performance.
Sales Year Over Year % Growth : Tracks the percentage growth in sales compared to the same quarter in the previous year, offering a view of the company's revenue trends.
Sales 3 Quarters Year Over Year % Growth : Evaluates the percentage growth in sales over the last three quarters compared to the same quarters in the previous year, helping to assess the company's recent revenue performance.
Return On Equity (ROE) : Measures the company's profitability by comparing net income to shareholder equity. This indicates how effectively the company is using its equity base to generate profits.
Market Capitalization : Represents the total market value of the company's outstanding shares, providing a sense of the company's size and market presence.
Float Shares Outstanding : Refers to the number of shares available for trading by the public, excluding restricted shares. This metric helps in understanding the liquidity and volatility of the stock.
Technical Performance Indicators:
Average Daily Range (ADR) %: Calculates the average range between the high and low prices over a specific period, expressed as a percentage. This helps in understanding the stock's daily volatility.
Average True Range (ATR) $ : Measures market volatility by calculating the average range between the high and low prices, taking into account any gaps in the price. It is expressed in dollar terms.
% Off 52-Week High : Indicates how far the current price is from the highest price achieved over the last 52 weeks, helping to assess the stock's current performance relative to its yearly peak.
Relative Price Strength (RPS) : Compares the stock's price performance to a benchmark index, helping to identify how the stock is performing relative to the broader market.
How it Works:
The fundamental performance indicators provide insights into the company's financial health and growth trends by analyzing key metrics such as EPS, sales growth, ROE, market capitalization, and float shares outstanding.
The technical performance indicators offer a view of the stock's market behavior and volatility through metrics like ADR, ATR, % off 52-week high, and RPS.
By combining these fundamental and technical metrics, traders can gain a well-rounded perspective on the security's overall performance.
How to Use:
Add the Performance Indicators tool to your chart.
Evaluate the fundamental indicators to assess the company's financial health and growth trends.
Analyze the technical indicators to understand the stock's market behavior and volatility.
Use the combined insights from both fundamental and technical indicators to make informed trading decisions.
This tool is particularly useful for traders who want to integrate both fundamental analysis and technical analysis into their trading strategy, providing a holistic view of a security's performance.

HRC - Hash Rate Capitulation [Da_Prof]The HRC (Hash Rate Capitulation) indicator is a measure of hash rate trend strength. It is the fractional difference between a long and a short simple moving average (SMA) of the bitcoin hash rate. Historically, the 21-day and 105-day SMA work well for this indicator. The hash rate generally increases over time, but when the short SMA crosses below the longer-term SMA, it shows that miners are removing significant hash from the system. This state can be considered a miner "capitulation". Historically, this has marked depressed BTC prices and has led to higher prices within some months. Shout out to foosmoo, the hash rate oscillator indicator prompted this presentation.

Intermarket Correlation TableThe Correlation Coefficient is used to measure the correlation between two sets of data. In the trading world, the Correlation Coefficient is a measure of the correlation between two data sets of financial instruments. The correlation between two financial instruments is the degree in which they are related. Correlation is based on a scale of 1 to -1. The closer the Correlation Coefficient is to 1, the higher their positive correlation. The instruments will move up and down together. The closer the Correlation coefficient is to -1, the more they move in opposite directions. A value at 0 indicates that there is no correlation.
This indicator uses the built in ta.correlation function to calculate the correlation coefficient between DXY and NQ, ES, YM, US10Y, and ZN respectively. It then presents the data in a customizable table that is view as an overlay on your chart.
Adjust the length of the correlation factor to calculate higher time frame correlation.
Asset background changes based on current candle direction.
Coefficient background color changes based on whether the assets are properly correlated.
DXY is inversely correlated to NQ, ES, YM, and ZN.
DXY is directly correlated to US10Y.
The colors are reflected as such.

Double FVG-BPR [QuantVue]The Double FVG BPR Indicator is a versatile tool that helps traders identify potential support and resistance levels through the concept of balanced price ranges.
A Balanced Price Range (BPR) is a zone on a price chart where the market has found equilibrium after a period of price imbalance.
It is identified by detecting a Fair Value Gap (FVG) in one direction, followed by an overlapping Fair Value Gap in the opposite direction.
Components of a Balanced Price Range
Fair Value Gap (FVG): A FVG occurs when there is a rapid price movement, creating a gap in the price chart where minimal trading occurs. This gap represents an imbalance between supply and demand.
Bullish FVG: A bullish FVG is identified when the low of a candle is higher than the high of a candle two periods ago, and the close of the previous candle is higher than the high of that same period.
Bearish FVG: A bearish FVG is identified when the high of a candle is lower than the low of a candle two periods ago, and the close of the previous candle is lower than the low of that same period.
Overlapping Fair Value Gap: For a BPR to be formed, an initial FVG must be followed by an overlapping FVG in the opposite direction. This creates a balanced zone where the price has moved up (or down) quickly and then moved down (or up) with similar intensity, suggesting a temporary equilibrium.
The area between the high and low points of these overlapping FVGs forms the BPR. This zone represents a temporary market equilibrium where supply and demand have balanced out after a period of significant price movement in both directions.
How to Use
Support and Resistance Levels: The upper and lower boundaries of the BPR act as dynamic support and resistance levels. Traders can use these levels to place buy and sell orders, anticipating that the price may find support or face resistance within these zones.
Trend Reversal and Continuation: The BPR can signal potential trend reversals or continuations.
If the price moves back into the BPR after a breakout, it may indicate a reversal. Conversely, if the price breaks out of the BPR with strong momentum, it may signal a trend continuation.

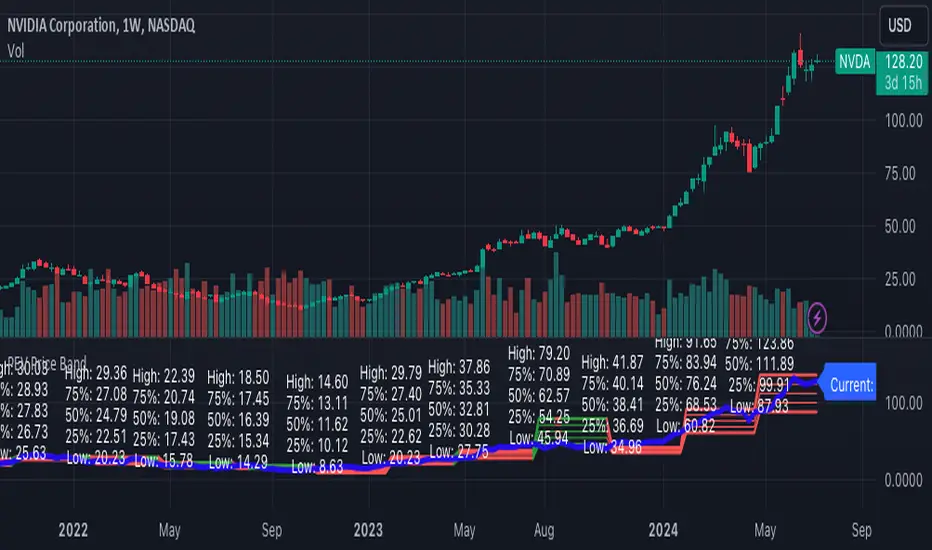
ICT Premium/DiscountThis script indicator prints lines for the highest, lowest and middle price in a selected time period (in days).
With that you can easily see wheter the price is currently high, low or balanced compared to the prices in the selected time period.
I also added a gray dotted vertical line to the chart which represents the beginning of your selected time period
You can choose the time period on your own and you can also customize the color and style of the lines.
Your lines may get printed in a separate window. To fix this, click on the indicator and select
Move to -> existing pane above
Your lines also may stay stuck on the same place on the chart and are not fixed to a high/low. To fix this, right-click on the left price scale and select
Merge all scales into one -> on the right

COT IndexReference:
Trade Stocks and Commodities with the Insiders
Secrets of the COT Report by Larry Williams pg34
The equation is as below:
Current week's value- Lowest value of last three years
---------------------------------------------------------------------------- X 100%
Highest high of last three years-Lowest low of last three years
According to Larry Williams, traders should follow commercials direction. When the commercial index line (yellow line) is above 80, this indicates commercials are bullish. Hence, traders can look for potential buy setup. Conversely, when commercials index line (yellow line) is below 20, this indicates commercials are bearish, we can look for sell setup.
Do note that this is only applicable on Weekly chart as COT reports come out on weekly basis.
Modification from the original COT index from Larry Williams:
1) I've added 1year and 6months period, so traders maybe can look for pullback using shorter period. By default, Larry Williams uses 3 years Commercial index.
2) I've added non-commercials and retail traders index, they basically trade opposite way of commercials.
This indicator should not be used as a timing tool or entry tool, you can use it as your weekly or monthly bias tool. For more information, please read the books. Feel free to modify the code, if u have a better version of this, you may share to me if you want, I will be very grateful!

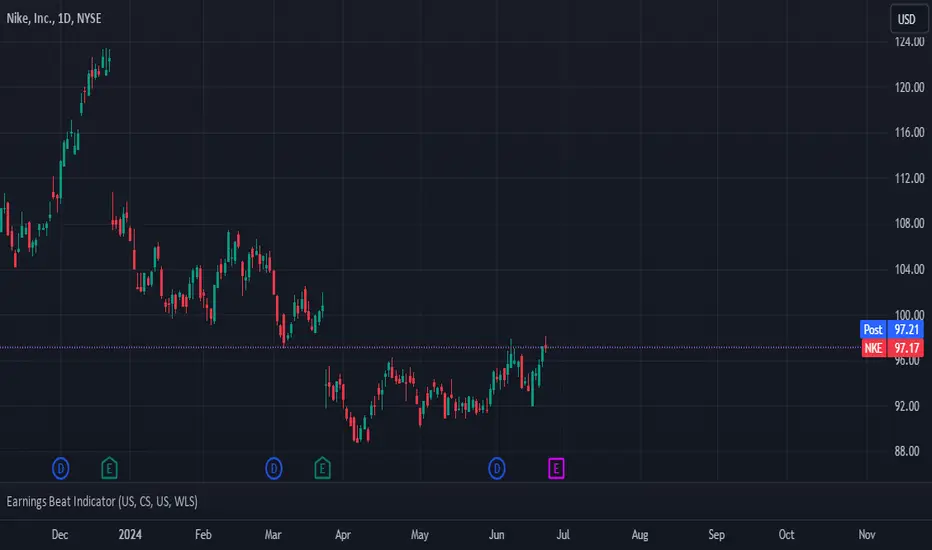
Earnings Beat IndicatorThis indicator seeks to predict whether a stock will beat or miss earnings by forecasting revenues, and subsequently net income, using linear regression. The y-values of this regression are revenues and the x-axis is an economic series of your choosing. Double-click the status line (the words "US" and "GDP") to change economic datasets. The full list of economic datasets available in TradingView is in the Help Center.
Instructions:
1. Double-click on the status line (the fields "US" and "GDP"). The inputs tab will pop up.
2. Type in the country and data codes for the economic datasets you believe have the highest correlation with revenues and net margins respectively.
3. Check the correlation coefficient between financial data and economic data by interpreting the white and gray numbers on the status line - white for the correlation coefficient between revenues and your chosen economic dataset, and gray for the correlation coefficient between net margins and your chosen economic dataset. These numbers should be as close to +1 or -1 as possible.
4. Interpret the results - the blue number indicates whether revenues will beat estimates and the green number indicates whether earnings will beat estimates. A 1 for both outputs indicates a double beat, a 1 and a 0 indicates a revenue beat but not an earnings beat, a 0 and a 1 indicates an earnings beat but not a revenue beat, and a 0 and a 0 indicates a double miss.
- DickZhones
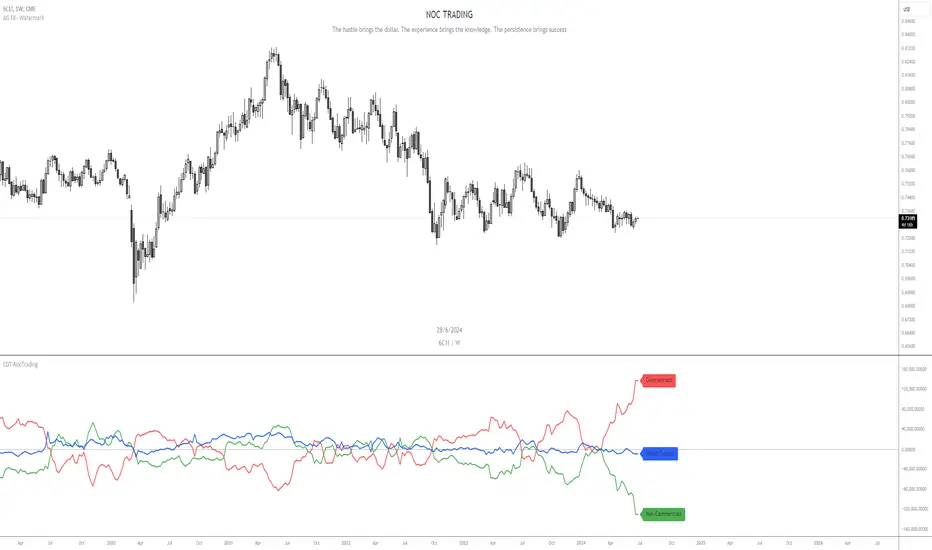
COT-NocTradingIndicator Description:
Commitments of Traders (COT) Data Indicator
The Commitments of Traders (COT) Data Indicator on TradingView provides insights into market sentiment based on the weekly CFTC (Commodity Futures Trading Commission) reports. It plots three key lines derived from this data, offering valuable information for traders seeking to understand positioning trends among large speculators, commercial hedgers, and small traders.
Lines Plotted:
Commercials: Reflects positions held by commercial entities engaged in the production or sale of the underlying commodity. Their positions often act as a hedge against physical market exposure.
Non Commercials: Represents positions held by large speculators, typically hedge funds and large financial institutions, who often take more significant positions based on their market outlook.
Retail Traders: Shows positions held by small traders, including individual retail traders and smaller institutional players, providing insights into the broader retail sentiment.
Labeling:
Each line is accompanied by a label to clearly identify its corresponding group, enhancing clarity and ease of interpretation for traders analyzing the indicator.
Usage:
Trend Confirmation: Monitor the positioning of commercial and non commercial relative to retail traders to confirm trends and potential reversals.
Sentiment Analysis: Assess shifts in market sentiment based on changes in positioning across different trader categories.
Trading Signals: Use crossovers, divergences, and extreme positioning relative to historical data to generate potential trading signals.
This indicator is valuable for traders looking to incorporate institutional positioning data into their trading strategies, offering a deeper understanding of market dynamics beyond price action alone.
Bitcoin Fundamentals - Bitcoin Block RewardThe Bitcoin Block Reward is the batch of new Bitcoins generated by the miners after solving each block.
The Block Reward is set as a basic rule and cannot be changed without agreement between the entire Bitcoin network. It started at 50 BTC during the first period. Afterwards the Block Reward gets adjusted to half of it value (Halving Event) on each cycle of 210000 blocks mined.
This is the only way that new bitcoins are created. It creates an incentive for miners to secure the network.
Over time the Block Reward will decreases to a value that might not cover the mining costs. At that point, the use of the Bitcoin Network might have increased sufficiently as to generate enough transaction fees to cover the mining costs.
MOTIVATION
Even though this is a very simple indicator, I'm currently missing a data source to compute the Block Reward value within Tradingview. Therefore, I created this indicator and its associated library function to enable its visualization and (eventually) for coders to make use of the source function to power more elaborate scripts related to the Halving Events.
Hope that helps!

RunRox - Backtesting System (ASMC)Introducing RunRox - Backtesting System (ASMC), a specially designed backtesting system built on the robust structure of our Advanced SMC indicator. This innovative tool evaluates various Smart Money Concept (SMC) trading setups and serves as an automatic optimizer, displaying which entry and exit points have historically shown the best results. With cutting-edge technology, RunRox - Backtesting System (ASMC) provides you with effective strategies, maximizing your trading potential and taking your trading to the next level
🟠 HOW OUR BACKTESTING SYSTEM WORKS
Our backtesting system for the Advanced SMC (ASMC) indicator is meticulously designed to provide traders with a thorough analysis of their Smart Money Concept (SMC) strategies. Here’s an overview of how it works:
🔸 Advanced SMC Structure
Our ASMC indicator is built upon an enhanced SMC structure that integrates the Institutional Distribution Model (IDM), precise retracements, and five types of order blocks (CHoCH OB, IDM OB, Local OB, BOS OB, Extreme OB). These components allow for a detailed understanding of market dynamics and the identification of key trading opportunities.
🔸 Data Integration and Analysis
1. Historical Data Testing:
Our system tests various entry and exit points using historical market data.
The ASMC indicator is used to simulate trades based on predefined SMC setups, evaluating their effectiveness over a specified time period.
Traders can select different parameters such as entry points, stop-loss, and take-profit levels to see how these setups would have performed historically.
2. Entry and Exit Events:
The backtester can simulate trades based on 12 different entry events, 14 target events, and 14 stop-loss events, providing a comprehensive testing framework.
It allows for testing with multiple combinations of entry and exit strategies, ensuring a robust evaluation of trading setups.
3. Order Block Sensitivity:
The system uses the sensitivity settings from the ASMC indicator to determine the most relevant order blocks and fair value gaps (FVGs) for entry and exit points.
It distinguishes between different types of order blocks, helping traders identify strong institutional zones versus local zones.
🔸 Optimization Capabilities
1. Auto-Optimizer:
The backtester includes an auto-optimizer feature that evaluates various setups to find those with the best historical performance.
It automatically adjusts parameters to identify the most effective strategies for both trend-following and counter-trend trading.
2. Stop Loss and Take Profit Optimization:
It optimizes stop-loss and take-profit levels by testing different settings and identifying those that provided the best historical results.
This helps traders refine their risk management and maximize potential returns.
3. Trailing Stop Optimization:
The system also optimizes trailing stops, ensuring that traders can maximize their profits by adjusting their stops dynamically as the market moves.
🔸 Comprehensive Reporting
1. Performance Metrics:
The backtesting system provides detailed reports, including key performance metrics such as Net Profit, Win Rate, Profit Factor, and Max Drawdown.
These metrics help traders understand the historical performance of their strategies and make data-driven decisions.
2. Flexible Settings:
Traders can adjust initial balance, commission rates, and risk per trade settings to simulate real-world trading conditions.
The system supports testing with different leverage settings, allowing for realistic assessments even with tight stop-loss levels.
🔸 Conclusion
The RunRox Backtesting System (ASMC) is a powerful tool for traders seeking to validate and optimize their SMC strategies. By leveraging historical data and sophisticated optimization algorithms, it provides insights into the most effective setups, enhancing trading performance and decision-making.
🟠 HERE ARE THE AVAILABLE FEATURES
Historical backtesting for any setup – Select any entry point, exit point, and various stop-loss options to see the results of your setup on historical data.
Auto-optimizer for finding the best setups – The indicator displays settings that have shown the best results historically, providing valuable insights.
Auto-optimizer for counter-trend setups – Discover entry and exit points for counter-trend trading based on historical performance.
Auto-optimizer for stop-loss – The indicator shows stop-loss points that have been most effective historically.
Auto-optimizer for take-profit – The indicator identifies take-profit points that have performed well in historical trading data.
Auto-optimizer for trailing stop – The indicator presents trailing stop settings that have shown the best historical results.
And much more within our indicator, all of which we will cover in this post. Next, we will showcase the possible entry points, targets, and stop-loss options available for testing your strategies
🟠 ENTRY SETTINGS
12 Event Triggers for Trade Entry
Extr. ChoCh OB
Extr. ChoCh FVG
ChoCh
ChoCh OB
ChoCh FVG
IDM OB
IDM FVG
BoS FVG
BoS OB
BoS
Extr. BoS FVG
Extr. BoS OB
3 Trade Direction Options
Long Only: Enter long positions only
Short Only: Enter short positions only
Long and Short: Enter both long and short positions based on trend
3 Levels for Order Block/FVG Entries
Beginning: Enter the trade at the first touch of the Order Block/FVG
Middle: Enter the trade when the middle of the Order Block/FVG is reached
End: Enter the trade upon full filling of the Order Block/FVG
*Three levels work only for Order Blocks and FVG. For trade entries based on BOS or CHoCH, these settings do not apply as these parameters are not available for these types of entries
You can choose any combination of trade entries imaginable.
🟠 TARGET SETTINGS
14 Target Events, Including Fixed % and Fixed RR (Risk/Reward):
Fixed - % change in price
Fixed RR - Risk Reward per trade
Extr. ChoCh OB
Extr. ChoCh FVG
ChoCh
ChoCh OB
ChoCh FVG
IDM OB
IDM FVG
BoS FVG
BoS OB
BoS
Extr. BoS FVG
Extr. BoS OB
3 Levels of Order Block/FVG for Target
Beginning: Close the trade at the first touch of your target.
Middle: Close the trade at the midpoint of your chosen target.
End: Close the trade when your target is fully filled.
Customizable Parameters
Easily set your Fixed % and Fixed RR targets with a user-friendly input field. This field works only for the Fixed and Fixed RR entry parameters. When selecting a different entry point, this field is ignored
Choose any combination of target events to suit your trading strategy.
🟠 STOPLOSS SETTINGS
14 Possible StopLoss Events Including Entry Orderblock/FVG
Fixed - Fix the loss on the trade when the price moves by N%
Entry Block
Extr. ChoCh OB
Extr. ChoCh FVG
ChoCh
ChoCh OB
ChoCh FVG
IDM OB
IDM FVG
BoS FVG
BoS OB
BoS
Extr. BoS FVG
Extr. BoS OB
3 Levels for Order Blocks/FVG Exits
Beginning: Exit the trade at the first touch of the order block/FVG.
Middle: Exit the trade at the middle of the order block/FVG.
End: Exit the trade at the full completion of the order block/FVG.
Dedicated Field for Setting Fixed % Value
Set a fixed % value in a dedicated field for the Fixed parameter. This field works only for the Fixed parameter. When selecting other exit parameters, this field is ignored.
🟠 ADDITIONAL SETTINGS
Trailing Stop, %
Set a Trailing Stop as a percentage of your trade to potentially increase profit based on historical data.
Move SL to Breakeven, bars
Move your StopLoss to breakeven after exiting the entry zone for a specified number of bars. This can enhance your potential WinRate based on historical performance.
Skip trade if RR less than
This feature allows you to skip trades where the potential Risk-to-Reward ratio is less than the number set in this field.
🟠 EXAMPLE OF MANUAL SETUP
For example, let me show you how it works on the chart. You select entry parameters, stop loss parameters, and take profit parameters for your trades, and the strategy automatically tests this setup on historical data, allowing you to see the results of this strategy.
In the screenshot above, the parameters were as follows:
Trade Entry: CHoCH OB (Beginning)
Stop Loss: Entry Block
Take Profit: Break of BOS
The indicator will automatically test all possible trades on the chart and display the results for this setup.
🟠 AUTO OPTIMIZATION SETTINGS
In the screenshot above, you can see the optimization table displaying various entry points, exits, and stop-loss settings, along with their historical performance results and other parameters. This feature allows you to identify trading setups that have shown the best historical outcomes.
This functionality will enhance your trading approach, providing you with valuable insights based on historical data. You’ll be aware of the Smart Money Concept settings that have historically worked best for any specific chart and timeframe.
Our indicator includes various optimization options designed to help you find the most effective settings based on historical data. There are 5 optimization modes, each offering unique benefits for every trader
Trend Entry - Optimization of the best settings for trend-following trades. The strategy will enter trades only in the direction of the trend. If the trend is upward, it will look for long entry points and vice versa.
Counter Trend Entry - Finding setups against the trend. If the trend is upward, the script will search for short entry points. This is the opposite of trend entry optimization.
Stop Loss - Identifying stop-loss points that showed the best historical performance for the specific setup you have configured. This helps in finding effective exit points to minimize losses.
Take Profit - Determining targets for the configured setup based on historical performance, helping to identify potentially profitable take profit levels.
Trailing Stop - Finding optimal percentages for the trailing stop function based on historical data, which can potentially increase the profit of your trades.
Ability to set parameters for auto-optimization within a specified range. For example, if you choose FixRR TP from 1 to 10, the indicator will automatically test all possible Risk Reward Take Profit variations from 1 to 10 and display the results for each parameter individually.
Ability to set initial deposit parameters, position commissions, and risk per trade as a fixed percentage or fixed amount. Additionally, you can set the maximum leverage for a trade.
There are times when the stop loss is very close to the entry point, and adhering to the risk per trade values set in the settings may not allow for such a loss in any situation. That’s why we added the ability to set the maximum possible leverage, allowing you to test your trading strategy even with very tight stop losses.
Duplicated Smart Money Structure settings from our Advanced SMC indicator that you can adjust to match your trading style flexibly. All these settings will be taken into account during the optimization process or when manually calculating settings.
Additionally, you can test your strategy based on higher timeframe order blocks. For example, you can test a strategy on a 1-minute chart while displaying order blocks from a 15-minute timeframe. The auto-optimizer will consider all these parameters, including higher timeframe order blocks, and will enter trades based on these order blocks.
Highly flexible dashboard and results optimization settings allow you to display the tables you need and sort results by six different criteria: Profit Factor, Profit, Winrate, Max Drawdown, Wins, and Trades. This enables you to find the exact setup you desire, based on these comprehensive data points.
🟠 ALERT CUSTOMIZATION
With this indicator, you can set up buy and sell alerts based on the test results, allowing you to create a comprehensive trading strategy. This feature enables you to receive real-time signals, making it a powerful tool for implementing your trading strategies.
🟠 STRATEGY PROPERTIES
For backtesting, we used realistic initial data for entering trades, such as:
Starting balance: $1000
Commission: 0.01%
Risk per trade: 1%
To ensure realistic data, we used the above settings. We offer two methods for calculating your order size, and in our case, we used a 1% risk per trade. Here’s what it means:
Risk per trade: This is the maximum loss from your deposit if the trade goes against you. The trade volume can change depending on your stop-loss distance from the entry point. Here’s the formula we use to calculate the possible volume for a single trade:
1. quantity = percentage_risk * balance / loss_per_1_contract (incl. fee)
Then, we calculate the maximum allowed volume based on the specified maximum leverage:
2. max_quantity = maxLeverage * balance / entry_price
3. If quantity < max_quantity, meaning the leverage is less than the maximum allowed, we keep quantity. If quantity > max_quantity, we use max_quantity (the maximum allowed volume according to the set leverage).
This way, depending on the stop-loss distance, the position size can vary and be up to 100% of your deposit, but the loss in each trade will not exceed the set percentage, which in our case is 1% for this backtest. This is a standard risk calculation method based on your stop-loss distance.
🔸 Statistical Significance of Trade Data
In our strategy, you may notice there weren’t enough trades to form statistically significant data. This is inherent to the Smart Money Concept (SMC) strategy, where the focus is not on the number of trades but rather on the risk-to-reward ratio per trade. In SMC strategies, it’s crucial to avoid taking numerous uncertain setups and instead perform a comprehensive analysis of the market situation.
Therefore, our strategy results show fewer than 100 trades. It’s important to understand that this small sample size isn’t statistically significant and shouldn’t be relied upon for strategy analysis. Backtesting with a small number of trades should not be used to draw conclusions about the effectiveness of a strategy.
🔸 Versatile Use Cases
The methods of using this indicator are numerous, ranging from identifying potentially the best-performing order blocks on the chart to creating a comprehensive trading strategy based on the data provided by our indicator. We believe that every trader will find a valuable application for this tool, enhancing their entry and exit points in trades.
Disclaimer
Past performance is not indicative of future results. The results shown by this indicator do not guarantee similar outcomes in the future. Use this tool as part of a comprehensive trading strategy, considering all market conditions and risks.
How to access
For access to this indicator, please read the author’s instructions below this post

PFCF Price BandPFCF Price Band shows price calculated using the previous period's high and low P/TTM FCFPS (TTM's price to free cash flow per share over the last 12 months) multiplied by TTM's current FCFPS ( Similar to price theory = P/E x expected earnings per share)
If the current P/FCFPS is lower than the minimum P/FCFPS, it is considered cheap. In other words, above the maximum P/FCFPS is considered expensive.
PFCF Price Band consists of 2 parts.
- Firstly, the historical P/FCFPS value in "Green" (if TTM FCFPS is positive) or "Red" (if TTM FCFPS is negative) status changes based on the latest high or low price of TTM FCFPS.
- Second, the blue line is the closing price divided by TTM FCFPS, which shows the current P/FCF.
P.S. It is recommended to use it together with the PE Band indicator because just net profit does not mean that a company has good cash flow.

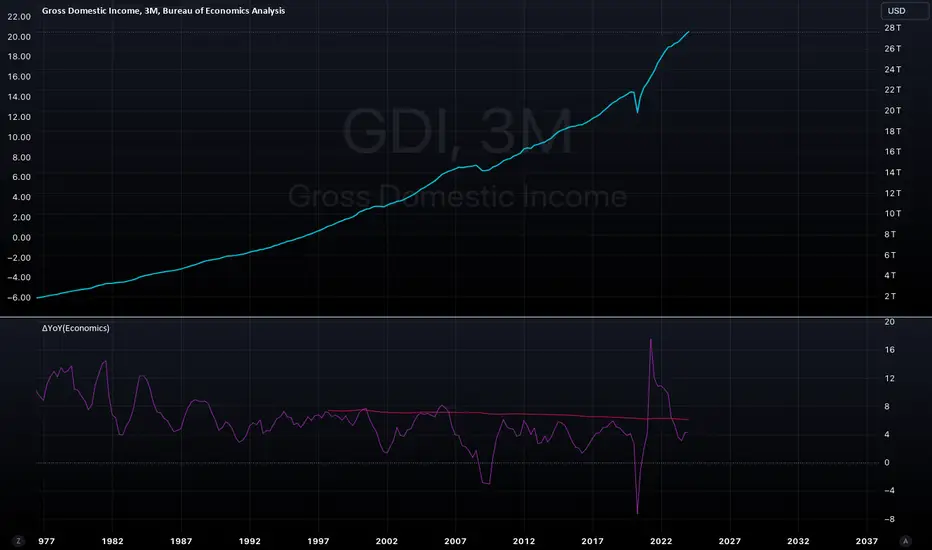
ΔYoY(Economics)Year over year indicator which will benchmark the most recent data vs 1 year lookback; Will automate the lookback for quarterly and monthly data based on timeframe selected (3M for quarterly, 1M for monthly). Tradingview will aggregate weekly data into a monthly data point. SMA applied to get the average over some x period.
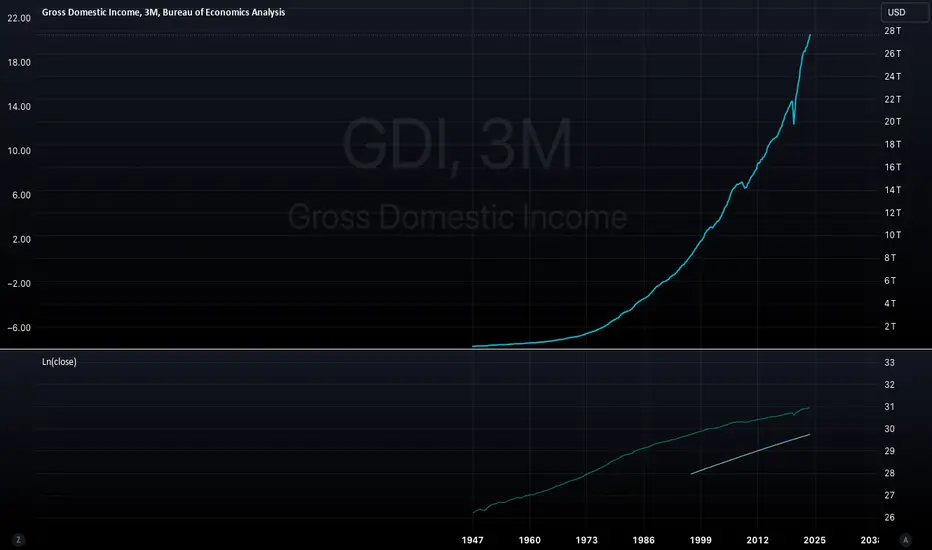
Ln(close)Natural log indicator for normalizing data. SMA applied so you can take the average of that normalization factor. Personally use it for US economic data where the value is very large (GDI, Fed Balance Sheet, USM2 etc.) and the year over year delta is not pertinent (USM2) or not available (GDI.. although I did make an indicator to get YoY :D). Any additional ideas leave a comment and I'll take a look.
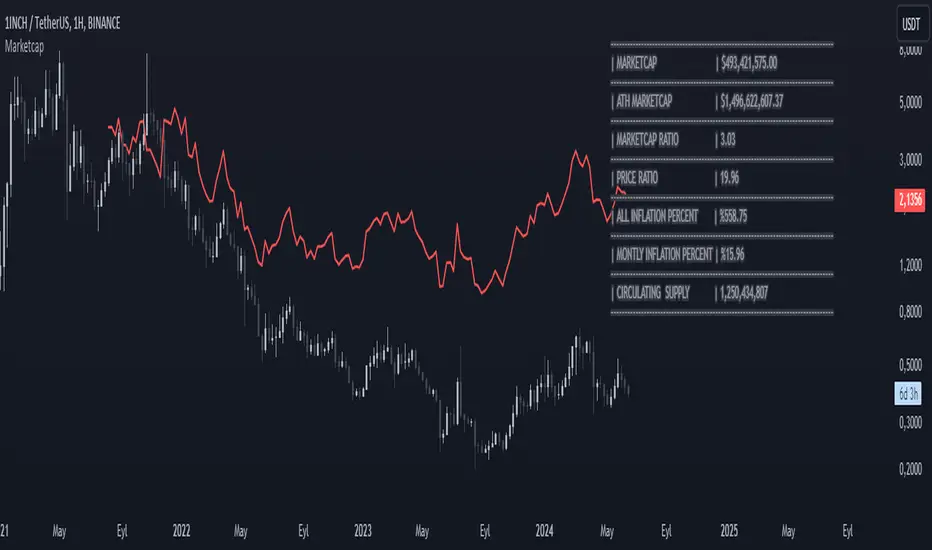
MarketcapDefinition
This indicator was designed to reveal the relationship between the price of the product and its market value. The red average marketcap line that appears on the chart is the line. And the further up this line moves from the chart, the more it shows that there is a mismatch between the price and the market value. So what does this incompatibility mean? There are purchases of the product, but since the supply of the product into circulation is constantly increasing, it means that these purchases are not reflected in the price, which means there is inflation.
The main purpose of our indicator is to calculate inflation of the product. It is the understanding of whether or not the amount of supply put into circulation in response to the investment is reflected in the product price while increasing the market value.
Attention: Transactions are made based on the data received via CRYPTOCAP. In cases where this data cannot be received, the "UNSUPPORTED SOURCE" warning is displayed. You can use Settings to change the source from which data can be retrieved.
Labels
The labels are explained one by one below.
MARKETCAP: Shows the current market value.
ATH MARKETCAP: Shows the highest market value of all time.
MARKETCAP RATIO: It gives the ratio between the highest level and the lowest level of the market value.
PRICE RATIO: Gives the ratio between the highest level and the lowest level of the crypto price.
ALL INFLATION PERCENT: It refers to the percentage of all inflation that has developed so far. It is also the percentage difference between market value and price.
MONTHLY INFLATION PERCENT: It refers to the monthly estimated inflation percentage.
CIRCULATING SUPPLY: It refers to the estimated circulation supply of the product.
Best Use
It should bring to mind the idea that the further the indicator curve moves away from the price, the higher the inflation will be. In order for a product to reach its previous peak, its market value must normally increase by the "MARKETCAP RATIO" value and the "PRICE RATIO" value. This should make you think that this product needs more investment to reach its former peak. And it is necessary to be careful when purchasing such products.
Disclaimer
This indicator is for informational purposes only and should be used for educational purposes only. You may lose money if you rely on this to trade without additional information. Use at your own risk.
Version
v1.0
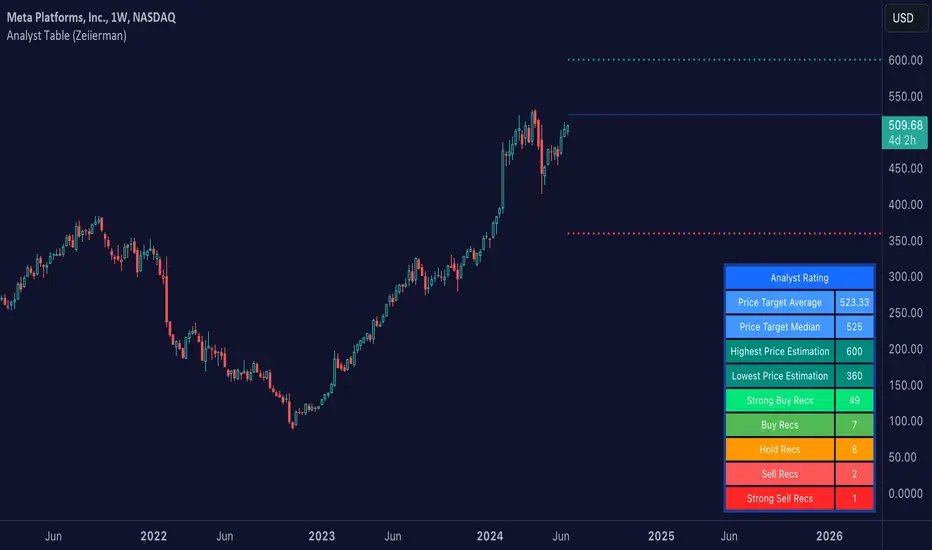
Analyst Table (Zeiierman)█ Overview
The Analyst Table (Zeiierman) provides a comprehensive visual representation of analyst estimates and recommendations for any stock. This indicator displays crucial analyst data, including the highest, average, and lowest price targets, directly on the price chart. Additionally, it features a well-organized table summarizing various types of analyst recommendations, offering traders valuable insights into market sentiment and expectations. This tool is ideal for traders seeking a quick overview of analyst opinions and recommendations on specific stocks.
█ How It Works
The indicator works by retrieving analyst data such as price targets and recommendations from the TradingView data feed. It visually represents these estimates on the chart and creates a structured table for easy reference, consolidating all the information in an organized format.
Key Components:
High Estimate Line: A dotted line representing the highest price target.
Low Estimate Line: A dotted line representing the lowest price target.
Target Estimate Box: A box representing the range between the average and median price targets.
Analyst Table: A table displaying detailed information about various analyst recommendations and price targets.
█ How to Use
Traders can use this indicator to gain insights into the expectations of financial analysts regarding the future performance of an asset. By observing the highest, lowest, and average price targets, traders can assess the range of possible future prices as predicted by analysts. The recommendation table helps in understanding the general sentiment among analysts, whether it's bullish, bearish, or neutral.
Visual Analysis: Use the visual indicators to quickly gauge where the current price stands relative to analyst targets.
Sentiment Assessment: Refer to the table to understand the distribution of buy, hold, and sell recommendations.
█ Settings
The indicator settings allow users to enable or disable different target lines, select colors for the lines and table cells, and choose the position and size of the analyst table on the chart.
-----------------
Disclaimer
The information contained in my Scripts/Indicators/Ideas/Algos/Systems does not constitute financial advice or a solicitation to buy or sell any securities of any type. I will not accept liability for any loss or damage, including without limitation any loss of profit, which may arise directly or indirectly from the use of or reliance on such information.
All investments involve risk, and the past performance of a security, industry, sector, market, financial product, trading strategy, backtest, or individual's trading does not guarantee future results or returns. Investors are fully responsible for any investment decisions they make. Such decisions should be based solely on an evaluation of their financial circumstances, investment objectives, risk tolerance, and liquidity needs.
My Scripts/Indicators/Ideas/Algos/Systems are only for educational purposes!