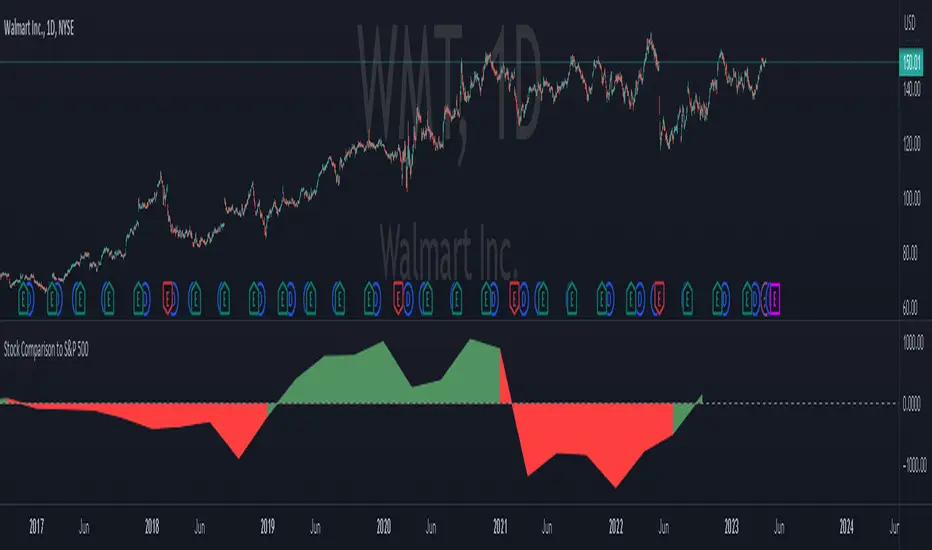
Stock Comparison to S&P 500This indicator, "Stock Comparison to S&P 500," is designed to help traders compare the financial health and valuation of a chosen stock to the S&P 500 index. It compares several key financial metrics of the stock to the corresponding metrics of the S&P 500, including earnings growth, price-to-earnings ratio, price-to-book ratio, and price-to-sales ratio.
The indicator calculates the differences between each metric of the selected stock and the S&P 500, and then weights them using a formula that takes into account the importance of each metric. The resulting value represents the overall comparison between the stock and the S&P 500.
The indicator also displays the differences between the individual metrics in separate plots, allowing traders to see how each metric contributes to the overall comparison. Additionally, it colors the plots green if the selected stock is performing better than the S&P 500 in a particular metric and red if it's performing worse.
Traders can use this indicator to gain insight into the relative financial health and valuation of a selected stock compared to the S&P 500 index, which can help inform their trading decisions.
Fundamental Analysis
BTCUSD Price prediction based on central bank liquidityIn recent months the idea that Bitcoin prices are increasingly linked to liquidity provided by central banks has gained strength. Multiple opinion leaders in the bitcoin space have shared their thoughts to explain why this is happening and why it makes sense. Some of these people I'm talking about are Preston Pysh, Dr. Jeff Ross, Steven McClurg, Lynn Alden among others.
The reality is that the correlation between market liquidity, measured as Assets held by the Federal Reserve, Bank of Japan and European Central bank, and Bitcoin prices is high. This made me wonder whether a regression between "market liquidity" and BTCUSD prices made sense in order to understand where Bitcoin prices are in relation to the liquidity in the market. After several trials I ended up fitting a polynomial regression of degree 5 between Market Liquidity and BTCUSD prices since 2013. This regression resulted in r-squared value of 90.93%. I initially visualized the results in python notebooks but then I thought it would be cool to be able to see them in real-time in tradingview.
That's where this script comes handy...
This script takes the coefficients and intercept from the polynomial regression I built and applies them to the "market_liquidity" index. In addition, it adds upper and lower bound lines to the prediction based on a 95% confidence interval. As you will see, particularly since 2020, the price of bitcoin has rarely been above or below the lines representing the 95% confidence interval. When price has actually crossed these lines it's been in moments where Bitcoin was highly overbought or oversold. Therefore this indicator could be used to understand when it's a good moment to enter or exit the market based on central bank fundamentals.
Here's the detailed step-by-step description of what the script does
1) It defines the coefficients obtained from running the regression betweeen "market liquidity" and BTCUSD. Market liquidity is defined as:
Market liquidity = FRED:WALCL + FX_IDX:JPYUSD*FRED:JPNASSETS + FX:EURUSD*FRED:ECBASSETSW - FRED:RRPONTSYD - FRED:WTREGEN
2) It defines a scale factor. The reason for this is that coefficients from the regression are very small numbers, given the huge numbers of the value of assets held by central banks. Pinescript doesn't support numbers with many decimals and rounds them to 0, so the coefficients had to be scaled up in order to be able to calculate the regression results.
3) It calculates market liquity with the formula defined above. Market liquidity is calculated in US Dollars.
4) It calculates the predicted BTCUSD price based on the coefficients and the market liquidity values.
5) It scales down the values by the same factor used to scale the coefficients up
6) It defines the standard deviation of the "potential_btcusd_price_scaled" and the actual BTCUSD prices.
7) It defines upper and lower bounds to the BTCUSD price prediction using a z-score of 1.96, which is equivalent to 95% confidence interval.
8) Lastly it plots the BTCUSD price prediction (orange) and the upper (red) and lower(green) confidence intervals.
The script can be updated as the correlation of BTCUSD to central bank assets changes (the slope values can be updated).
How to use it:
When actual BTCUSD price (blue line in the chart) crosses over the red line (upper bound) or crosses under the green line (lower bound) it should be taken as a sign that the price of BTCUSD may be overvalued or undervalued based on the value of assets held by major central banks.

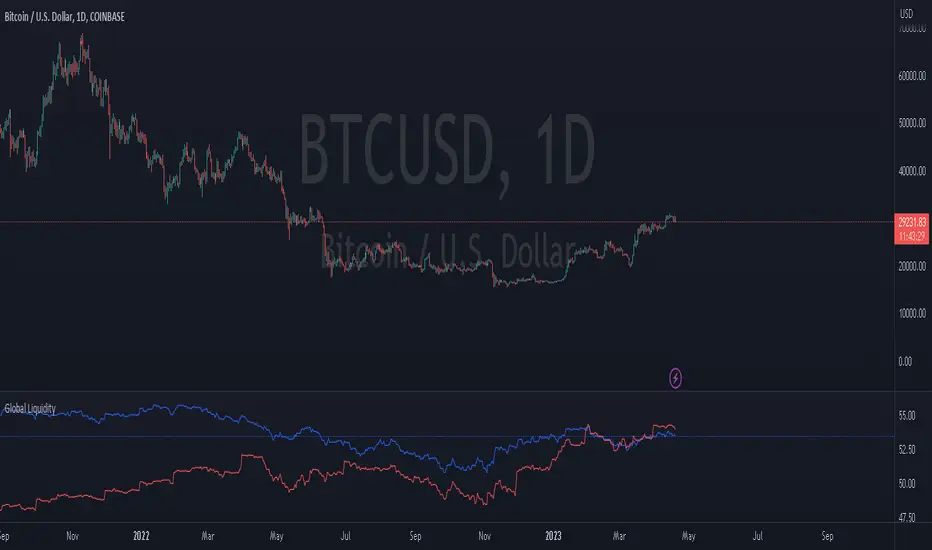
Global LiquidityThe "Global Liquidity" script is an indicator that calculates and displays the global liquidity value using a formula that takes into account the money supply of several major economies. The script utilizes data from various sources, such as the Federal Reserve Economic Data (FRED), Economics, and FX_IDC.
The indicator plots the global liquidity value as a candlestick chart and breaks it down into two categories: the Euro-Atlantic region (West) and the rest of the world (East). The values are denominated both in inflation-adjusted dollars and in trillions of dollars. The script also calculates the spread between the Euro-Atlantic region and the rest of the world.
Traders and investors can use this indicator to gauge the overall liquidity of the global economy and to identify potential investment opportunities or risks. By breaking down the liquidity value into different regions, traders can also gain insights into regional economic trends and dynamics.
Note that this script is subject to the terms of the Mozilla Public License 2.0 and was created by rodopacapital.
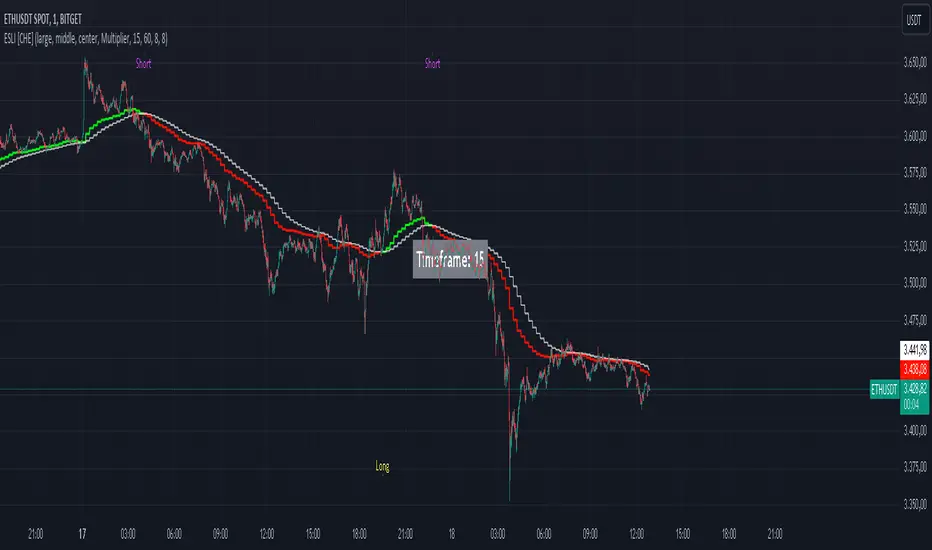
Ema Short Long Indicator[CHE]█ CONCEPTS
This Pine Script is an EMA Short Long indicator that displays the crossing EMA lines on the chart. The indicator uses three exponential moving averages (EMAs) to generate the buy and sell signals. The EMA lines are plotted as green (uptrend) and red (downtrend) lines. When the green line is above the white signal line, the indicator generates a buy signal, when the green line is below the white signal line, the indicator generates a sell signal. Arrows are also displayed marking the buy and sell signals. There is also an option to allow indicator repainting or not. Finally, users can also set alerts to be alerted to potential trading opportunities.
Note: please do not disable "time frame gaps". Allows to calculate the indicator on a Timeframe (TF) different from that of the chart Time window. The TF should ideally be higher than the charts to provide a broader perspective than
the TF of the chart. Using TFs lower than the chart's will deliver fragmentary results, since only the last value of intrabar is displayed (multiple values cannot be displayed for a single chart bar). The Gaps setting determines the behavior when the TF is higher than the TF of the chart. If 'gaps' is checked, higher TF values only come in and are interconnected on the diagram when the higher TF completed. This has the advantage of avoidance Real-time epainting. If Gaps is not enabled, Gaps are filled with the last higher TF value calculated, which will not produce a repaint Values on historical bars but repaint values realtime.
█ HOW TO USE IT
Load the indicator on an active chart (see the Help Center if you don't know how).
Time period
By default, the script uses an auto-stepping mechanism to adjust the time period of its moving window to the chart's timeframe. The following table shows chart timeframes and the corresponding time period used by the script. When the chart's timeframe is less than or equal to the timeframe in the first column, the second column's time period is used to calculate the Ema Short Long Indicator :
Chart Time
timeframe period
1min 🠆 1H
5min 🠆 4H
1H 🠆 1D
4H 🠆 3D
12H 🠆 1W
1D 🠆 1M
1W 🠆 3M
█ DESCRIPTION
The script begins by setting up the chart indicator with a short title, "ESLI", and enabling it as an overlay. It then initializes several variables for time conversions, to be used later in the script.
The timeStep_translate() function converts the timeframe of the chart into a string representing a larger time interval, based on the number of seconds in the timeframe. The resulting string is used to label the horizontal axis of the chart.
Next, the script defines several input variables that can be modified by the user. These include the colors of the EMA lines and the signals, whether or not the indicator is allowed to repaint (i.e. update past values based on future data), and the number of periods used to calculate the EMA and signal lines.
The f_security() function calls the request.security() function to fetch data from the specified security and timeframe, and is used to calculate the EMA and signal lines using the ta.ema() function. The clo variable is assigned the closing price data, adjusted for repainting and timeframe.
The EMA line is calculated using a weighted average of the EMA over the specified period and two times that period, as well as three times that period, divided by six. The signal line is calculated as the EMA of the EMA line over the specified period.
The col_css variable sets the color of the EMA line based on whether it is currently above or below the signal line. The script then plots the EMA and signal lines, and uses the plotshape() function to indicate long and short signals based on the crossovers and crossunders of the EMA and signal lines.
Finally, the script sets up alert conditions using the alertcondition() function to notify the user when a long or short signal is generated, including information about the symbol and closing price.
█ SPECIAL THANKS
Special thanks to LOXX, I wanted to take a moment to express my gratitude for his valuable input in the EMA calculation. His insights and expertise have greatly helped me in improving my Pine Script coding skills. Thanks to his suggestion, I was able to better understand the EMA formula and implement it effectively in my script.
Your generosity in sharing your knowledge and experience is truly appreciated. It is through collaboration and exchanging ideas that we can all grow and become better in our craft.
This script provides exact signals that, with suitable additional indicators, provide very good results.
Best regards
Chervolino

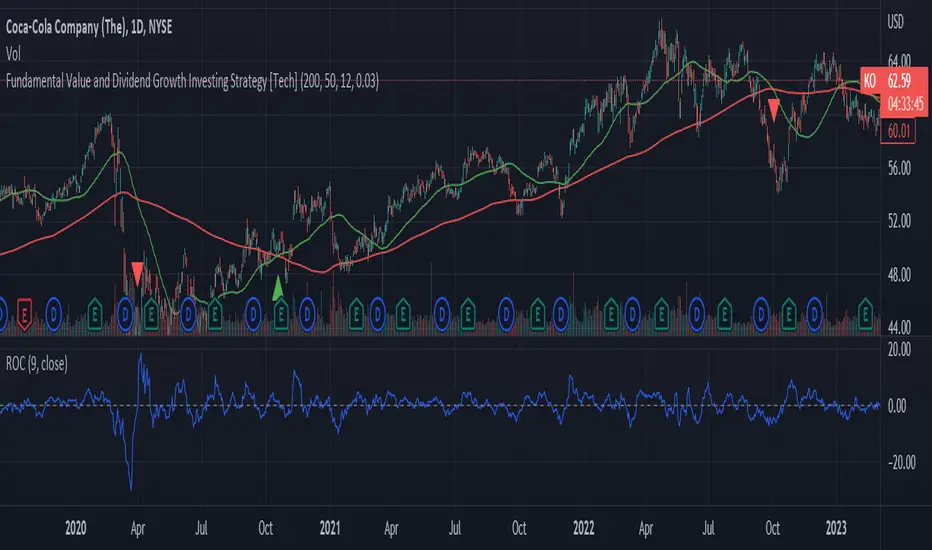
Fundamental Value and Dividend Growth InvestingThis script is an original implementation of a Fundamental Value and Dividend Growth Investing Strategy for traders who want to incorporate these concepts in their trading decisions. The script uses technical indicators to determine buy and sell signals based on a set of criteria.
To use the script, traders can input various parameters, such as the length of the simple moving averages (SMA), the rate of change (ROC) length, and the dividend yield. The script calculates the SMA for the long and short periods, the ROC, and the dividend.
The buy signal is triggered when the current closing price is greater than the short-term SMA, the short-term SMA crosses above the long-term SMA, the ROC is positive, and the closing price is greater than the dividend. The sell signal is triggered when the current closing price is less than the long-term SMA, the long-term SMA crosses above the short-term SMA, and the ROC is negative.
The script plots the signals and the indicators, such as the SMA200, the SMS50, the dividend, and the ROC. The script also includes alert conditions for the buy and sell signals.
The concept underlying the calculations of this script is the Fundamental Value and Dividend Growth Investing Strategy. This strategy aims to identify stocks that are trading below their intrinsic value and have a history of increasing dividends. The SMA and ROC indicators help identify the trends in the stock price, while the dividend yield helps identify stocks with a history of dividend growth.
Overall, this script offers traders an original and useful tool for incorporating Fundamental Value and Dividend Growth Investing Strategy into their trading decisions.
Fundamental ScreenerThis indicator is designed to compare the year-over-year earnings and sales growth, as well as the P/E ratio of up to 10 stocks simultaneously .
This provides valuable insights into the fundamental performance of multiple stocks at the same time, allowing traders to quickly identify which stocks are outperforming or underperforming their peers.
The earnings and sales growth figures are calculated on a year-over-year basis , comparing the most recent quarter to the same quarter 1 year ago.
The P/E ratio is a valuation metric that measures a company's stock price relative to its trailing twelve months earnings per share.
By comparing these three key metrics across multiple stocks, traders can quickly identify which stock in a group has superior fundamentals.
Customization
Chose to compare 5 or 10 symbols
Table position, color, and size

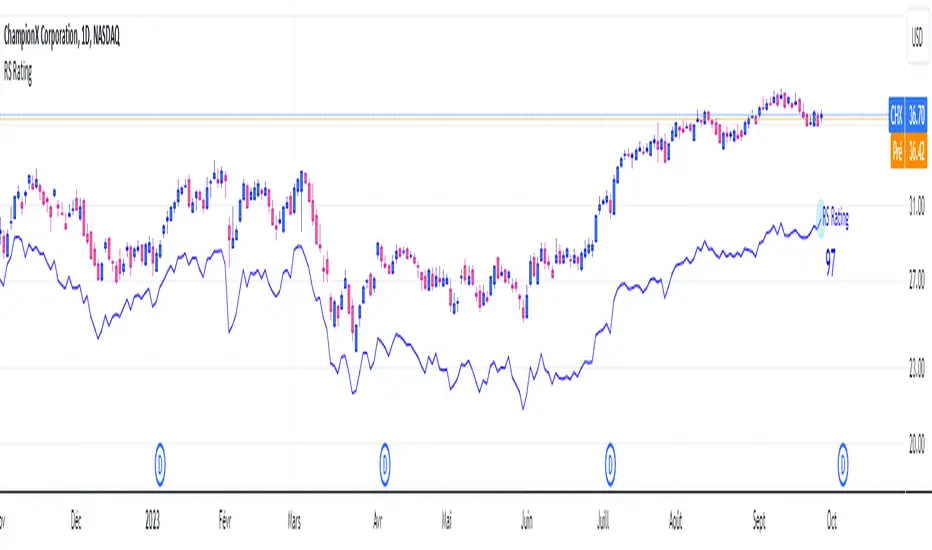
RS RatingHello everyone.
The RS Rating (or Relative Strenght Rating) is a metric that tracks a stock's price performance relative to the rest of the market. Specifically, it looks at a stock's relative strength over the last 52 weeks.
It allows you to identify at a glance stocks that are outperforming the market and may be poised for further gains.
Designed for break-out traders, trend follower, value investors, the RS Rating can help you identify promising opportunities and make informed investment decisions.
The Rating stands as follow:
- From 1 (worst) to 99 (best)
- 99 rating means the stock is outperforming 99% of all stocks in terms of relative share price performance over the last 52 weeks.
The RS Rating is accompanied by the RS line which is a representation of the progress of the asset against the comparative symbol. (Here SP500)
Of course this script is inspired by the IBD rating system.
The results may be equivalent but it is not guaranteed.
This indicator proposes a scoring system in the style of the one proposed by IBD.
Indeed for an optimal result, it would be necessary to compare the relative performance of all actions, which is not yet possible on PineScript.
Here is the formula for calculating the score:
RS Score = 40% * P3 + 20% * P6 + 20% * P9 + 20% * P12
With
P3 = Performance over the last 3 months
P6 = Performance over the last 6 months
P9 = Performance over the last 9 months
P12 = Performance over the last 12 months
There is no equivalent solution for the moment on TradingView.
The rating score will only appear on the daily timeframe.
For now it's my pleasure to share!
Cuban's Open Interest Spaghetti [CE]Cuban's Open Interest Spaghetti is an indicator built for traders to track the open interest changes of highly correlated markets, spreads, and ecosystems.
The tool provides three different viewing modes for tracking open interest; a rolling bar lookback, a specific data and time anchor, and a visible range -- similar to the native Tradingview 'Compare' tool.
Included are pre-built lists for tracking the open interest of all 160+ Binance Futures assets, including custom fields for creating new spreads or watchlists. This gives the trader the ability to monitor the entire futures ecosystem within a single charting window.
We have also added an optional table to the right of the screen so that the trader can clearly see outperforming assets. This table is toggleable using radio buttons within the Style menu.
To improve asset visibility, the script also calculates the 'long tail' of the asset distribution and automatically lowers the visibility of clustered assets in the center.
While the Compare tool only allows for % returns and absolute value on the chart asset or separate scale, Cuban's Open Interest Spaghetti allows the trader to use a separate oscillator window with the open interest on a % scale. This gives the trader the ability to watch OI changes in real-time within any Tradingview window.
Within the user inputs, the user gains the ability to customize the following:
Lookback mode
Rolling lookback period
Timezone and time anchor
Percentage of assets highlighted
Dynamic label offset
Asset lists
TO DO:
Add % labels to assets in the tails of the distribution

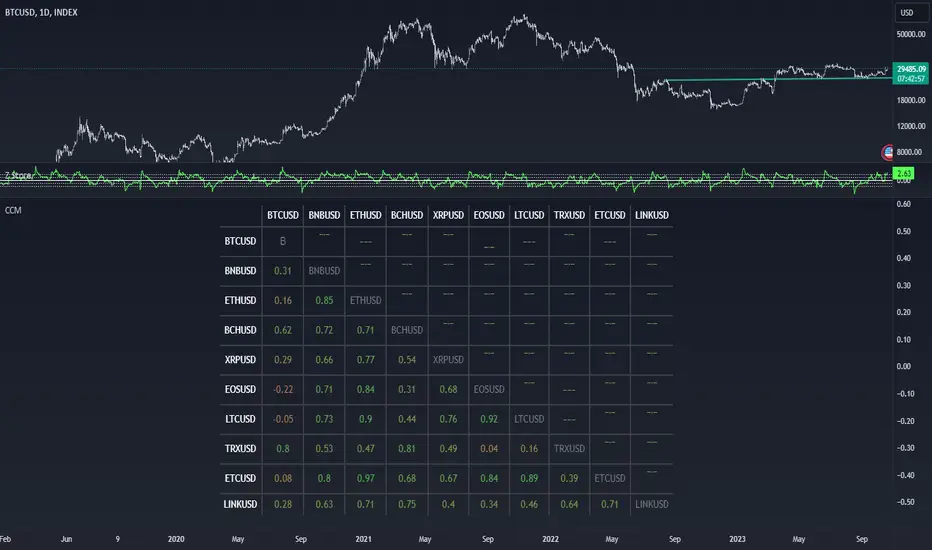
Correlation Crypto MatrixReturns a (top 10 by default) coins matrix correlation between various user-selected symbols
Correlation matrices can be useful to see the linear relationship between various symbols, this is an important tool for analyze market.
Alert with matrix. You can send it to the sheets
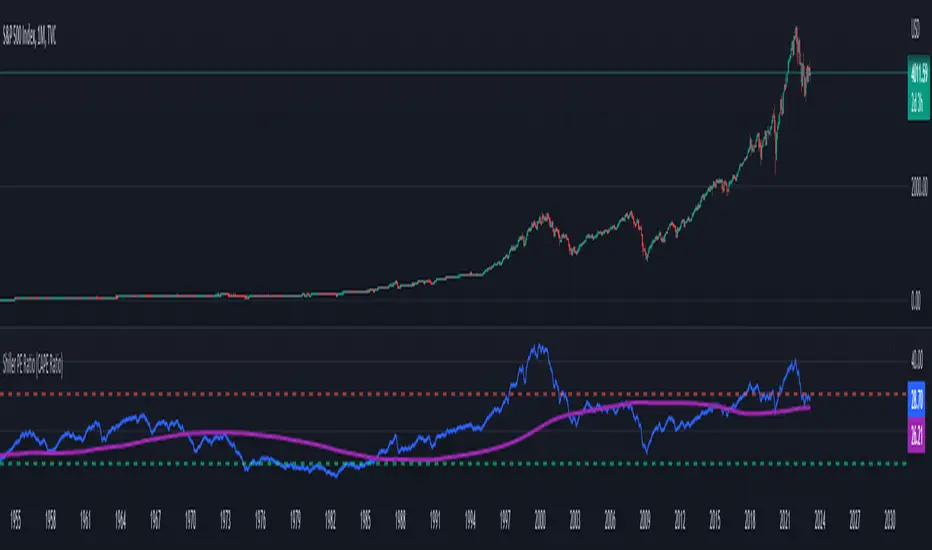
Shiller PE Ratio (CAPE Ratio) [WhaleCrew]Our Implementation of the famous Shiller PE Ratio (aka C yclically A djusted P rice-to- E arnings Ratio) a long-term valuation indicator for the S&P 500.
Calculation: Share price divided by 10 - year average, inflation - adjusted earnings
The indicator works on the M and 12M timeframe and has a built-in moving average that supports an upper and lower bollinger band.
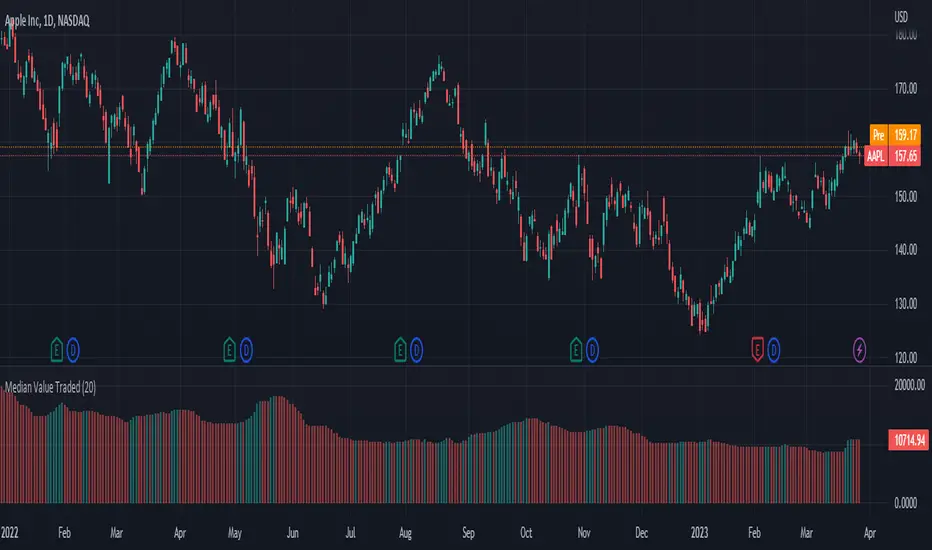
Median Value TradedThe Median Value Traded script is an indicator that allows traders to visualize the median value traded for a particular asset. The median value traded is an important metric as it provides a clearer understanding of the trading activity for an asset, which can be used to inform trading strategies.
To use this script, simply add it to your chart and adjust the "Lookback Period" input as desired. The "Lookback Period" input determines the number of bars used in the median calculation, with a default value of 20.
The median value traded is calculated by taking the product of the volume and closing price for each bar in the lookback period, calculates the median value, and then divides by one million for easier readability.
The script also includes color inputs for the positive and negative columns, allowing traders to customize the appearance of the plot to their liking.
Overall, the Median Value Traded script is a useful tool for traders looking to gain a deeper understanding of trading activity for a particular asset.
IOFin F-Score by zdmre🗣The IOFin F-Score is a discrete score between zero and ten that reflects ten criteria used to determine the strength of a firm's financial position.
🗣It is used to determine the best value stocks, with ten being the best and zero being the worst.
The IOFin F-Score broken down into the following categories:
Profitability
Equity, cash flow, liquidity, and source of funds
Operating efficiency
Criteria Include:
Price to book (P/B) lower than 3 (1 point)
Debt to Equity (D/E) lower than 0.5 (1 point)
Price to FreeCashFlow (P/FCF) equal to or lower than 20 (1 point)
Peg Ratio lower than 1 (1 point)
Sustainable Growth Rate higher than 0.3 (1 point)
Return on Assets (ROIC) higher than 0.07 (1 point)
Return on Equity (ROE) higher than 0.3 (1 point)
EnterpriseValue/Ebitda lower than 10 (1 point)
Quick Ratio equal to or higher than 1 (1 point)
Operating Margin higher than 0.15 (1 point)

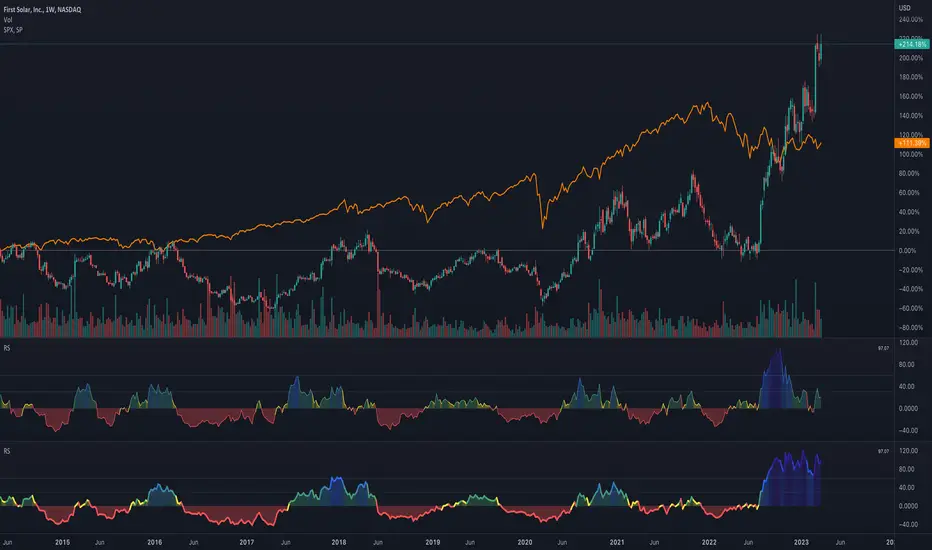
RS - Relative Strength ScoreRelative strength (RS) is a measure of a stock's price performance relative to the overall market. It is calculated by dividing the stock's price change over a specified period by the market's price change over the same period. A stock with a high RS has outperformed the market, while a stock with a low RS has underperformed. (Stock can any asset that can be compared to a reference index like as Bitcoin, Altcoins etc ...)
Here are some advantages:
- Provides a measure of a stock's performance relative to a benchmark index or sector, allowing for a more accurate comparison of performance.
- Helps identify stocks with strong price momentum that are likely to continue outperforming the market in the short to medium term.
- Allows investors to identify the strongest performers within a particular sector or industry.
- Provides a quantitative and objective measure of a stock's performance, which can help reduce bias in investment decisions.
- Can be used in conjunction with other technical indicators and chart analysis to identify potentially profitable trades.
- Helps investors make more informed decisions by providing a more comprehensive picture of a stock's performance.
How to use it:
- The indicator can be used in daily and weekly timeframes.
- Check, if the default reference index is suited for your asset (Settings) The default is the combination of S&P500+Nasdaq+Dow Jones. For Crypto, it could be TOTAL (ticker for total stock market), for German stocks it could be DAX.
- Decide (settings), if you want to see the RS based on annual calculation (IBD style) or based only for the last quarter
Color coding:
- Red: Stock is performing worse than index (RS < 0)
- Yellow: Stock get momentum, starting to perform better than index (RS > 0)
- Green: Stock is outperforming the index
- Blue: Stock is a shooting star compared to index
- When RS turns positive and stays there, it could be an indication for an outbreak (maybe into a stage 2)
No financial advise. For education purposes only.
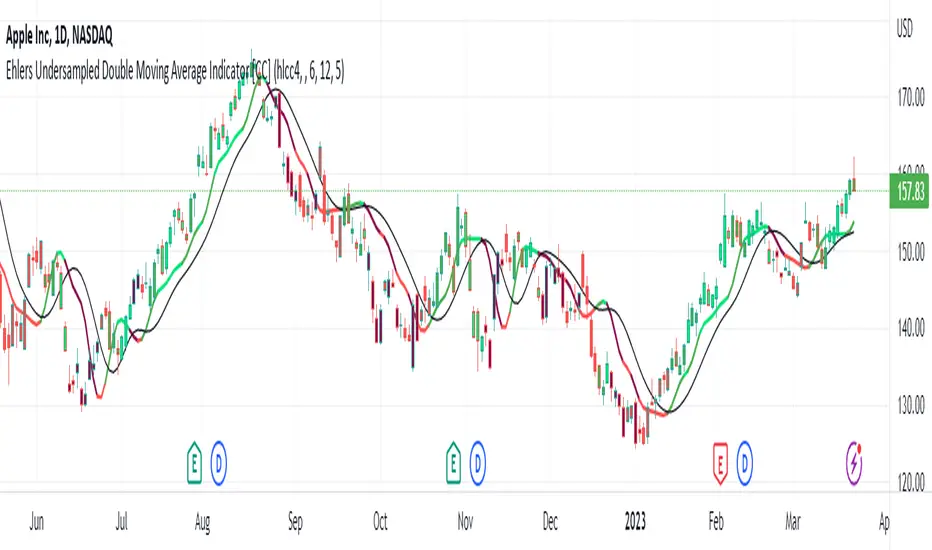
Ehlers Undersampled Double Moving Average Indicator [CC]The Undersampled Double Moving Average was created by John Ehlers (Stocks and Commodities April 2023), and this is a double moving average system which is pretty rare for John Ehlers. For those of you who would like my other take on an Ehlers double moving average, be sure to check out my previous Ehlers double moving average script . He came up with a unique idea for this indicator to create a moving average using a sample of the price data. For example, we use his suggested length of 5 only to use the price data every 5 bars. Feel free to change this, and please let me know if you find a length that works better. He then smooths the indicator using the Hann Windowed Moving Average . I color-coded the lines to show stronger signals in darker colors or standard signals in lighter colors. Buy when the line turns green and sell when it turns red.
Let me know if there is an indicator or script you would like to see me publish!
Stock Intrinsic Value & MOS IndicatorStock Intrinsic Value and MOS Indicator is a powerful tool that can help investors to evaluate the potential value of a particular stock. By taking into account key financial metrics such as earnings per share, price-to-earnings ratio, and dividend yield, this indicator provides a comprehensive analysis of a company's fundamentals, and can be used to estimate its intrinsic value.
To use this indicator, simply input the relevant financial metrics for the stock you're interested in from Yahoo finance, including the P/E ratio, earnings per share, and dividend yield. The indicator will then calculate the stock's intrinsic value based on these inputs, taking into account the company's earnings potential and dividend payments.
In addition to calculating the intrinsic value, the Stock Intrinsic Value and MOS Indicator also allows investors to add a margin of safety to their analysis, which can help to account for unexpected market events or uncertainties. By adding a margin of safety of 20% - 30%, for example, investors can ensure that they are buying the stock at a significant discount to its intrinsic value, providing a cushion against potential losses.
Using the Stock Intrinsic Value and MOS Indicator can be a valuable tool for investors looking to make informed decisions about their investments. By taking into account key financial metrics and adding a margin of safety, investors can be more confident in their investment decisions, and can potentially maximize their returns over the long-term.
However, it's important to remember that the Stock Intrinsic Value and MOS Indicator is just one tool among many that investors can use to evaluate potential investments. As with any investment strategy, it's important to conduct thorough research and analysis before making any investment decisions. Additionally, it's important to keep in mind that no investment strategy is foolproof, and that even the most well-informed investment decisions can still result in losses.
Overall, the Stock Intrinsic Value and MOS Indicator can be a valuable tool for investors looking to evaluate potential investments and make informed decisions about their portfolio. By using this indicator in combination with other tools and strategies, investors can potentially maximize their returns and achieve their long-term investment goals.

ValueViewTitle: ValueView
Description:
ValueView is a script designed to cater to the needs of value investors. Its primary purpose is to provide a comprehensive overview of the financial performance of a stock, making it easier for investors to assess the intrinsic value and potential investment opportunities.
The script displays a concise summary of essential fundamental values and metrics in the form of a customizable table, directly integrated into the chart. This allows investors to evaluate the stock's performance for a variable number of fiscal years, as defined by the user. The input flexibility enables users to focus on the timeframes that are most relevant to their analysis.
ValueView works on timeframes greater than or equal to "DAY", ensuring that the data presented is reliable and relevant for long-term value investing strategies. With this feature, investors can focus on the bigger picture and avoid getting distracted by short-term fluctuations.
With ValueView, investors can choose to select or deselect specific metrics according to their investment strategy and preferences. This feature ensures that users are presented with the information they find most valuable, allowing them to make more informed decisions based on their unique perspective.
Key Features:
Quick overview of the financial performance of a stock for value investors
Customizable table displaying essential fundamental values and metrics
User-defined number of fiscal years for analysis
Select and deselect metrics to tailor the output to individual preferences
ValueView offers a convenient, time-saving solution for value investors looking to gain a deep understanding of a stock's financial performance. With its customizable features and easy-to-use interface, this script simplifies the process of identifying promising investments and making informed decisions.

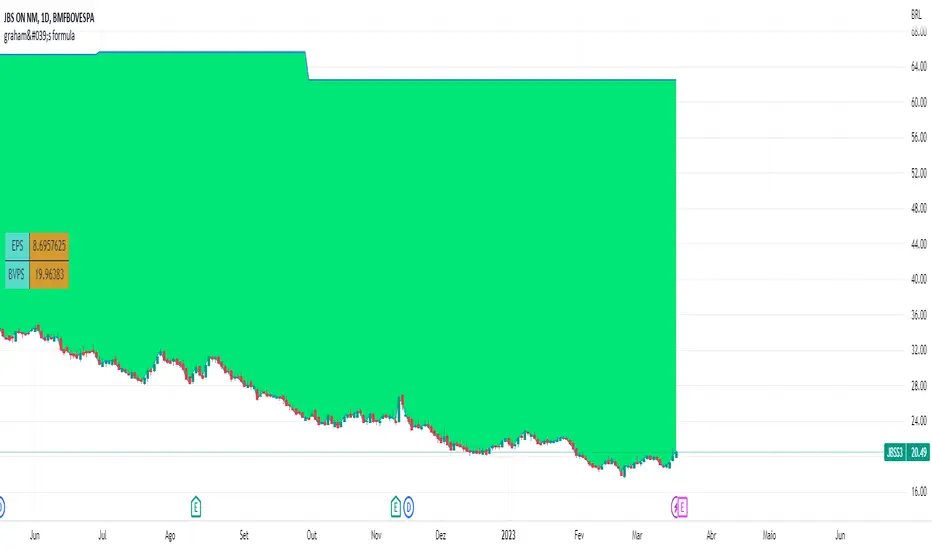
graham's formulaThis indicator plots a line with the fair value of the stock following Graham's formula, VI = √ (22.5 x EPS x BVPS)
coloring the space between the closing price of the stock and the fair value.
It also presents a table containing the last EPS and the last BVPS of the stock.
The Benjamin Graham formula is a formula for the valuation of growth stocks.
It was proposed by investor and professor of Columbia University, Benjamin Graham - often referred to as the "father of value investing".
interest rate gap for forexThis indicator is useful for forex traders.
This script displays interest rate differentials and customizable durations for about 180 currencies.
In general, when interest rate differentials widen, traders tend to buy currencies with higher interest rates.

Economic Data Trading alerts - CPI, Interest rate, PPI, etcDescription:
This indicator is designed to alert based on user-selected economic data for Europe, the US, and Japan. It allows users to define their preferred economic data points and trade direction based on the change in the economic data compared to the previous value.
you can use the strategy to automate economic data trading.
Key Features:
Choose from various economic data points for Europe, the US, and Japan.
Customize trade direction based on whether the economic data is above or below the previous value.
Define entry conditions based on user preferences.
Visualize trade entries on the chart.
Display a table showing the results of executed trades.
Please note that this strategy is provided for educational purposes only and should not be considered as financial advice. Always do your own research and use proper risk management when trading.
The indicator is BETA please make sure to test it before using it.
IMPORTANT: you need to be aware of the fundmentals because the regime changes and markets react to every release of data differently.

Federal Funds Rate Projections [tedtalksmacro]Track the Federal Funds Rate projections for each month via the Fed Funds Rate Futures Contracts CBOT:ZQ1!
This will be updated monthly to ensure that the current and relevant contracts are implemented.
Traders can use this to speculate on whether the Federal Reserve is likely to raise, cut or do nothing to their key interest rate at the next meeting.

Modified Mannarino Market Risk Indicator MMMRI MMRIModified Mannarino Market Risk Indicator MMMRI was developed by "Nobody Special Finance" as an enhancement to the original MMRI developed by Gregory Mannarino. The original and modified version were created as a way to gauge current level of risk in the market. This published indicator includes both versions along with ability to customize the symbols, denominators, and ratio factors that are used within their formulas. Additional options have been included to colorize the candles, plot, and level fills, as well as the option to show or hide a table containing the realtime values for both versions, along with the current dollar strength and 10Y yield.
Levels of market risk are denoted by dashed lines which represent the following levels: 0-50 slight risk, 50-100 low risk, 100-200 moderate risk, 200-300 high risk, 300+ extreme risk. The plot displays whichever of the following two formulas has been selected in the indicator settings, the default choice has been set to MMMRI:
MMRI = (USD Strength * USD Interest Rate) / 1.61
MMMRI = (Debt / GDP) * (USD Strength * USD Interest Rate) / 1.61
NOTICE: This is an example script and not meant to be used as an actual strategy. By using this script or any portion thereof, you acknowledge that you have read and understood that this is for research purposes only and I am not responsible for any financial losses you may incur by using this script!

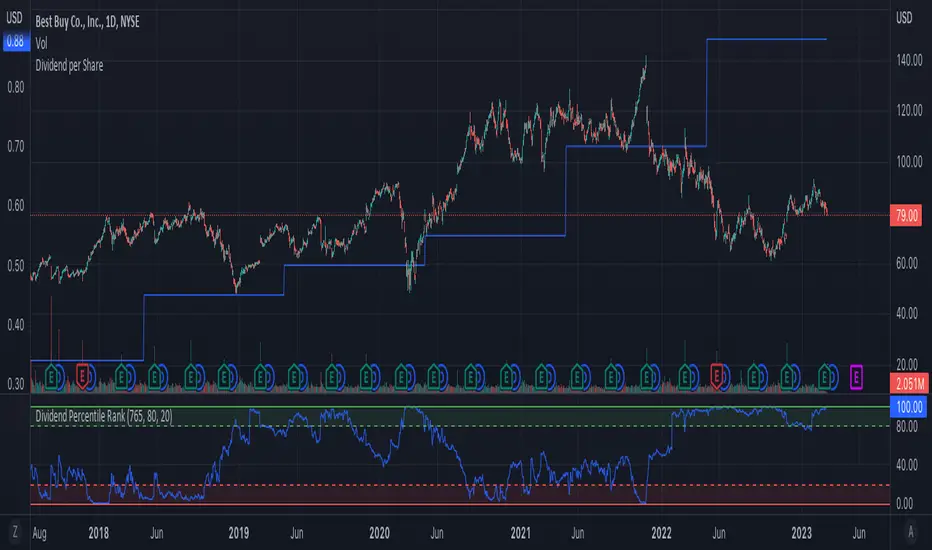
Dividend Percentile RankWhat it does
The Indicator plots the percentile rank of the current dividend yield within the configured lookback timeframe. A percentile rank of 80 means that in 80% of the time within the lookback period the dividend yield was below the current yield. And in the remaining 20% of the time it was above the current yield. While a percentile rank of 0 means that the current dividend yield is below all historical dividend yields within the lookback timeframe.
You can configure three values:
1. Lookback Trading Days: This is the timeframe of past trading days that are used to calculate the percentile rank. The default value is 765 days (~3years) while one trading year is about 252 days.
2. Buy threshold in %: Configures the green zone of the Dividend Percentile Chart
3. Buy threshold in %: Configures the red zone of the Dividend Percentile Chart
How it works
First, the Dividend Yield is calculated. After that, the dividend Yield is used to calculate the percentage rank within the configured lookback period. The result is plotted depending on the configured threshold zones.
What you can use it for
The Dividend Percentile Rank is plotted as an oscillator that oscillates between 0 and 100.
High values, e.g. above 80, can be considered as a buy signal as the current dividend yield is high in comparison to past dividend yields.
Low values, e.g. below 20, can be considered as a sell signal as the current dividend yield is lower in comparison to past dividend yields.
(PS: Always take into consideration to evaluate the companies ability to continue paying dividends in the future. The yield alone is no guarantee for high returns)