Financial MetricsGives a sneak peak into some of the important financial ratios described below:
1. P/E : price to earnings ratio (Green when P/E<15)
2. PEG: Price to earnings growth ratio (Green when PEG<1)
3. P/S: Price to sales ratio (Green when P/S<2)
4. EV/FCF: Enterprise Value to Free Cashflow ratio
5. OPM: Operating Profit Margin % (Green when OPM>15%)
6. D/E: Debt to equity ratio (Green when D/E<1)
7. ROE: Return on equity % (Green when ROE>15%)
8. Div_Yield: Dividend yield
Disclaimer: All the limits defined are based on the widely accepted general values, but are subjective to particular sector or group of stocks. For example IT stocks command higher valuation than cyclical stocks like metal. So Compare with other stocks of the same sector to reach any conclusion.
Fundamental Analysis

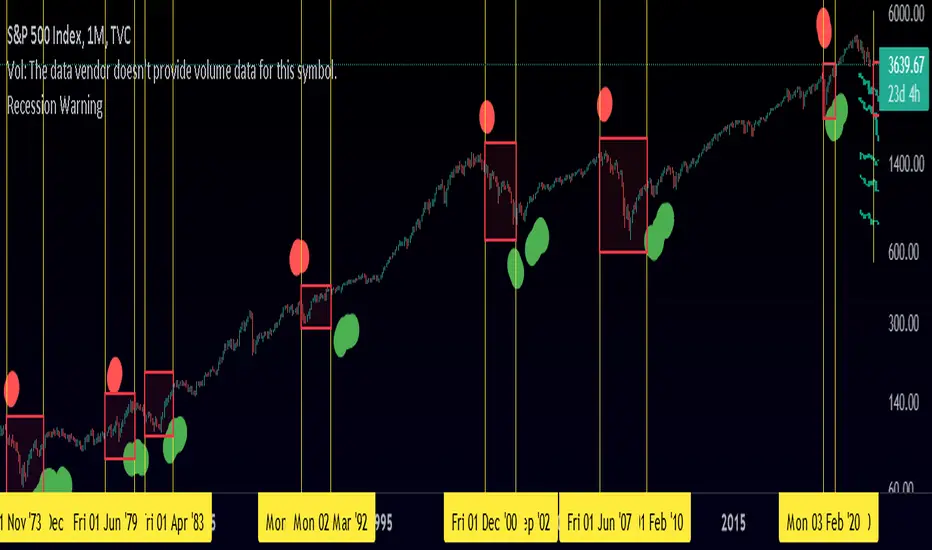
Recession And Bull Run WarningThis script uses 2 moving averages of Unemployment and projects a possible recession period or bull run period.
A Red Dot means a recession could've started or is coming soon - markets could possibly fall for the next few months.
A Green Dot means a bull run could begin following a recessionary period - markets could possibly rally for the next few months.
Using Unemployment to define recessionary periods has been highly accurate and has very often predicted many downturns and bull runs way before they occurred, as history suggests of course.
Have fun with this indicator!
[TTI] IBD Market School––––History & Credit
This is a game-changer! Fully based on the Market School Home Study Program (Retail Price $1,500), the script takes the strict, rule-based market timing system developed by Investor's Business Daily and makes it into a easy to ready automated indicator. So that you take the ego and emotions out of the equation!
Over the years, many investors have been asking for a highly specific, quantitative method to assist them in navigating the market, stating that their existing system is too qualitative in character and focused too heavily on feel rather than predetermined principles.
The IBD Market School develops a common sense strategy that will help you enter every major market uptrend and prevent you from entering every major market downtrend/ You will discover the crucial market cues you need to pay attention to in order to manage your account with this indicator.
–––––What it does
The indicator uses 10 buys signals that will get you into the market rally early and 14 sell signal that reduce your market exposure before a downtrend.
👉 Buy Sell signals
Follow Through Days and Failed Rally Attempts
Rules around the 21-Day Moving Average
Rules around the 50-Day Moving Average
Strength and Weakness Rules
Downside Reversals
Distribution Rules
👉 Investment Allocation Rules
Recommended Portfolio Market Exposure at any given time
Buy Switch
Restrain Rules
Power-Trend
–––––How to use it
The combination of the Buy and Sell rules, together with the portfolio management rules, make sure that you are in line with the market trend The Market Exposure box gives information on the Recommended % of total portfolio exposure, that is recommended at any given time. The proliferation of Sell rules indicate danger and the Buy Switch, Restraint Rule and Power Trend indicate show how strong or weak are the current market rallies.
The indicator can be applied on any major market index.

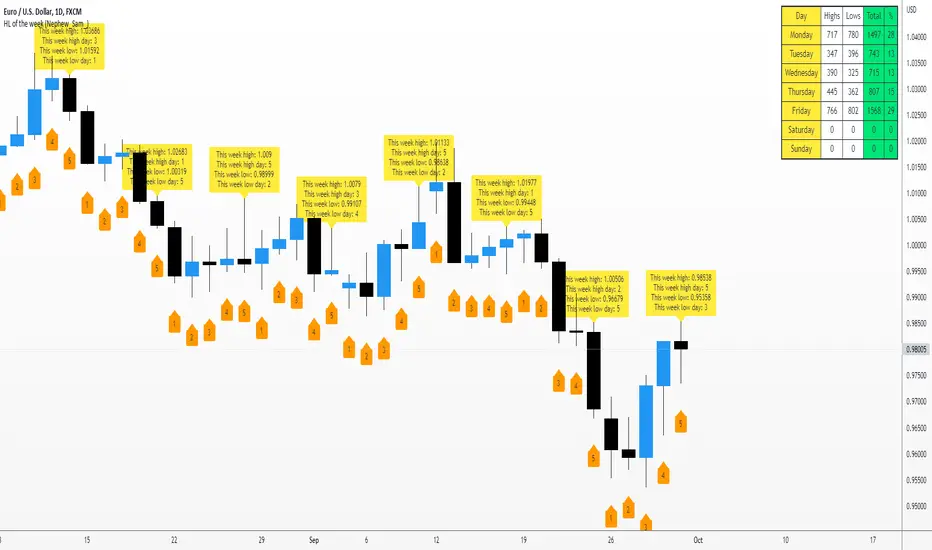
HOTW/LOTW frequencyThis indicator plots a table of the frequency of which day the week the high-of-the-week and the-low-of-the week are formed.
You will need to manually update the symbol open days in the settings (FX = 5, crypto = 7)
Make sure you are on the Daily timeframe to get the correct results
Invest-Long : Script for quick checks before investingA simple script to verify RSI, SMAs, VWMA, and Pivots on Daily, Weekly, and Monthly time frames.
In case if you are not interested in SMA's or want to add different cheks -- simply copy the script to local and edit.
Happy investing.
Add the script to any chart and table values remain the same irrespective of current chart resolution, as it checks on Daily, Weekly, and Monthly time frames.
The table has multiple columns.
1st column checks on RSI value on all 3 timeframes. Ideally, look for all green and D>W>M
2nd Column: Check current Close is above 20 SMA and 50 SMA on Daily / Weekly / Monthly time frames
3rd Column: Check SMA 13> SMA 34, SMA 34 > SMA 55 and SMA 20 > SMA 50 on Daily / Weekly time frames
4th Column: Check Current close is above Weekly Pivot and Monthly Pivot. And also verify Close is above 4 Week High.
5th Column: Verify Close is above Daily VWMA. Also Daily VWMA is > Weekly VWMA and Weekly > Monthly.
// Similarly you can add more checks based on different time frames
Feel free to trouble me incase if need help.

Crypto Map Dashboard v1.0🔰Overview
Charts are an essential part of working with data, as they are a way to condense large amounts of data into an easy to understand format. Visualizations of data can bring out insights to someone looking at the data for the first time, as well as convey findings to others who won’t see the raw data. There are countless chart types out there, each with different use cases. Often, the most difficult part of creating a data visualization is figuring out which chart type is best for the task at hand.
What are the types of metrics, features, or other variables that you plan on plotting? Although it depended on some multiple factors!
But my choices of the chart type for this Crypto datas was Pie chart or Donut char for crypto dominances ,and Colum (Bar) chart for Total MarketCaps .
The audiences that I plan on presenting this for them could be all tradingviewrs , especially crypto lovers ,or those who just aim to have an initial exploration for themselves ,like me!
so this indicator mostly could be an educational indicator script for pine coders !
We can use the " Crypto Map Dashboard " indicator to Get an quick overview of the crypto market and monitor where the smart money Flow changing by comparing the dominances and totals Caps .
In general, it consists of 4 parts:
✅1 =>> Table1 : If you like to see and compare and monitor the changes of dominances of (Bitcoin, Ethereum, Usdt , Usdc , etc.) and their market cap in different times you can see the table on The upper-right corner.
✅2 =>> Table2: Also, in the table lower-right corner, you can see the changes of the totals(Total, Total2 , Total3 and TotalDefi) in the same time periods.
✅3 =>> pie chart or donut chart: By viewing this , you understand better about Table1 Datas, that it depicts exactly how Dominance is distributed and specialized.
✅4 =>> column chart (bar chart) : And in the last you can clearly compare the total marketcaps and see how far they are from their ATHs.
You also can even notice the entry and exit of liquidity from the crypto market!
I must also mention that I am definitely still a beginner compared to more experienced pine coders, and there may be some bugs in my codes and calculations, but I am an open person and I welcome your comments ,Also Let me know if you have any questions.
Lots of Love to all tradingviewers and pineCoder ,Cheers!💚❤️💙

Dynamically Adjusting EMA Crossing
The Exponential Moving Average is the most commonly used indicator in every market. but no one can predict which pair of exponential moving average crossing will work best together. Every instrument require different EMAs crossing. It can be 2 EMA crossings or 3 EMA crossings.
Dynamically Adjusting EMA crossing tries to solve this issue. Algorithm finds the optimal EMA crossing setting for every instrument across all timeframes based on the EMA lengths provided in the settings. It evaluates the most profitable crossing combination for each instrument. The logic backtests the different combinations of EMA crossing based on the EMA lengths provided in the indicator's settings.
There are 3 EMA options in the settings Fact, Slow and Long. Indicator's Settings have the option to choose 2 EMA crossings or 3 EMA crossings.
Default Settings
Fast : 5 to 10
Slow : 13 to 19
Long : 20 to 60
Please do keep in mind that the performance of the indicator reduces as we increase the default settings range.
Please contact me for access

YOY[TV1]Year-to-year comparison is a popular and effective way to evaluate a company's financial performance and investment performance.
Any measurable event that repeats yearly can be compared based on YoY.
As a rule, the indicator YoY (year to year) is the number of percentages indicating an increase or regression in relation to the future or past period.
For example, you can compare WM2NS using the YOY (Year to Year) method.
The Offset argument sets the data comparison period. For daily, weekly and monthly timeframes, if Offset is set to 0, it will be determined automatically.
Сравнение Год к году - популярный и эффективный способ оценки финансовых показателей компании и эффективность инвестиций.
Любое измеримое событие, которое повторяется ежегодно можно сравнить на основе YoY.
Как правило, показателем YoY (year to year) является количество процентов указывающее на прирост или регресс по отношению к будущему или прошлому периоду.
Например, вы можете сравнить WM2NS (эмиссию доллара) с помощью метода YOY (Год к году).
Допустим, в 2021 году вы эмитировали А долларов, а в 2022 вы эмитировали Б долларов
Итак итоговой формулой будет: ((Б - А) / А) * 100
Аргумент Offset устанавливает период сравнения данных. Для дневного, недельного и месячного таймфрейма, если Offset установлен в 0, будет определен автоматически.

Benjamin Graham Net-Net AnalyserA simple indicator that displayers as a table, telling you whether or not the stock you have selected has a current price that is less than 67% of the company's net current asset value per share (NCAVPS) at its last reporting period (FQ, FY, TTM).
Benjamin Graham uses this 67% rule to decide whether or not a stock is significantly undervalued, and studies have shown that investing in companies whose share prices are less than 67% of their NCAVPS can be highly profitable, and will beat markets in the long run.
Feel free to use as you please or repurpose the code for your own projects.

Volume Price and FundamentalsVolume Price and Fundamentals indicators contains 4 exponential moving averages based upon Fibonnaci numbers as period (8, 21, 55 & 144) with crossovers and crossunders.
It also contain a table for volume and 50 Day Avg. Volume, Relative volume, Change in Volume, Volume Value, Up-Down Closing Basis days in last 50 days, Volume ratio (U/D Ratio) on last 50-day Up / Down days and along with fundamental analysis table with various Fundamental Analysis parameters and QoQ & YoY comparison basis for better investment decision making.

Chop and explode (ps5)Description : This is a renovated version of my previous mod that was based on the original script from fhenry0331.
Added are:
a data cleaning function
a seasonal random index function
an updated scaler and
a signalling procedure.
-
The following description is moved here from the old script.
The purpose of this script is to decipher chop zones from runs/movement/explosion spans. The chop is RSI movement between 40 and 60. Tight chop is RSI movement between 45 and 55. There should be an explosion after RSI breaks through 60 (long) or 40 (short). Tight chop bars are colored gray, a series of gray bars indicates a tight consolidation and should explode imminently. The longer the chop the longer the explosion will go for. The tighter the better. Loose chop (jig saw/gray bars on the silver background) will range between 40 and 60. The move begins with green and red bars.
Couple it with your trading system to help stay out of chop and enter when there is a movement.

Auto Quarterly ReportA quarterly report is a summary or collection of unaudited financial statements, issued by companies every quarter (three months).

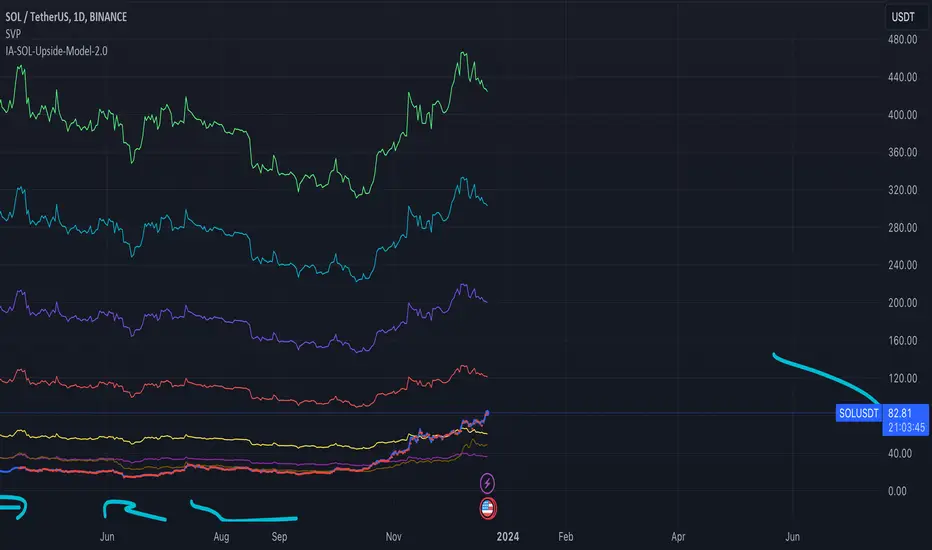
IA-SOL-Upside-ModelThis model will help you visualize the relative prices based on pricing models and also gauge upside for profit taking down the line. Remember, everything mean reverts. This model is also dynamic and will be updated as SOL Dominance changes over time. This model is intended to be used in the daily timeframe with any of the following: SOLUSD, SOLUSDT, SOLUSDC. We prefer SOLUSD on FTX.
Step 1 - Match ADA Market Cap - considering metrics, this should be considered a first step.
Step 2 - 6% ETH Market Cap - 1/17th of ETH market cap is a low bar but was my initial price prediction in April 2021.
Step 3 - 10% ETH Market Cap - next step on the way to 1/10th ETH market cap.
Step 4 - 20% of ETH Market Cap. As Solana develops so will this model.
Disclaimer
InvestAnswers (James) does not provide financial, investment, tax, or legal advice. None of the content on the InvestAnswers channels is financial, investment, tax, or legal advice and should not be taken as such; the content is intended only for educational and entertainment purposes. Kindly use your judgment and do your own research at all times. James shares some of his trades as learning examples but they are only relevant to his specific portfolio allocation, risk tolerance & financial expertise, may not constitute a comprehensive or complete discussion of such topics, and should not be emulated. You are solely responsible for your own financial, investing, and trading decisions.
USD Liquidity Conditions Index Swing Stock Strategy Original credits goes to @ElDoggo22 www.tradingview.com
I looked in the post created by him, of USD liquidity and I have noticed that if you are going to apply a percentile top and bottom to it, can become an interesting swing strategy for US Stocks.
So in this case I decided to create a 99th percentile for top and 4th percentile for bot with a big length, preferably 100+ candles, for this example i took 150.
Rules for entry :
Long : either bot or top lines are ascending
We exit long either the top line is descending, or we have sudden cross of the moving average with both top and bot within the same candle
Short: we enter short when we have a sudden cross down of the moving average with both top and bot within the same candle
We exit short when we have a cross over of the moving average with both top and bot within the same candle ( or we have a long entry condition)
If there are qny questions, please let me know !

CPI and PPIMarket tracker of the year-on-year (YoY) change in inflation (both PPI Finished Goods and CPI).
Useful for identifying the turns in market conditions, and therefore helps with anticipation of changes in monitory policy.
This metric can be used to inform about current market conditions and potential risk=reward outcomes in the future.

BTC Profitable Wallets StrategyBTC Profitable Wallets Strategy - plots the percentage of profitable BTC wallets and places long orders when the profitable wallet share crosses above 50%, historically a very accurate point to catch the next Bull Run early.
The only setting is a smoothing option using the Moving Average method and length of your choice.
On Chain Data is queried from IntoTheBlock.
This is a 'HODL' strategy, with no exit given. If you'd like to see the historical performance check the Open Profit or place a sell order at the current date.

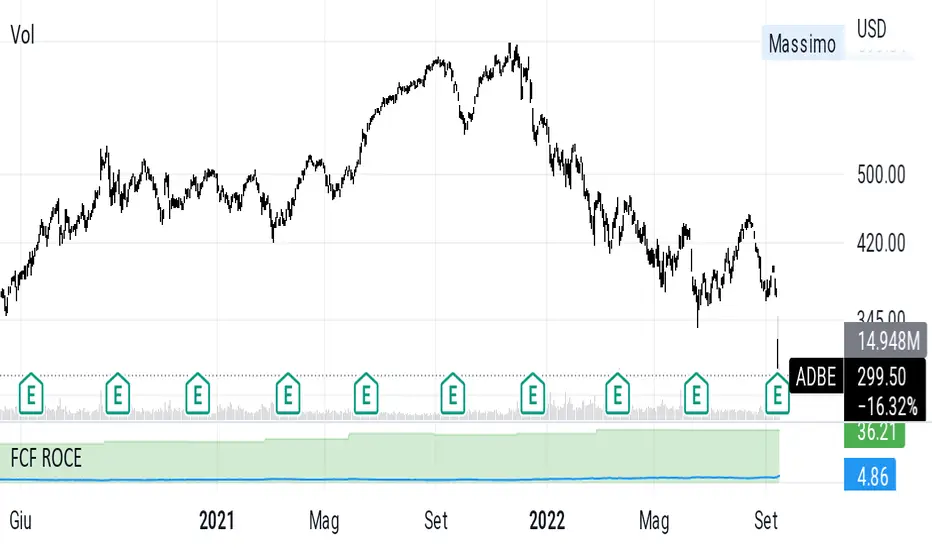
FCF ROCEFree cash flow yield is a financial solvency ratio that compares the free cash flow per share a company is expected to earn against its market value per share. The ratio is calculated by taking the free cash flow per share divided by the current share price. Free cash flow yield is similar in nature to the earnings yield metric, which is usually meant to measure GAAP (generally accepted accounting principles) earnings per share divided by share price.
FCF roce is the modified roce that uses free cash flow instead of ebit
Kalman Gain Parameter MechanicsFrequently asked question is to explain how Gain parameter works in kalman funtion. This script serves as a visual representation of Gain parameter of Kalman function used in HMA-Kalman & Trendlines script. (The function creator's name was misspeled in that script as Kahlman)
To see better results set your Chart's timeframe to Daily.

BTC Twitter SentimentBTC Twitter Sentiment - shows the total numbers of all negative, neutral and positive Bitcoin related tweets.
On default settings, the tweets are plotted in red (negative) white (neutral) as well as green (positive). The three charts are stacked so the total number of tweets is easily discernible.
Furthermore, there's an optional smoothing setting in the options.
The Twitter Sentiment data is provided daily by IntoTheBlock; Since data is only updated once a day the graph might look chunky on lower timeframes, even with smoothing.

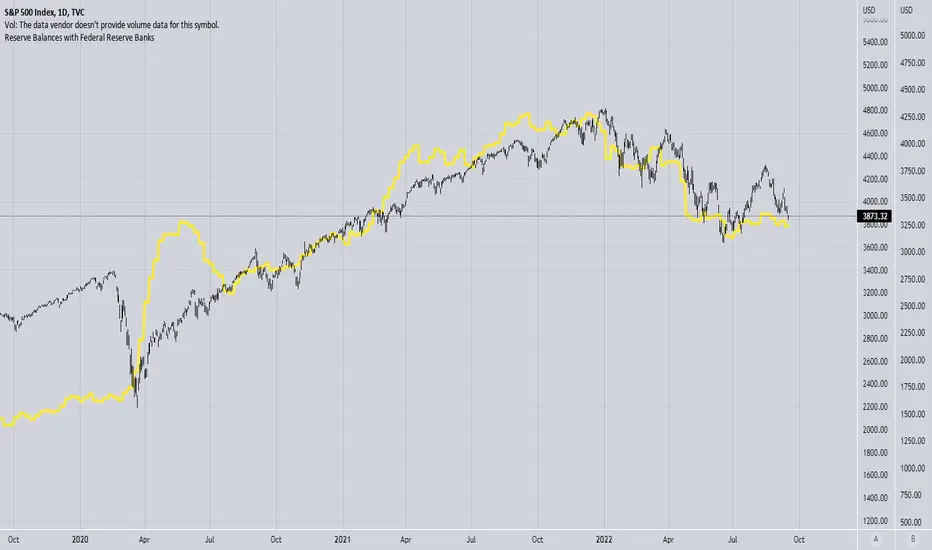
Reserve Balances with Federal Reserve BanksReserve balances with Federal Reserve Banks are the difference between "total factors supplying reserve funds" and "total factors, other than reserve balances, absorbing reserve funds." This item includes balances at the Federal Reserve of all depository institutions that are used to satisfy reserve requirements and balances held in excess of balance requirements. It excludes reserves held in the form of cash in bank vaults, and excludes service-related deposits
MQ ValueCharts(R)What does ValueCharts(R) do?
There are three primary attributes that help determine price, and that's Cost, Momentum and Value. ValueCharts(R) provides the value component in helping to understand whether price is overpriced or underpriced, which can help determine the optimal time to get into or out of a market. ValueCharts(R) is designed to identify when a stock, option, futures, forex, crypto, index, etc. is overvalued, fairly valued, or undervalued. If a market is overvalued, then it's less likely to keep rising in price. If a market is undervalued, then it's less likely for its price to continue falling.
How does ValueCharts(R) work?
ValueCharts(R) calculates value based on price variability. It analyzes price ranges and movement over a user-specified number of bars to identify when price is at a value extreme relative to a longer-term view of price variability. ValueCharts(R) is an original indicator based on the patented ValueCharts concept (U.S. Patent No. 7,461,023), which is held by the script author. The validity of the ValueCharts algorithm has been vetted by leading experts at Wharton School of Business, the University of Michigan, and UCLA.
Since value is often related to recent price action, two equal adjacent bars with identical open, high, low, and close may have different value scores, since an equal prior bar can affect the value of the current bar. Thus, value can vary even when price does not move. Value varies by timeframe as well, allowing users to identify value correlation between timeframes within the same market. Users can identify being significantly overvalued on a daily chart and adjust their intraday trading with the daily value in mind. Users can adjust the number of bars considered in the calculations to provide a shorter-time view with higher responsiveness, or a longer-term view that reflects a more gradual value scoring. Smaller AnalysisPeriod input values, such as 5, result in greater responsiveness of the indicator to reflect more immediate value extremes. Larger values, such as 14, are more applicable to longer multi-day trades and longer value trends, while shorter inputs are more useful for day trading, for example. A second input, ScalingMultiplier, is a multiplying factor that is generally left unchanged at 0.2, but can be used to linearly expand or contract the subgraph plot values.
We generally find lower AnalysisPeriod values to work best as they provide the greatest responsiveness, even across higher timeframes. ValueCharts(R) determines a mathematical score for each bar's open, high, low and close, and plots the results on a subgraph as an OHLC bar atop color ranges drawn as regions on the subpanel. The color ranges depict 5 different states: Significantly Overvalued (Upper Red), Moderately Overvalued (Upper Yellow), Fairly Valued (Middle Green), Moderately Undervalued (Lower Yellow), and Significantly Undervalued (Lower Red). This makes it simple for users to identify when value is in any of these 5 states so they can make informed decisions about where price may go next, helping to determine when to get in or out of trades.
How is ValueCharts(R) best used?
ValueCharts(R) scores its results and maps them onto a color-coded subgraph to inform the user of the current Value status. Users typically monitor the high point and low points of the bar plot within the indicator to identify what color band each bar reaches. If a bar reaches into a color band, then we consider that bar to be in that state. For example, if a ValueCharts bar reaches into the upper red zone, then it's considered "Significantly Overvalued", and the corresponding price bar is considered "significantly overvalued". Our analysis has shown that when a price bar is significantly overvalued, there's a greater than 90% chance that price will not continue much further, and could possibly reverse at that point. Similarly, when a bar is considered Significantly Undervalued, there's a greater than 90% chance that price will stop falling, perhaps moving sideways, or even reverse higher. This doesn't happen all time, of course, and some markets respond more faithfully than others. Users can see the historical plots to determine whether the current market is aligning well with the signals in the currently selected timeframe. While no one can guarantee what the next bar will do, we can quickly see whether previous ValueCharts(R) signals have worked well for this symbol and timeframe.
Value Zones are as follows:
Significantly Overvalued (red)
Moderately Overvalued (yellow)
Fairly Valued (green)
Moderately Undervalued (yellow)
Significantly Undervalued (red)
The yellow zones depict moderately over- and undervalued zones, where there's a roughly 67% chance that a market will stop moving in that direction. In the center, the green "Fairly Valued" zone is when a market is neither over- nor undervalued. We can sometimes use this zone as a "Value Reset" area, where we move back to a neutral value position, and can move in either an over- or undervalued direction from there. We often see that momentum will continue to push value into the opposite extreme rather than reverse. This works well, as we can sometimes experience markets that are cycling from overvalued to undervalued and back again, which is especially applicable to non-trending markets.
Multi-timeframe Convergence
We can also use ValueCharts(R) across multiple timeframes for the same symbol to identify Multi-Timeframe Value Convergence. If we are significantly Overvalued on more than one timeframe, it creates a more compelling value case than one timeframe alone. In addition, Value state can be more significant on a higher timeframe. We use this concept in implementing a no-trade filter, for example, where if we're significantly undervalued on the 240-minute chart, we refrain from taking bearish trades for the remainder of that trading day, since there's a greater than 90% chance that price will not move lower once it's Value is significantly undervalued.
Inputs:
AnalysisPeriod Value from 5 to n, identifies how many bars of history to consider in value determination, defaults to 5 for fastest responsiveness, though some longer-term traders prefer 14.
Mult A scaling multiplier to amplify the results. Typically keep this at 0.2
SignificantColor Color of the Significantly Overvalued and Significantly Undervalued color ranges, defaults to Red
ModerateColor Color of the Moderately Overvalued and Moderately Undervalued color ranges, defaults to Yellow
FairColor Color of the Fairly Valued color range, defaults to Green
BarColor Color of the bar that overlays the Value color bands within the indicator plot. Defaults to Gray so it appears on both light and dark charts. Suggest using White or Black depending on dark or light colored charts.
Transparency The % transparency level of the indicator's color regions, making it easier to see the Value OHLC bar that appears in front of it. Defaults to 60 for 60%. 0 is opaque, 100 is fully transparent.
Version Provides the version number / ID of the indicator
Additional usage suggestions
Visibility: ValueCharts(R) works on either a light or dark color theme. By default, the indicator's OHLC bars are gray, which is visible on either color theme. You can increase the contrast by changing the Bar Color input to Black on a light background, or to White on a dark background. You can also enhance the visibility by setting the input, Color Transparency to a larger number, such as 60. This will mute the colors, allowing the OHLC bars to stand out more.

PEG Ratio (Most Accurate)Price Earnings To Growth (PEG) Ratio
PEG ratio is a stock's PE ratio divided by the growth rate of its earnings for a specified time period.
The PEG ratio is used to determine a stock's value while also factoring in the company's expected earnings growth, and it is thought to provide a more complete picture than the more standard P/E ratio.
PEG ratio 1 is fair value.
PEG ratio above > 2 is are generally considered overvalued.
PEG ratio below < 1 is Undervalued.
Negative PEG ratio indicate the company no growing in specified time period.
Example of How to Use the PEG Ratio
The PEG ratio provides useful information to compare competitive companies and see which stock might be the better choice for an investor's needs, as follows.
Google (13-Sep-2022) 👍
PEG ratio = 0.38%
P/E ratio = 19.17%
Meta (13-Sep-2022) 👎
PEG ratio = 0.63%
P/E ratio = 12.55%
Many investors may look at Meta and find it more attractive since it has a lower P/E ratio. But compared to Google, it doesn't have a high enough growth rate to justify its current P/E.
Google is trading at a discount to its growth rate and investors purchasing it are paying less per unit of earnings growth. Based on its lower PEG, Google may be relatively the better buy.

BTC Dominance Exclude Stablecoins(USDT, USDC, DAI)This index's goal is to show the true bitcoin dominance relative to other risky crypto assets, excluding the diluting effects of those ever-increasing stablecoin(USDT, USDC, DAI)'s market cap. In this index, we can see the BTC dominance has been solid increasing & construct bottom during recent fear/bear.
Xiaolai Chen
Sept 14th 2022
