Beyond Technical Analysis
Day Trade Review – TSLAThis video is a review of TSLA intraday price action based on a request. It examines how the stock could have been traded using a technical approach. The analysis covers the entire session from the open to the close, showing execution, trade management and decision-making without hindsight bias. It also includes additional insights on time and risk management trading intraday.
If you have any requests for future reviews, let me know.
BTCUSDTap Into the mind of SnipeGoat in this quick market analysis of BTC as I breakdown what BTC is doing & what its about to do.
_SnipeGoat_
_TheeCandleReadingGURU_
#PriceAction #MarketStructure #TechnicalAnalysis #Bearish #Bullish #Bitcoin #Crypto #BTCUSD #Forex #NakedChartReader #ZEROindicators #PreciseLevels #ProperTiming #PerfectDirection #ScalpingTrader #IntradayTrader #DayTrader #SwingTrader #PositionalTrader #HighLevelTrader #MambaMentality #GodMode #UltraInstinct #TheeBibleStrategy
PSA x2 - Be Patient! Long term buying opportunities will come!Just not yet in my humble opinion. Don't play the "but we've dropped so much already we need to go up again before dropping more" card. That is the easiest way to lose your pants.
Yes, the market might rebound a bit before a further leg lower - that's just how the market and supply and demand works - but don't start buying up every equity that's down 10-20% just because you feel like it's dropped so much. Same thing goes for crypto of course - we have MORE ROOM to the downside! Plenty of it!
Happy Trading :)
KULR - Analysis Request - Here's what's happening!With a "quick" analysis, we now have a very good idea of where price needs to go in order for a sustained breakout to happen.
This is the analysis I do on every chart and though this is my first time looking at this chart, we have enough information to set our target entries and to know that if price reaches it, our chances are very high that we have a nice position and entry on our hands (or at the very least, we didn't chase a position - the market does not move based on the amount of FOMO!)
Shoutout again to my long time follower and supporter @chr_wied for the request and as always all my followers should feel free to reach out with any analysis requests and I will do my best to get back to you with a video!
Happy Trading :)
SPY Update + Learn & Understand the concept below!!Red vs. Teal has been the storyline for this downward momentum and it continues to be as we saw a strong hold from (bullish) red earlier in the week and after rejecting off of teal yesterday, this subsequent gap down that we're currently seeing.
If we've built enough bearish liquidity utilizing our green controlled buying, we can see this dump penetrate this 547 support level and continue deeper with a mid-term target in the low $500's.
However, if sufficient liquidity hasn't been built, per the laws of S&D, we will need to continue higher for a bit to grab more sellers and soak up more buyers prior to that penetration.
Whenever the move seems too obvious in the market, expect it to look that way purposely and for it to be a trap. Get you to sell when it's so obviously bearish - and then the market pushes up as you realize that everyone who sold is the reason why it's going to now push up - big money will force you and the others to buy back your sells at a higher price/loss and that's where big money then swoops in, when things maybe started to look a bit bullish, and pushes the market down by selling back to you all your stop loss buys in one fell swoop!
Learn this concept, understand it, and your trading will change forever. That knowledge combined with an understanding of how the algorithms inform the market's liquidity, is why I draw so many lines on my chart.
Happy Trading :)
EURUSD 2April25Price seems o be consolidating within a channel preparing for a major move to the upside.
We are Bullish on 4h and 1h so, leaning towards only BUY scenarios... Not interested in any sell setups. Only getting proactive when price gets into our Areas of Interest as described in the video..
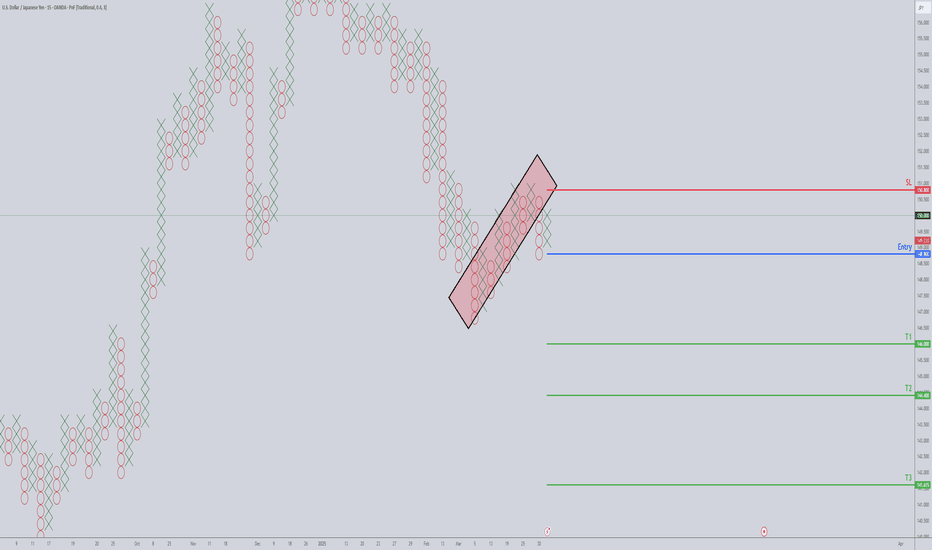
USDJPY Short OpportunityPoint and Figure charting is the OG technical analysis method—no fancy candlesticks or bar charts needed. Unlike other charts, Point and Figure ignores time and focuses purely on price action, offering clarity amid market noise.
If candlestick charts look too chaotic for your taste, Point and Figure usually clears things up. Its simplicity is its best feature: fewer patterns and straightforward trade execution rules, compared to the 150+ patterns of Japanese Candlesticks.
On the USDJPY 40-pip/3-box reversal P&F chart, a bear flag pattern is currently being tested and acting as solid resistance. This creates an aggressive but appealing short entry opportunity at 148.80. Below this entry, there are multiple potential profit targets, with T3 (141.60) marking the maximum realistic expectation.
Now, before you get too excited about a single-column collapse from 148.80 down to 141.60—hold your horses. The odds of USDJPY making such a dramatic drop in one swift move are slim to none. But given the current international trade tensions, stranger things have happened.
Think of the area between 148.80 and 141.60 as a zone where it's easier for USDJPY to drift downward rather than grind upward.
shib/usd updated scenarios !!!shiba inu 2 scenarios predictions, trump tarris coming out for every country this week so it will create a lot of volatility everywhere! stay firm and keep adding our ecosystem will improve how government use crypto !!! united arabs already on board! so a lot of mix news.... any thoughts???
EURUSD 1April25 updateWe seem to have price reacting off the 4h structure as it should instead of the 1hr Internal structure. In our previous video we had both scenarios but lost chose to work with the 1hr Internals hence missing the sell. Price could go ahead and present us a beautiful sell setup during NY session.
RBA Holds Their Cash Rate, May Cut Neither Confirmed Nor DeniedThe RBA held their cash rate at 4.1%, and keep a May cut up in the air without any appetite to commit to one. I highlight my observations on the RBA's statement, before updating my analysis for AUD/USD, AUD/CAD and GBP/AUD.
Matt Simpson, Market Analyst at City Index and Forex.com
SPY - Macro-Market Overview and what the algorithms are sayingCurrently we are being guided by a strong selling teal on the LTF but we must keep in mind the HTF algorithms of red and white (which are bullish liquidity builders). Right now, we need to see who wins out in this fight between teal and red - if we break red and prove teal guidance, we are definitively in strong selling and can easily make our way toward the HTF white at the low $500's.
As always, let the algorithms guide you!
Happy Trading :)


