Beyond Technical Analysis
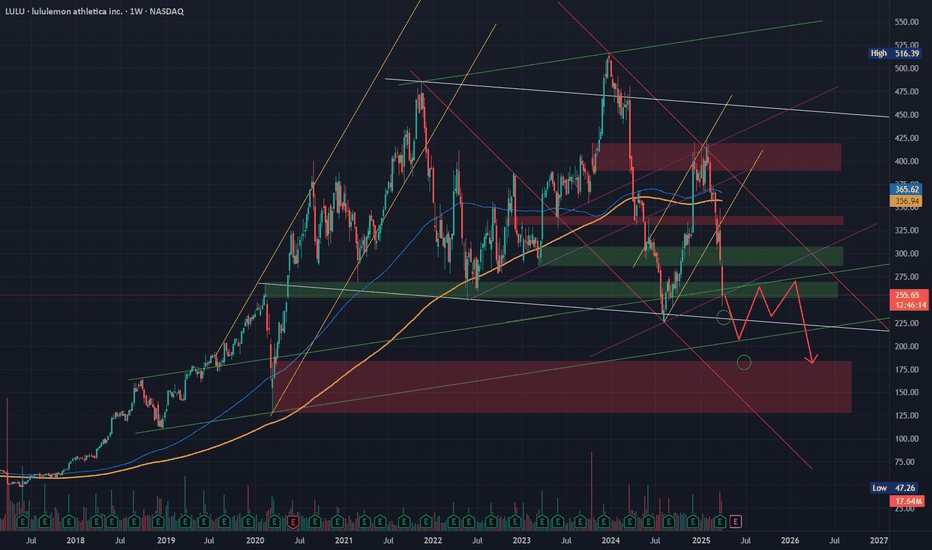
I LOVE THIS CHART.I've been a huge fan of this company since they aired every commercial at the super bowl - and i've thus been seeing their incredibly strong growth. Obviously, geopolitical matters come into play with a Chinese company which is why it is so important that you do your own analysis here. But as far as technical trading goes, I love this chart and am excited to see the reaction post earnings.
Happy Trading :)
A heartfelt message from human to human. A life lesson. Disclaimer: This video is not an analysis video so for those looking for a TSLA analysis here feel free to skip over.
This video is a heartfelt message from one human to others - I learned some important lessons this morning about haters and about myself and I was given beautiful insight from G-D which will make me a better human being going forward.
To those who come back time and time again to support me, I can't tell you enough how much I appreciate your appreciation - I truly spend my time making these videos to help you.
I continue to pray that G-D silences my soul to those who hate and curse me.
Thank you for listening and I will now get back to the analysis side of this business!
Gold at a Crossroads: Breakout or Sharp Correction Ahead for XAU1. Daily Time Frame (1D)
Channel Formation: The daily chart shows an ascending channel, indicating a consistent upward trend. This structure suggests that gold has been gradually gaining strength over time, with higher highs and higher lows.
Key Levels:
2,507.90: Price is hovering near this key resistance, close to the upper boundary of the channel. This is also near a 15M Liquidity Zone (LQZ), making it a potential reversal point if the price cannot break through decisively.
2,500.953 and 2,477.895: These are marked as 4H Liquidity Zones (LQZ), providing support within the current channel. A drop below these levels could signal a deeper pullback towards the Daily LQZ at 2,352.710.
2. 4-Hour Time Frame (4H)
Continuation Pattern: The 4H chart mirrors the ascending channel visible on the daily chart. The price is currently testing the resistance area, and there is potential for a pullback if it fails to break above.
Liquidity Zones:
2,507.180: This is a 15-minute LQZ, very close to the current price.
2,500.953: A more significant 4H LQZ is just below the 15M LQZ. The confluence of these zones adds weight to the potential for a reversal or a strong move if this area is breached.
3. 15-Minute Time Frame (15M)
Rejection and Potential Correction: On the 15-minute chart, there is a small rising wedge pattern that appears to be breaking down, indicating a potential short-term reversal. The price is rejecting the upper boundary of the wedge, suggesting that a correction could follow.
Trade Opportunity: A break below 2,500.953 (15M LQZ) could lead to a sharper move down towards 2,477.895 (4H LQZ). This aligns with the larger time frame structures, adding credibility to this potential move.
4. 5-Minute Time Frame (5M)
Immediate Reaction: The 5-minute chart shows a rejection of the upper boundary of the ascending channel and a possible small head and shoulders pattern developing. This further supports the bearish outlook in the very short term.
Potential Targets: If the pattern plays out, a move towards 2,500.953 and below would align with the bearish scenarios on the higher time frames.
Conclusion
Short-Term Bearish Bias: Across all time frames, there's a consistent pattern of the price rejecting key resistance areas, particularly near 2,507.90 (15M LQZ) and 2,500.953 (4H LQZ). This suggests that the price may correct downward before any further attempts to break higher.
Watch for Confirmations: If the price breaks below the 4H LQZ at 2,477.895, it could indicate a deeper pullback, possibly towards the daily LQZ at 2,352.710. However, a strong bounce from the current support levels could resume the upward trend.
This analysis aligns with the multi-touch confirmation approachand the rule of three, which emphasizes the importance of repeated touches on a trendline or key level before confirming a breakout or reversal.
BTCUSD Mid-Week UpdateCome Tap Into this wonderful Top-Down Analysis that will bring you the insight to market reading that you need. Or don't, the choice is yours...
_SnipeGoat_
_TheeCandleReadingGURU_
#Like #Share #Subscribe #PriceAction #MarketStructure #TechnicalAnalysis #Bearish #Bullish #Bitcoin #Crypto #BTCUSD #Forex #DayTrader #SwingTrader #PositionalTrader #MambaMentality
This is Wyckoff Volume Spread Analysis for TradingView - Buying In this short video, Author of "Trading in the Shadow of the Smart Money" explains the importance of volume and price analysis. This example shows a Volume Spread Analysis trade set up called "Potential Professional Buying"followed by "A Test in a Rising Market". The example used is of Gold, and the same set up happened in the spot and futures contracts simultaneously.
We use our Wyckoff VSA plug in for TradingView that was recently launched and we will be posting weekly charts for you to follow. Here at TradeGuider, the company that developed the plug in for TradingView, we do not use any mathematical formulas, but instead use the analysis of Supply and Demand, Case and Effect and Effort vs Result measured by the volume on the price bar, the high and low of that price bar (referred to in Europe as the spread and in the US and Canada as the range).
Below is a more detailed explanation of the Wyckoff VSA System. Sorry its a bit long but it is important if you follow us that You understand the underlying logic for the trade. This system works in all markets and timeframes, including stocks, futures, FOREX (Yes you read right, we get tick volume through TradingView for FOREX and it is extremely powerful.).
This is Wyckoff Volume Spread Analysis for TradingView developed by the Inventor of Volume Spread Analysis, Tom Williams, and his protégé, Gavin Holmes, who has now taken over the responsibility for teaching this method to thousands of traders and investors worldwide.
Most traders are aware of the two widely known approaches used to analyse a market- fundamental analysis and technical analysis. Many different methods can be used in each approach, but generally speaking fundamental analysis is concerned with the question of why something in the market will happen, and technical analysis attempts to answer the question of when something will happen.
Volume Spread Analysis, however, is a third approach to analysing any market. It combines the best of both fundamental and technical analysis into a singular approach that answers both questions of 'why' and 'when' simultaneously.
Volume Spread Analysis (VSA) methodology takes a multi-dimensional approach to analysing the market, and looks at the relationship between price, spread or range, and volume. VSA is a proprietary market analysis method conceived by veteran trader, Tom Williams, who was a highly successful member of a professional trading syndicate in the 1960s and also the creator of TradeGuider Systems. (www.tradeguider.com)
The VSA method works particularly well at highlighting the imbalances of Supply and Demand.
VSA builds on the pioneering work of Richard D Wyckoff, a famous 1920's trader. He based his trading decisions on supply and demand in the markets and how they are inextricably linked to professional activity - 'Smart Money' trading (Wyckoff's principles are still taught at the Golden Gate University in San Francisco). In any business where there is money involved and profits to make, there are professionals. Doctors are collectively known as professionals, but they specialize in certain areas of medicine. The financial markets are no different. The financial markets have professionals that specialize in certain instruments as well: stocks, grains, FOREX, etc. The activity of these professional operators, and more important, their true intentions, are clearly shown on a price chart if the trader knows how to read them. Volume is the major indicator for the professional trader.
Volume Spread Analysis seeks to establish the cause of price movements, and from the cause, predict the future direction of prices. The ‘cause’ is quite simply the imbalance between Supply and Demand in the market, which is created by the activity of professional operators. It is the close study of the reactions of these specialists, market makers, professionals, or “Smart Money‘’which will enlighten you to future market behaviour.
VSA looks at the interrelationship between three variables on the chart in order to determine the balance of supply and demand as well as the probable near term direction of the market. These variables are the amount of volume on a price bar, the price spread or range of that bar (do not confuse this with the bid/ask spread), and the closing price on the spread of that bar. For the correct analysis of volume, one needs to realize that the recorded volume information contains only half of the meaning required to arrive at a correct analysis. The other half of the meaning is found in the price range. Volume always indicates the amount of activity going on and the corresponding price spread shows the price movement on that volume.
The effect is either a bullish or bearish move according to the prevailing market conditions. The ‘Smart Money’ operating in the markets are very much aware of the emotions that drive YOU, and the uninformed traders or investors, in your trading.
Why do the members of the self-regulated Exchanges around the world like to keep true volume information away from you as far as possible? The reason is because they know how important it is in analysing a market! The significance and importance of volume appears little understood by most non-professional traders. Perhaps this is because there is very little information and limited teaching available on this vital part of technical analysis. To use a chart without volume data is similar to buying an automobile without a gasoline tank.
Where volume is dealt with in other forms of technical analysis, it is often viewed in isolation, or averaged in some way across an extended timeframe. Analysing volume, or price for that matter, is something that cannot be broken down into simple mathematical formulae. This is one of the reasons why there are so many technical indicators; some formulas work best for cyclic markets, some formulas are better for volatile situations, whilst others are better when prices are trending.
Some technical indicators attempt to combine volume and price movements together. This is a better way, but rest assured that this approach has its limitations too, because at times the market will go up on high volume, but can do exactly the same thing on low volume. Prices can suddenly go sideways, or even fall off, on exactly the same volume. So, there are obviously other factors at work.
Price and volume are intimately linked, and the interrelationship is a complex one, which is the reason Volume Spread Analysis was developed in the first place.
The History of the Wyckoff Method and TradeGuider
Volume Spread Analysis was previously known as Wyckoff Volume Spread Analysis and has been in existence for over 20 years. Driven by an artificial intelligence engine, the TradeGuider SMART VSA System is unique and is capable of analysing any liquid market in any time frame by extracting the information it needs in order to indicate imbalances of Supply and Demand evident in a chart. In doing so, TradeGuider is able to graphically exhibit the essential dynamics of market movement.
As mentioned earlier, this is not a new concept. Tom Williams, the inventor of VSA, is a former syndicate trader. He observed that the markets were being manipulated and that the key to unlocking the truth lay in the relationship shown in the Volume, the Spread of the bar, and its Closing Price.
Tom spent many years studying the concepts of Richard D Wyckoff, a renowned trader during the 1920’s and 1930’s. Richard Wyckoff wrote several books about trading the Markets, and he eventually created the Stock Market Institute in Phoenix, Arizona. At its core, Wyckoff’s work is based on the analysis of trading ranges and determining when the stocks are in basing, markdown, distribution, or mark-up phases. Incorporated into these phases are ongoing shifts between ‘weak hands’, or public ownership, and ‘the composite operator’, now commonly known as “Smart Money”.
When Tom Williams went back to Beverly Hills in the early 1980’s, he began to investigate the possibility of computerizing the system he had learned as a syndicate trader- and so began the evolution of Volume Spread Analysis (VSA). With the assistance of an experienced computer programmer, Tom carefully studied thousands of charts to recognize the obvious patterns that were left when professional operators, or Smart Money, were active. This technique, although simple in concept, took several years to write and is now taught as a methodology in combination with software known as TradeGuider.
How to open a Bullish Debit Call Spreads on ER play $KEYSWhy a Bullish Debit Call Spread?
A Bullish Debit Call Spread is an ideal strategy when you're confident about a moderate increase in the stock price but want to limit your risk. This involves buying a call option at a lower strike price and selling another call option at a higher strike price with the same expiration date. The net effect is a reduced upfront cost compared to buying a single call option, with the trade-off being a capped profit potential.
Setting Up the Trade:
Strike Price Selection:
Buy Call Option: Choose a strike price slightly above the current stock price of $KEYS. This is the level you expect the stock to reach or exceed after earnings.
Sell Call Option: Select a strike price above the one you bought, typically at a level where you believe the stock is less likely to move beyond post-earnings.
Expiration Date:
Opt for an expiration date that provides enough time for the earnings reaction to play out, typically the nearest monthly expiration after the earnings report.
Risk Management:
Max Loss: The maximum loss on this trade is limited to the net debit paid (the difference between the cost of the call bought and the call sold).
Max Profit: The maximum profit is the difference between the strike prices minus the net debit paid.
Break-Even Point: The stock price at expiration must exceed the lower strike price plus the net debit paid for the spread to start generating profit.
Profit Targets and Stop Loss:
Profit Target: Set a target to close the trade for profit if the stock moves favorably towards the higher strike price before expiration.
Stop Loss: Consider exiting the trade if the stock moves significantly against you, or if the thesis behind the trade (a strong earnings report) does not play out as expected.
Final Thoughts:
This strategy is well-suited for traders expecting a positive earnings surprise from NYSE:KEYS but who prefer to manage their risk with a defined maximum loss. By structuring the trade with a spread, you can participate in the potential upside while minimizing the premium paid.
GOLD Pre\Post Analysis | Closing w\ $648.00 USD Profit TodayI do believe gold is going to continue to buy. As much as I know traders are interested in selling at the high, I don't think it is that probable to take that trade and the more you think of every trade in terms of probability, it saves you from taking some really shit trades, honestly.
Would you take a bet that you are either A. unsure you can win or B. know you will lose? Of course not, so why is it you take trades like that?
Take smarter trades.
The real reason you aren't profitable, YETHumble yourself and come to realize that:
1. Nothing is on YOUR time
2. You don't know everything
3. You cannot win every single trade
Most traders struggle in 1 or all of these areas and thus it stops them from actually progressing forward.
Pride cometh before the fall.....
LTF Entry Model using HTF AlgorithmsApologies for the sound mishap in the beginning. My mic picks back up at 9 minutes which is where the action starts to happen as well.
Essentially what I am doing is after identifying a HTF tapering algorithm in the purple up top, we are then looking for LTF liquidity building (blue and orange algorithms) and once orange tapered buying proves control, that's where we look for a selling continuation (red) to activate and drive price down.
It's all the same analysis on multiple time frames! The more you watch these videos, the more it will make sense and the easier it will become.
Happy Trading :)
Drawing HTF Algorithms and Telling a Chart's StoryNot my best video but will definitely be helpful for those looking for a little more direction as to how I draw my algorithms and tell a chart's story -
- Are we being controlled by a bullish liquidity building algorithm?
- Are we respecting a buying continuation?
Multi-time frame analysis is key here if we want to identify the best trade entries - but HTF algos are the key points from which to trade from - those are where the market shows its' intention and moves from.
Please feel free to reach out with any questions or feedback!
Happy Trading :)
Tesla - Possibility Of A BreakoutNASDAQ:TSLA can break out soon:
Over the past two weeks we saw an incredible stock market rally and also Tesla completely reversed the flash crash which we saw in the beginning of August. It is still quite possible that Tesla will break out of the long term triangle and immediately head back to the previous highs.
Levels to watch: $230, $400
Click chart above to see the detailed analysis👆🏻
Keep your long term vision,
Philip (BasicTrading)
ASTS Technical Analysis by Deno Trading: Key Levels Aspects.Lets start with the general chart analysis:
Looking at ASTS on both the 5-minute and 15-minute charts, we observe a sharp rally earlier in the session, pushing the price up to the $37.08 resistance level. However, the price has since shown signs of exhaustion, with two prominent downward moves indicated by the blue arrows on the chart.
Here are some Key Levels:
Resistance:
$37.08: This level represents the recent peak where the price action struggled to sustain momentum. It has acted as a significant ceiling and could continue to be a barrier if the price approaches it again.
Support:
$33.00 - $34.00: This zone served as a strong launchpad during the initial rally and is likely to act as support if the price retraces further. However, breaking below this could signal a deeper pullback.
Expectations:
Potential Pullback:
The chart shows potential for a pullback towards the $33.00 - $34.00 area, especially given the bearish divergence visible on the indicators and the price’s inability to maintain above the $37.08 resistance.
Bearish Scenario:
If ASTS fails to hold above $33.00, we could see further downside pressure, possibly pushing the price back into the $30.00 range, where the next level of significant support lies.
Bullish Scenario:
On the flip side, if ASTS manages to reclaim $37.08 convincingly, it could open the door for a retest of the $39.00 - $40.00 range, with momentum likely picking up as short-sellers cover their positions.