Beyond Technical Analysis
ACH/USDT - Potential Bounce Incoming 30%+ Gains PossibleI'm analyzing the ACH/USDT 4-hour chart and spotting signs of a potential rebound. Here’s what I’m seeing:
✅ Support Zone: Price is testing a key support level around $0.02119, which has held strong in the past. The market appears to be accumulating in this area.
✅ EMA Crossovers: The chart shows a bearish crossover between the 12 EMA and 20 EMA, but watch for a bullish reversal as price approaches this support. Potential for a rebound if the EMAs cross back to the upside.
✅ Volume Delta Analysis: There's a notable increase in volume with a Delta Volume of 28.42%, indicating heightened interest at these levels.
✅ Reversal Probability: The chart shows an impressive 85.6% reversal probability, suggesting a strong chance of a bullish move soon.
✅ Targets: Looking for a potential 30%+ bounce towards key resistance levels at $0.02559, $0.02657, and $0.02845.
📉 Risk Management: Setting a stop loss slightly below the $0.02119 support level to minimize risk in case of further downside.
📈 If support holds and momentum shifts, a strong move upward could follow. Stay vigilant!
🚨 Not financial advice. Always do your own research.
Weekly Market Analysis - 29th March 2025 (DXY & EURUSD Only)Here is my DXY & EURUSD analysis for the upcoming week and month.
I share what I think will happen in terms of anticipating price using the concepts of liquidity and efficiency as mostly taught by ICT.
I hope you find it useful in your perspective of the market.
- R2F Trading
Tesla - There Is Hope For Bulls!Tesla ( NASDAQ:TSLA ) is just crashing recently:
Click chart above to see the detailed analysis👆🏻
After Tesla perfectly retested the previous all time high just a couple of weeks ago, we now witnessed a quite expected rejection of about -50%. However market structure remains still bullish and if we see some bullish confirmation, a substantial move higher will follow soon.
Levels to watch: $260, $400
Keep your long term vision!
Philip (BasicTrading)
CRON- I ask ai to check if this is a Warren Buffett Cigar ButtA cigar butt is a stock that trades at a price too low compared to the assets inside the company.
Warren Buffett learned this strategy from Benjamin Graham, and Mr. Graham learned it during the 1930s great depression when stocks were unattractive and over sold.
CRON might be a cigar butt, and to be sure, I used GROK ai to do some homework for me.
CRON has more cash than the market cap.
tangible book value is higher than stock price.
Company has a negative enterprise value, because they have more net cash than marketcap.
On a down day like today, I added some CRON as a deep value play.
Targeting the tangible book value, I will take profit on half and leave the rest for long term.
enjoy the video! be safe.
-Value Pig
Is there more room for OIL to the upside??? BUY BRENT (OIL)All the information you need to find a high probability trade are in front of you on the charts so build your trading decisions on 'the facts' of the chart NOT what you think or what you want to happen or even what you heard will happen. If you have enough facts telling you to trade in a certain direction and therefore enough confluence to take a trade, then this is how you will gain consistency in you trading and build confidence. Check out my trade idea!!
www.tradingview.com
Green Thumb, Cannabis Growth stock at good entry price multi year 25% earnings grower trading at 25 pe here.
double over sold with rsi and bollinger bands showing low readings.
peg ratio of 1.
tangible book value at 3.02.
buying calls and stock, will take profits on the calls to pay for the stock.
ride the stock for free for years.
Entry Psychology Hey guys, Ray here, and I just entered a trade here.
Doesn't matter buy or sell,
or what currency your trading.
We all enter the market and none of us can ever know the "perfect price".
Therefore, our Stop Loss is inadvertently a key factor in our entries, lot sizes, and psychology.
In this video I explain what I mean...
Please comment if you found this insightful!
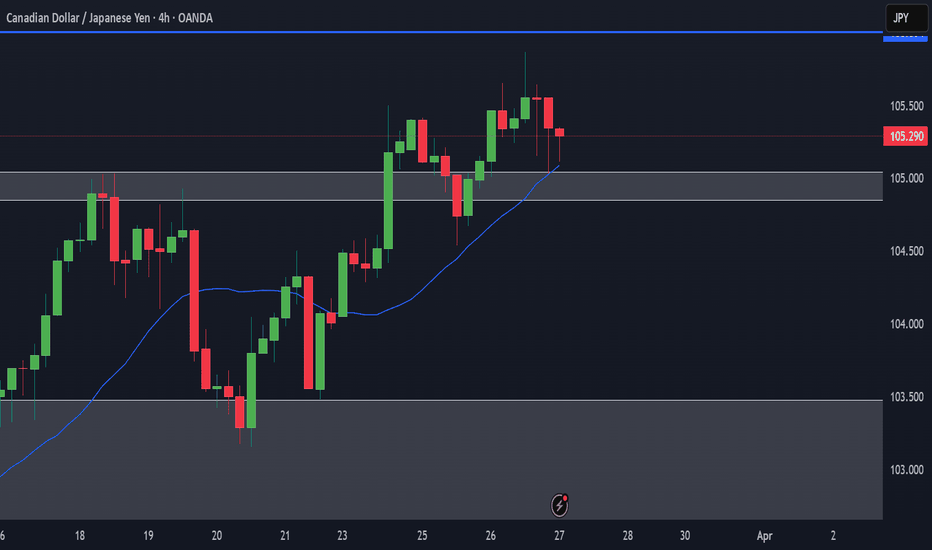
Accurate Entries using the H4, I am BUYING CADJPYAll the information you need to find a high probability trade are in front of you on the charts so build your trading decisions on 'the facts' of the chart NOT what you think or what you want to happen or even what you heard will happen. If you have enough facts telling you to trade in a certain direction and therefore enough confluence to take a trade, then this is how you will gain consistency in you trading and build confidence. Check out my trade idea!!
www.tradingview.com
"Bitcoin's Bullish Reversal: Projected Pullback Before Surging TBitcoin has begun a downward trend from March 24th that could last 49 days, with a projected low near $75,000. This area may offer a strong entry point for swing traders aiming for the next leg up. If support holds, BTC could rally over the following 149 days toward a profit target of $154,000 — a potential 100%+ gain. Traders considering this move should watch for signs of reversal near $75K and manage risk with a stop loss just below $70,000 to protect against deeper downside.


