Beyond Technical Analysis
Explanation of Wyckoff VSA Trigger Bar and Future ReactionIn this short video, Author of "Trading in the Shadow of the Smart Money" explains the importance of identifying "Trigger Numbers and Bars" in multiple timeframes.
Markets and price action move because three universal laws:
Supply and Demand
Cause and Effect
Effort Vs Reasult
This example in the Nasdaq futures shows it perfectly.
Wishing You all goodtrading and constant profits,
Gavin D Holmes
Author and Trader
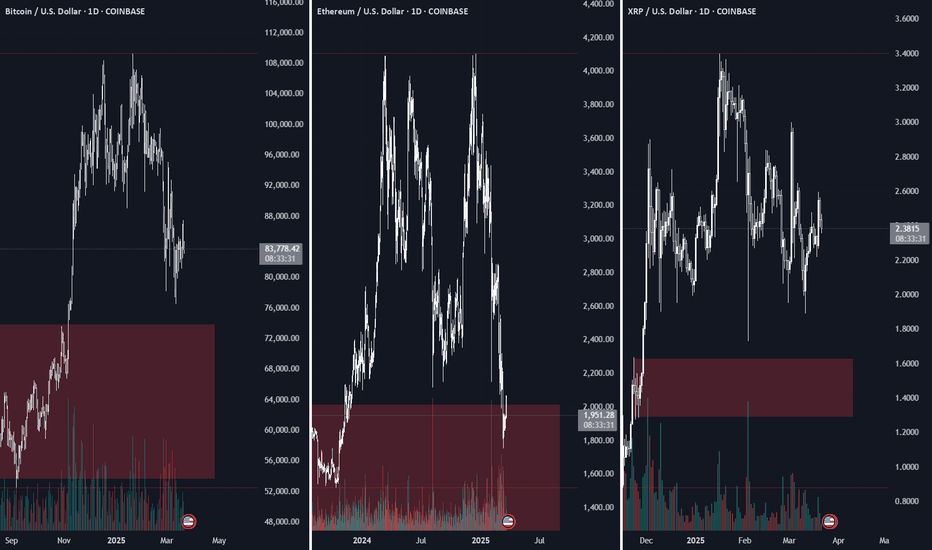
2.5 reasons to not buy crypto todayLet me be clear - I am BULLISH on crypto! But for your wallet's sake, be patient! All (most) crypto investors want to be millionaires by next week on XRP and the like. I won't argue whether you will be or not - but please just give yourself a better entry!
Maybe we pop again before falling, maybe we never fall again, but with the broader markets in a bad place, we have every reason to dip further for more liquidity. For months I've been spitting out this same video in longer form and I simply wanted to show here, in the most basic way possible, why the crypto market wants to come down further. There are SO MANY BUYERS down below! If BTC wants to hit $1MM, ETH $10K and XRP $200, then we will need the liquidity that is sitting below to get there. We will need to shake out the last few that are holding crappy positions near ATH's and reload with larger institutional $.
The past few months in crypto have taught me an incredible lesson about patience because though my analysis has been telling me to wait, wait, wait, I am tempted every day to buy. And I'm not - instead I've been trusting my analysis and intuition and have been shorting BTC futures every chance I get.
Hope this helps someone to NOT BUY crypto today!
Happy Trading :)
The Simplicity of The Algorithms! Love this chart & patternThis short but sweet video clip says it all for me. The market repeats itself - if it repeats algorithms (which I've proven over and over again), then the subsequent movement repeats itself too.
I don't mean to make this look easy because obviously it's one thing to analyze something that's happened and "might happen" in the future - but to actually trade it is very difficult. Because even though we have the keys to the market, it will do everything it can to think we're wrong and don't know what we're doing. It will trick you into selling early, sizing up too soon, getting in too early, etc.
Reach out with any questions, comments, or thoughts!
Happy Trading :)
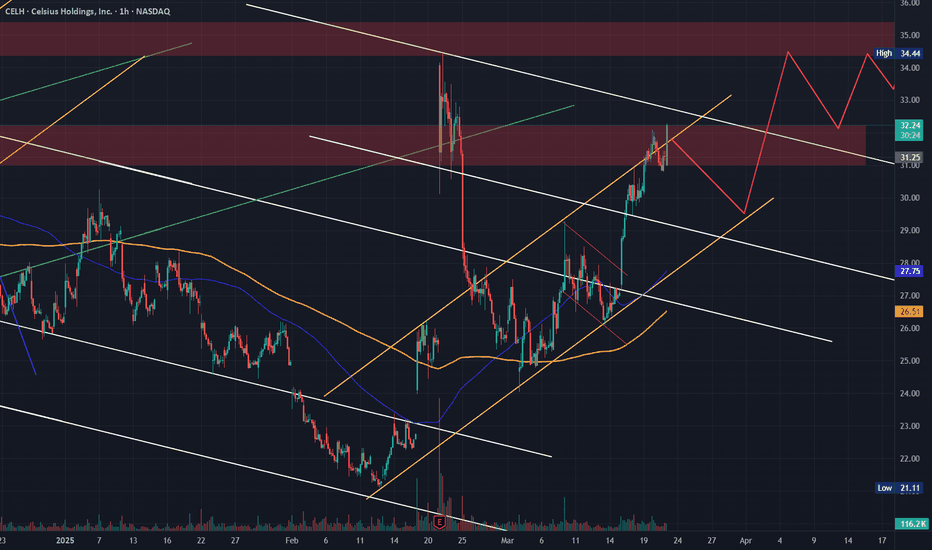
CELH - I Digress! Still very bullish on this chartAs you see from all my linked CELH videos below, I've been watching this and playing this name for the past few months considering the PA and strength of this company (in relation to where it's being valued atm).
Could have kept this video much shorter by simply showing the supply & demand battle that's been going on above us. Mainly the supply levels at $34 (HTF) and $31 (LTF). Love the flow and natural market movements that we've been seeing on this undervalued name and I will be continuing to add to my position in the $28/$29 range if given the opportunity.
Breakout of our LTF supply highlighted in this video is huge for our push to break the HTF $34 supply.
Happy Trading :)
Plan your trade ahead of time to avoid impulsive decisions All the information you need to find a high probability trade are in front of you on the charts so build your trading decisions on 'the facts' of the chart NOT what you think or what you want to happen or even what you heard will happen. If you have enough facts telling you to trade in a certain direction and therefore enough confluence to take a trade then this is how you will gain consistency in you trading and build confidence
www.tradingview.com
Hidden Forces: Decoding Buyer & Seller Activity on ChartsTotal Volume vs. Volume Delta: The total volume on the chart includes both buys and sells, making it less useful for analysis. Volume Delta, however, shows whether buyers or sellers dominated within a candle.
A green Delta candle means more aggressive retail buying; a red one means more retail selling. This helps analyze market sentiment beyond price movement.
Price & Delta Relationships:
1. Price and Delta move together → Organic movement, likely driven by retail.
2. Delta moves, but price doesn’t → Retail is heavily biased in one direction, absorbing limit orders. Possible smart money trap.
3. Price moves, but Delta doesn’t → Retail didn’t participate in the move. Lack of belief or failed market-making attempt.
4. Price moves against Delta → Strong indication of market manipulation. Large players using aggressive strategies against retail.
Market Manipulation & Smart Money:
* Whales leverage retail psychology and order flow to position themselves.
* Retail often gets caught in fake moves, unknowingly providing liquidity to big players.
Final Thought: By analyzing Delta and price movement together, we can spot hidden large buyers and sellers and understand market dynamics beyond surface-level price action.
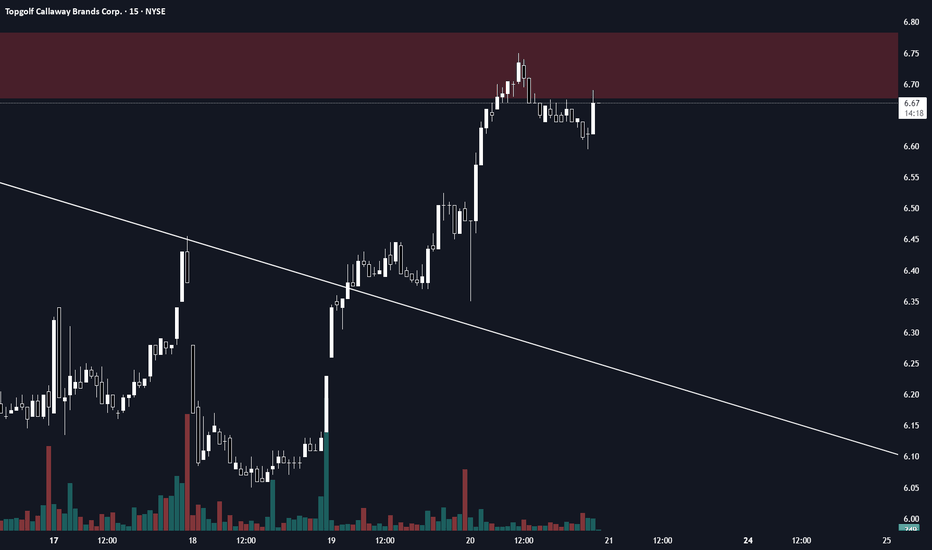
MODG - How to identify and enter a LTF tradeHere's a quick idea and how I could simply analyze a potential trade like this short on MODG:
1. Higher Time Frame intentional target
2. LTF Supply zone (level where known sellers exist)
3. Certain technical confluences within the algorithms, volume, and price action
1-2-3 punch and we've set ourselves up with a potential 1:12 Risk-Reward trade!
Happy Trading :)
QXO - My first mention of a very interesting chartPlease do your own research on this company because it's extremely interesting and enticing!
I first got introduced to this company mid-last year before our strong move into the $17+ and since then we've seen a consistent downtrend. Starting to see signs of tapering and recovery now as we tapped into HTF demand so definitely a chart to keep an eye on - especially with their pending deal to purchase a large roofing company.
Happy Trading :)
Overview on S&P / 6C / 6E / Gold / SilverJust ran down a major overview on where I'm at in responding to a few messages. I left my last scenario mid December where I stated the S&P was overheated and was likely to come down, even if I didn't have a strong enough signal to go for a longer short on the market.
As I had said then, I was mostly interested in the 6E. I made a large chunk off buying the dip on the 6E and cashing out on trends, to include the launch off it recently had. I'm now done with the 6E for the moment.
My current focus is on 6C. The algorithm and math have taken a turn that the 6C is ready to rebound. I entered into it at just under .69, I did have to roll over into the newer contract, but even with the last couple down days, the math still supports a rebound. I almost cashed out today when it had a rough start and fell at .5%, but held through and we have mostly recovered for the day, leaving us with a fairly bearish candle pattern to support the ongoing uptrends pulling is higher.
When it comes to gold, we have multiple trend violations against the 1hr, 2hr, 3hr, 4hr, and 6hr of lower highs. I expect a downswing to correct these, as they are long overdue for some time now before we move higher. I do believe that Gold is destined for higher, just not yet. I haven't gotten any longer-term signals for gold, so I've mostly been shorting in swing trades to net just a couple thousand on this issue.
I am getting a signal on Silver that it is ready to launch. It is not a flawless signal to show it is ready to meet new highs, so I may watch it tomorrow, but ultimately, I may feel more comfortable jumping into silver over gold for a rebound instead of quick shorts. Also, silver has less margin, so it ties up less of my account.
That is where I sit, hope your trades go well, and remember your risk management.
LULU - Updated analysis in a rough marketMarket wide we are seeing massive dips on big names - and obviously the same here for LULU. I am posting this updated analysis while on vacation (apologies for the bad sound and mouse work as I am working on the fly) because I know many are following my analysis on this name and I'd love for everyone to keep an eye on the macro point of view which is always important when we're in a choppy and especially a bearish macro market.
Levels I identified here are all aiming toward us reaching for that $270 demand zone which would ideally bring us some much needed buying momentum heading into earnings. I would not be surprised if we dip there even with a good earnings report considering market-wide we're seeing bearish pressure and people are waiting for opportunities at lower levels to start building a stronger position in companies like LULU.
Happy Trading all :)
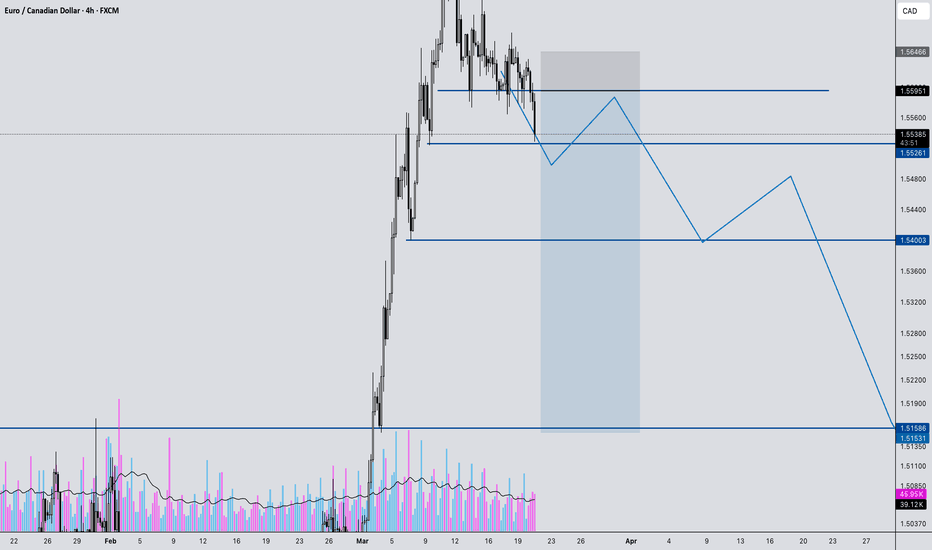
EURCAD Breakdown: Major Reversal Incoming? Watch This Setup!In this video, we analyze a high-probability trade setup on EURCAD, breaking down key market structure shifts and potential reversal zones. 📊
🔹 Massive impulse move into key resistance – Is a pullback coming?
🔹 Breakdown of bullish structure – Signs of a trend shift?
🔹 Key entry & exit points mapped out – Waiting for confirmation at 1.5595
🔹 Targeting major liquidity zones – Potential downside to 1.5523, 1.5400, and 1.5155
If price rejects our marked resistance zone, we could see a strong move downward, stopping out euphoric buyers and creating new trading opportunities. But what if it breaks above? We discuss both scenarios and how to react accordingly.
📍 Watch until the end for a full breakdown and trade execution strategy!
💬 Drop your thoughts in the comments! Do you see something different in this setup? Let’s discuss.
🚀 Like, share, and follow for more market insights!


