WHY SHOULD YOU UNDERSTAND TIMEFRAMES ? ITS ALL ABOUT PERSPECTIVEGood evening traders
I created a video for the more the beginner traders who are just getting into trading. However for those more seasoned this could give you a little insight on how to obtain more clarity and perspective when trading.
My goal here is to educate you on time frames in understanding the micro and macro of the charts you are looking at. Without the layers of perspective one can get lost in the chaos and not know where to start or what the trend is actually doing.
If you like this video please boost, if you dont like this video or want me to touch base on our trading concepts let me know in the comments below
Have a great weekend everyone
MB Trader
Chart Patterns

How To Adjust Your Fibonacci Levels Part 2Hey Traders so today I wanted to continue going over how to adjust your Fibonacci Levels into your trading style without the need for indicators. I will go over some theory and examples and how it can benefit you in your trading.
Enjoy!
Trade Well,
Clifford

How to Adam & Eve PatternEver wondered about Adam and Eve in trading? It's a straightforward and powerful pattern.
Hello dear traders! If you like my graphics, please use Like button 💙💛
Picture Adam as the first market peak or dip, and Eve as the second, forming a U-shape. This pattern highlights a robust price level, suggesting a potential market shift.
How to Utilize It?
In a downtrend, spot Adam and Eve as double bottoms. When Eve follows Adam, indicating a strong support level, consider entering trades. Trade when the price breaks above resistance line, with a stop loss set at the neckline level.
Pay attention to trading volumes. They confirm buying or selling strength, offering a clear signal for a trend reversal.
Finding Your Target:
Identify the pattern's height from the neckline to the peak of Eve. Project this distance downward from the breakout point for a bullish pattern or upward for a bearish one. This gives you a potential target for your trade.
Here is an example of Adam & Eve pattern play on Bitcoin chart:
Master the Adam and Eve pattern to make confident trading decisions. It's an intuitive way to identify market change in trend and make strategic moves. 📈✨

New indicator with a better Weekday Highlight capability Weekday Highlighter (ICT)
This Indicator can be used across all assets (Crypto, Forex, Stocks, ETFs...). The Weekday Highlighter will be handy while trader analyze an asset using ICT-SMC methodology to understand AMD cycle (Accumulation, Manipulation, Distribution) which is crucial for understanding weekly candle patterns
Why this Indicator?
I did try few available indicators in trading view that are used to highlight weekday. They do work fine, but has few problems like the ones that I have mentioned below. This being a straight forward script and does not have any complex logics underneath, I gave a shot to just address that and added features that are good to have.
• Other Indicators just Highlights the selected weekday in the main chart. However, it would still be amidst the clutter of other candles.
• Weekday Highlighter (ICT) Indicator just refines those candles that are “Selected” on to a separate pane thus mitigating visual discomfort, moreover enhances this option to highlight with different colors for different days as needed.
• As a good to have feature I tried to show the selection done in the input screen and furnish in a tidy Table.
• I do respect traders choice and their inclination towards having different table position or Alignment and Size. Hence added the same.
• You can also disable this table display from the style tab in settings popup.
I have planned to add few more features in future on this script, stay tuned.
I am also creating few more scripts similar to this one and scripts on other concepts to find dynamic Levels, Screeners etc. Please reach out to me for Queries on this script or new script creation requests.
Learn More, Trade safe, Earn More...

BOS - Break of StructureBOS means Break of Structure . It happens when the price of an asset (like a stock or currency) breaks past a key support or resistance level, indicating a potential change in the market direction.
Key points:
Uptrend BOS: If the price breaks above a recent high, it could mean the start of an upward trend.
Downtrend BOS: If the price breaks below a recent low, it may signal the beginning of a downward trend.
Traders use BOS to spot potential trend changes and decide when to buy or sell.

CHoCH signalsa Change of Character (CHoCH) signals a potential shift in market dynamics, often indicating a reversal from the prevailing trend. This concept is particularly valuable as it helps traders discern when the momentum is shifting, offering a strategic point to consider adjusting their positions.

Reacting to Change Part 1: Consolidation PhasesWelcome to our 2-part series on adapting to change in trading, where we dive into the art of staying flexible in dynamic market environments. In Part 1, we’ll explore how traders can effectively navigate consolidation phases and avoid the pitfalls of rigid analysis.
The Trap of Over-Defining Consolidation: Price Action is Fluid, Not Fixed
One of the biggest challenges in trading is dealing with consolidation phases—those times when the market enters a short-term equilibrium, leading to a high degree of random price action. During these phases, it’s tempting to box price movements into neatly defined patterns like triangles or channels. While this can offer an initial framework, the reality is that consolidation patterns are constantly evolving. Trying to over-define these phases or stick rigidly to a single pattern often leads to frustration and missed opportunities.
In consolidation, price action is fluid, not fixed. What starts as a symmetrical triangle might morph into a flag, or a sideways range may develop into a wedge. These shifts are common because consolidation phases by definition are periods of indecision, where neither buyers nor sellers dominate, causing price to "walk" in a seemingly random manner. When we try to force the market into the confines of a rigid pattern, we risk missing these subtle changes and become despondent when the market doesn’t behave as expected.
Instead, successful traders stay adaptive. Don’t be afraid to re-draw the boundaries of a consolidation phase as new information emerges. You can begin with an initial hypothesis based on a recognisable price pattern, but it’s essential to remain open to the possibility that this pattern might evolve or even fail entirely. Flexibility allows you to adjust your parameters to reflect what the market is telling you rather than clinging to a fixed idea.
By embracing the fluid nature of consolidation phases and adjusting your approach as price action unfolds, you stay aligned with the market, increasing your chances of catching the eventual breakout or breakdown.
Real-World Example: FTSE 100
In this example, the FTSE 100 moves from a small initial consolidation phase into a sideways range with failures at the top and bottom, before eventually breaking out. Those who failed to adapt to the changing consolidation structure may have been caught out with false breakouts and missed the eventual breakout.
FTSE100 Daily Candle Chart: Phase 1
Past performance is not a reliable indicator of future results
Phase 2
Past performance is not a reliable indicator of future results
Phase 3
Past performance is not a reliable indicator of future results
Breakout
Past performance is not a reliable indicator of future results
Combine Flexibility with Core Principles
While flexibility is key, it’s essential to combine it with a solid foundation of core principles. Flexibility without a framework can lead to erratic decisions, but by grounding your adaptability in a few guiding rules, you’ll better navigate consolidation phases.
1. Aligning with the Dominant Trend: Consolidation phases have a tendency to resolve in line with the dominant trend. Hence, the first step is to define the dominant trend, which varies depending on your trading timeframe. Whether you're using moving averages or trendlines, having a clear sense of the overarching market direction can guide your expectations for a breakout.
2. Defining a Breakout: A breakout from consolidation is more than just price moving outside a range. Look for an expansion in trading ranges, backed by an increase in volume. The combination of these factors helps confirm that the market is truly breaking out, not just teasing false moves.
3. Watch for Changes in Volatility: Volatility often contracts during consolidation phases. One of the best indicators of an impending breakout is when volatility begins to contract. Pay attention to tightening price ranges and be on alert when those ranges start to widen.
Real-World Example: Nvidia (NVDA)
In this example we see the importance of using core principles to as a framework for flexibility. The 50 day moving average (MA) and 200MA clearly show the dominant trend is bullish. This is important during Phase 3 (below) in which the market appears to break lower. In Phase 4 we see clear volatility compression at the top end of the consolidation range – a clear indicator of an impending breakout.
NVDA Daily Candle Chart: Phase 1
Past performance is not a reliable indicator of future results
Phase 2
Past performance is not a reliable indicator of future results
Phase 3
Past performance is not a reliable indicator of future results
Phase 4
Past performance is not a reliable indicator of future results
Breakout
Past performance is not a reliable indicator of future results
Avoiding Despondency Through Flexibility
Expecting a breakout or breakdown that never materialises can lead to frustration, especially if you’re locked into a rigid view of the market. By combining flexibility with your core principles, you’ll be better prepared to react when the market shifts—and avoid becoming despondent in the process.
The secret to successfully navigating consolidation phases isn’t about predicting the next move—it’s about reacting to change while being guided by solid principles. Patterns evolve, and so must your approach. By balancing flexibility with core rules around trend direction, breakouts, and volatility, you can capitalise when the market finally resolves its range.
In Part 2 of our series, we’ll explore how adapting to trend changes is just as crucial as navigating consolidations, and why flexibility is a trader’s most valuable asset in any market condition.
Disclaimer: This is for information and learning purposes only. The information provided does not constitute investment advice nor take into account the individual financial circumstances or objectives of any investor. Any information that may be provided relating to past performance is not a reliable indicator of future results or performance. Social media channels are not relevant for UK residents.
Spread bets and CFDs are complex instruments and come with a high risk of losing money rapidly due to leverage. 83.51% of retail investor accounts lose money when trading spread bets and CFDs with this provider. You should consider whether you understand how spread bets and CFDs work and whether you can afford to take the high risk of losing your money.

How to Trade Gap Up and Gap Down Opening? Full Guide
What is gap up and gap down in trading?
In this article, I will teach you how to trade gap up and gap down opening . You will learn a simple and profitable gap trading strategy that works perfectly on Forex, Gold or any other financial market.
First, let's start with a theory .
A gap up after the market opening is the situation when the market opens higher than it was closed without any trading activity in between.
Above you can see the example a gap up after the market opening on EURGBP.
The price level where the market closed is called gap opening level.
The price level where the market opened is galled gap closing level.
A gap down after the market opening is the situation when the market opens lower than it was closed without trading activity in between.
Here is the example of a gap down after the market opening on WTI Crude Oil.
Why such gaps occur?
There are various reasons why opening gaps occur.
One of the most common one is the release of positive or negative news while the market was closed.
The market opening price will reflect the impact of such news, causing a formation of the gap.
What gap opening means?
Gap openings reflect the sudden change in the market sentiment.
Gap up will indicate a very bullish sentiment on the market while
a gap down will imply very bearish mood of the market participants.
However, the markets do not like the gaps.
With a very high probability, the gaps are always filled by the market very soon.
We say that the gap is filled, when the price returns to the gap opening level.
Above, you can see that after some time, EURGBP successfully closed the gap - returned to gap opening level.
Such a pattern is very reliable and consistent among different financial markets. For that reason, it can provide profitable trading opportunities for us.
You can see that a gap down on WTI Crude Oil was quickly filled and the price returned to the gap opening level.
How to trade gap opening?
Gap Up Trading Strategy
Once you spotted a gap up after the market opening, you should wait for a bearish signal before you sell.
You should look for a sign of strength of the sellers.
One of the most accurate signals is a formation of a bearish price action pattern:
Double top,
Triple top,
Inverted Cup and Handle,
Head and Shoulders,
Symmetrical or Descending Triangle,
Rising Wedge...
Bearish breakout of a trend line / neckline of the pattern will be your signal to sell.
Look at a price action on EURGBP before it filled the gap.
At some moment, the price formed a double top pattern and broke its neckline. That is our signal to sell.
Your stop loss should lie above the highs of the pattern.
Take profit - gap opening level.
Safest entry is on a retest of a broken neckline/trend line of the pattern.
Safest entry point on EURGBP is the retest of a broken neckline of a double top pattern. Stop is lying above its highs. TP - gap opening level.
Gap Down Trading Strategy
Once you spotted a gap down after the market opening, you should wait for a bullish signal before you sell.
You should look for a sign of strength of the buyers.
One of the most accurate signals is a formation of a bullish price action pattern:
Double bottom,
Triple bottom,
Cup and Handle,
Inverted Head and Shoulders,
Symmetrical or Ascending Triangle,
Rising Wedge...
Bullish breakout of a trend line / neckline of the pattern will be your signal to buy .
Let's study the price action on WTI Crude Oil before it filled the gap.
You can see that the price formed a cup and handle pattern.
Bullish breakout of its neckline is a strong bullish signal.
Safest entry is on a retest of a broken neckline/trend line of the pattern.
Your stop loss should lie above the lows of the pattern.
Take profit - gap opening level.
Following this strategy, a nice profit was made.
Always remember that probabilities that the gap will be filled are very high. However, it is not clear WHEN exactly it will happen.
For that reason, you should carefully analyze a price action and wait for a signal, before you open the trade.
That will be your best gap opening trading strategy.
❤️Please, support my work with like, thank you!❤️

EURNZD - A Top-Down Tutorial (ICT)In this video I go through how I perform a top-down analysis and zone in on exactly where I am in price action in order to source for the next high-probability trade. IF there is none, then we stay out until more clues are provided. We DO NOT want to chase price and get in on consolidative and manipulative price action. We want to be hunters, not sheep.
- R2F

Types of traders 101Overview of types of traders
SCALPER
🔸Scalpers buy and sell securities quickly, usually within seconds, with the aim of achieving profits from minuscule price changes from large trade volumes.
🔸Scalper also refers to someone who buys up in-demand merchandise or event tickets to resell at a higher price.
🔸Scalpers buy and sell securities many times in a day with the objective of making consistent net profits from the aggregate of all these transactions.
🔸Scalpers must be highly disciplined, combative by nature, and astute decision makers in order to succeed.
EATRADER / Algo Trader
🔸Algorithmic trader will use process- and rules-based computational formulas for executing trades.
🔸 Algorithmic trader is performing statistical analysis on stocks, funds, or currencies and then writing algorithms and programs using computer languages like C# or Python or PineScript.
🔸While it provides advantages, such as faster execution time and reduced costs, algorithmic trading can also exacerbate the market's negative tendencies by causing flash crashes and immediate loss of liquidity.
Technical Trader
🔸Generally, a technician uses historical patterns of trading data to predict what might happen to market in the future.
🔸A technical trader prefers to study price patterns over time periods ranging from a few minutes to a month. This is usually done using a variety of tools, such as indicators, to understand which way price is moving in any given market.
Swing Trader
🔸Swing trading refers to a trading style that attempts to exploit short- to medium-term price movements in a security using favorable risk/reward metrics.
🔸 Swing traders primarily rely on technical analysis to determine suitable entry and exit points, but they may also use fundamental analysis as an added filter
Fundumental Trader
🔸Fundumental trader focuses on company-specific events to determine which stock to buy and when to buy it. Trading on fundamentals is more closely associated with a buy-and-hold strategy rather than short-term trading.
🔸Furthermore, fundumental traders must understand technical analysis to identify trends and price patterns supporting their fundamental analysis.
Money Manager
🔸A money manager is a person or financial firm that manages the securities portfolio of individual or institutional investors.
🔸 Professional money managers do not receive commissions on transactions; rather, they are paid based on a percentage of assets under management.
🎁Please hit the like button and
🎁Leave a comment to support our team!
RISK DISCLAIMER:
Trading Futures , Forex, CFDs and Stocks involves a risk of loss.
Please consider carefully if such trading is appropriate for you.
Past performance is not indicative of future results.
Always limit your leverage and use tight stop loss.

SWING TUTORIAL - TECHMIn this tutorial, we try to understand how and why the stock NSE:TECHM started going upward and how we can find the best entry while reading charts.
The stock had started forming a Support at 1000 levels at June 2022 and since been retesting the same level again up to April 2023.
During the same time we can observe how the MACD levels consistently kept moving upwards. This indicated that momentum was gaining and it slowly starting to turn bullish.
Once the MACD finally made a successful crossover after close to 52 weeks in April 2023, this is where our Entry got created.
Eventually slowly making its way right up to the Swing High levels.
This trade is still in play and will probably retest its Swing High levels in the coming weeks.
And if the MACD line and signal are still as split away from each other as they are on the monthly timeframe, this could also breakout from the Swing High levels and going all the way further.
What do you think about this Tutorial? Would you like to more such Tutorials in the future? Give your comments in the Comments Section below:

Options Blueprint Series [Advanced]: Reverse Time Iron Condors1. Introduction
In today’s advanced options trading discussion, we introduce a unique structure—"Reverse Time Iron Condors"—using Corn Futures Options (ZCH2025). This sophisticated strategy leverages options with different expiration dates, allowing traders to position themselves for a potential market move in the mid-term.
The Corn market has recently shown signs of slowing momentum, as indicated by technical indicators such as ADX (Average Directional Index) and RSI (Relative Strength Index) applied to ADX. Our analysis shows that RSI applied to ADX is oversold, and RSI is approaching a key crossover signal that could confirm an increase in volatility. Given this setup, the Reverse Diagonal Iron Condor (a.k.a. Reverse Time Iron Condor) structure aligns well with the market’s current conditions over two expiration cycles.
CME Product Specs (Corn Futures ZCH2025)
Contract Size: 5,000 bushels per contract.
Tick Size: 1/4 cent per bushel (0.0025), or $12.50 per tick.
Required Margin: USD $1,200 per contract at the time of producing this article.
2. Market Setup & Analysis
To understand why the Reverse Time Iron Condor is suitable for Corn Futures right now, let’s delve into the technical picture:
ADX Analysis: Corn Futures’ Daily ADX has been dropping, indicating weakening momentum. This signals a period of consolidation, where price volatility remains low.
RSI of ADX: By applying the RSI to the ADX values, we notice that ADX is now oversold, suggesting that momentum could soon pick up.
RSI Crossover: The RSI is nearing a crossover above its moving average, confirming that a new impulse in momentum would be in the process of potentially occur. This technical picture suggests the market could stay in a low-volatility phase for now but break out in the near future.
Based on this technical setup, the strategy we present is to capitalize on the short-term consolidation while preparing for a potential breakout, using the Reverse Diagonal Iron Condor structure.
3. Strategy Breakdown: Reverse Diagonal Iron Condor
The Reverse Diagonal Iron Condor is a unique options structure where you sell longer-term options and buy shorter-term options. This setup generates a negative theta position, meaning time decay works slightly against the trader. However, the strategy compensates for this through positive gamma, which accelerates the delta as the underlying market moves, especially during a breakout. This combination allows the position to profit from a sharp move in either direction, with relatively limited cost.
For this trade on Corn Futures (ZCH2025), the structure is as follows:
Sell 450 Call (21 Feb 2025), Buy 455 Call (27 Dec 2024): This creates a short diagonal call spread, where the February short call decays slowly due to the longer expiration, and the December long call acts as a short-term hedge against an early rise in prices.
Sell 410 Put (21 Feb 2025), Buy 405 Put (27 Dec 2024): Similarly, this forms a short diagonal put spread. The February short put is subject to less time decay, while the December long put protects against a sharp downward move before its expiration.
Key Mechanics:
Time Decay (Theta): Although the trade has negative theta, the impact of time decay is relatively small because the February options decay slowly due to their longer-term expiration.
Gamma and Delta: The positive gamma in this position means that if a breakout occurs before the December expiration, the delta will increase significantly, making the trade more sensitive to price changes. This could more than offset the negative theta, allowing the trade to capture large gains from a significant price move.
Objective:
The goal is for Corn prices to experience an impulsive move (either up or down) before the December 2024 expiration of the long legs, allowing the positive gamma to boost the position’s delta. If this breakout occurs, the potential profits from the price move will likely surpass the small losses due to time decay. The structure is ideal for markets in consolidation that may be on the verge of a volatility surge, as the falling ADX and oversold RSI suggest.
This strategy is particularly well-suited for Corn Futures (ZCH2025), given the current technical setup, where a near-term consolidation phase might be followed by an explosive move in either direction. The success of this trade relies on a timely breakout occurring before the December expiration, after which the position may need adjustment to manage risk.
4. Risk Profile at Initial Setup
The initial risk profile for this trade reminds us of an Iron Condor risk profile, with the best case being a range-bound corn market between 410 and 450.
Important Consideration: This risk profile does not reflect the final outcome because the trade spans two different options cycles. The December options will expire first, which means adjustments may be necessary after that expiration to maintain protection.
Note on Options Simulation Tool:
It's important to mention that the options simulation tool provided by TradingView is currently still in its beta stage. While it offers useful insights for analyzing and visualizing options strategies, traders should be aware that certain features may be limited, and results might not always reflect all real-world conditions. For a more comprehensive analysis, it is recommended to complement the simulation with other tools such as the Options Strategy Simulator available in the CME Group website.
5. Optional Trade Management After December Expiration
Once the December 2024 long options expire, you will face two possible scenarios. In both cases, managing the February 2025 short options is crucial:
o Scenario 1: Corn Prices Remain Range-Bound:
If Corn futures continue to trade within the 450-410 range, the December long options will expire worthless.
In this case, the strategy shifts to managing the February short options, which will benefit from time decay. Monitor the market closely and consider whether to buy new protection for the remaining February short options.
o Scenario 2: Corn Prices Break Out:
If Corn futures break above 450 or below 410 prior to the December expiration, the February short options could expose the position to significant risk if we allow them to expire.
One potential action is to purchase new long options within the range (for example, buy the 445 call and the 415 put using 21 February 2025 expiration). While many other actions could be valid, a common and probably the simplest approach could be to close all legs in time for a likely profit at this moment.
6. Risk Management
Effective risk management is essential in any options strategy, especially one as advanced as a Reverse Diagonal Iron Condor. Below are key points to ensure this trade stays within your risk tolerance:
o Position Sizing:
Given the complexity of this trade, ensure that the size of your position fits within your overall risk management plan. Avoid over-leveraging, as unexpected price movements can lead to significant losses once the December long options expire.
o Monitor Key Levels:
Keep an eye on the 450 strike (resistance) and 410 strike (support). If Corn breaks these levels early in the trade, consider closing the position or making adjustments.
o Volatility Management:
The success of this trade hinges on an increase in market momentum.
7. Conclusion
The Reverse Diagonal Iron Condor is an advanced options strategy where the long positions have a shorter expiration than the short positions, creating a negative theta position. Instead of benefiting from time decay as in a traditional Iron Condor, this strategy is designed to take advantage of expected volatility increases over time. By selling longer-term options and buying shorter-term options, traders are positioning themselves for a volatility breakout or significant price movement before the near-term options expire.
In this setup, time decay has a limited negative impact on the position, but the key advantage lies in the positive gamma. This means that if a breakout occurs, the position’s delta will accelerate, potentially outpacing the slight negative effect of theta. Traders should closely monitor the December expiration, as the success of the trade hinges on the anticipated large move happening before this date. This structure is particularly well-suited for Corn Futures (ZCH2025), given the falling ADX and RSI, which suggest a potential momentum shift. The strategy is designed to benefit from a significant price move with limited cost, assuming the breakout occurs within the timeframe of the December long options.
When charting futures, the data provided could be delayed. Traders working with the ticker symbols discussed in this idea may prefer to use CME Group real-time data plan on TradingView: www.tradingview.com - This consideration is particularly important for shorter-term traders, whereas it may be less critical for those focused on longer-term trading strategies.
General Disclaimer:
The trade ideas presented herein are solely for illustrative purposes forming a part of a case study intended to demonstrate key principles in risk management within the context of the specific market scenarios discussed. These ideas are not to be interpreted as investment recommendations or financial advice. They do not endorse or promote any specific trading strategies, financial products, or services. The information provided is based on data believed to be reliable; however, its accuracy or completeness cannot be guaranteed. Trading in financial markets involves risks, including the potential loss of principal. Each individual should conduct their own research and consult with professional financial advisors before making any investment decisions. The author or publisher of this content bears no responsibility for any actions taken based on the information provided or for any resultant financial or other losses.

THE MUST-SEE CHART YOU DIDN'T KNOW YOU NEEDED!The TVC:VIX VIX (Volatility Index), often referred to as the "Fear Gauge," measures market volatility expectations based on options prices for the SP:SPX S&P 500 index over the next 30 days. It reflects the sentiment of market participants about future volatility, with higher values indicating more anticipated volatility (often associated with market fear or uncertainty) and lower values reflecting calm market conditions.
Investors frequently use the TVC:VIX VIX as a tool for assessing market risk, especially during periods of market turbulence or significant economic events. Since it tends to rise when the stock market declines, it is often seen as a hedge against market downturns. It's important for traders and analysts, particularly in the context of options trading and for assessing overall market sentiment.
The TVC:VIX VIX's relationship with the cryptocurrency market, particularly with BNC:BLX Bitcoin and other major assets, can offer insights into market sentiment across traditional and digital financial spaces. While the TVC:VIX VIX primarily reflects volatility in the U.S. equity market, changes in its level can indirectly impact cryptocurrencies in the following ways:
1. Market Sentiment Correlation:
High VIX: A rising VIX indicates fear or uncertainty in traditional markets. In times of high volatility, investors tend to move away from risky assets, including cryptocurrencies, leading to potential sell-offs in both markets. However, some may consider Bitcoin a hedge during extreme cases of fear, driving demand as a "digital gold" asset.
Low VIX: A lower VIX reflects calm and stability, which may encourage investors to take on more risk. This could benefit high-risk, high-reward assets like cryptocurrencies, potentially driving capital into Bitcoin, Ethereum, and other cryptos.
2. Liquidity and Risk-Off/Risk-On Dynamics:
In a risk-off environment (high VIX), institutional and retail investors often reduce exposure to volatile assets like crypto, leading to a potential liquidity crunch and sell-offs.
Conversely, a risk-on environment (low VIX) may signal that investors are more willing to take risks, increasing liquidity and driving up crypto prices.
3. Crypto's Evolving Correlation with Equities:
Over time, there has been an evolving correlation between the S&P 500 and Bitcoin, particularly during times of high macroeconomic stress (e.g., during the COVID-19 pandemic or interest rate hikes). As VIX tracks equity market sentiment, rising volatility in equities often spills into crypto markets.
In bull markets or periods of equity recovery, crypto markets may also benefit from an inflow of capital, reducing VIX levels and increasing crypto prices simultaneously.
4. Hedging and Diversification:
Some institutional investors use the VIX as part of their hedging strategy when managing portfolios with exposure to equities and cryptocurrencies. For example, a high VIX may prompt them to move into stablecoins or reduce exposure to speculative assets.
In the future, more sophisticated products like a "crypto volatility index" may emerge, mirroring the role of the VIX but for digital assets.
5. Macro Events:
Major macroeconomic events, such as central bank decisions or geopolitical events, can cause both the VIX to rise and have similar effects on crypto volatility. During such periods, correlations between traditional and digital markets may strengthen.
feargreedmeter.com
The VIX (Volatility Index) and the Crypto Fear and Greed Index serve similar purposes by gauging market sentiment, but they do so in different ways and in distinct markets. Below is a comparison between the two:
1. Purpose and Market Focus
VIX (Volatility Index):
Market: Traditional financial markets, specifically the S&P 500.
Purpose: Measures expected volatility in the S&P 500 over the next 30 days based on options prices. It’s often used as an indicator of fear or complacency in the U.S. stock market.
Focus: Short-term volatility expectations, acting as a “fear gauge” for equity market participants.
Crypto Fear and Greed Index:
Market: Cryptocurrency markets, with a strong emphasis on Bitcoin.
Purpose: Measures the emotional sentiment of the crypto market by analysing multiple factors to determine whether the market is driven by fear or greed.
Focus: Broader emotional sentiment rather than technical market volatility. It tracks how much fear or optimism is present among crypto traders.
2. Inputs and Calculation
VIX:
Derived from the implied volatility of options on the S&P 500. It looks at a range of call and put options to estimate expected price swings in the market.
Key Factors: Options market data, specifically the prices investors are willing to pay to hedge against future volatility in the stock market.
Crypto Fear and Greed Index:
Combines various inputs to capture overall market sentiment. These include:
Volatility: Tracks Bitcoin volatility and compares it with historical trends. Increased volatility is associated with fear.
Market Momentum/Volume: Rising buying volumes signal greed while declining volumes suggest fear.
Social Media Sentiment: Analyses mentions, hashtags, and engagement on social media related to crypto topics, reflecting hype or panic.
Surveys : Sometimes include survey data from market participants.
Dominance: Focuses on Bitcoin’s dominance in the market. Rising dominance suggests fear (as investors flock to Bitcoin for safety) while decreasing dominance implies a risk-on environment.
Google Trends: Looks at search query trends for cryptocurrency terms, reflecting public interest and sentiment.
3. Interpretation
VIX:
Higher VIX (>20): Indicates high expected volatility, often interpreted as fear in the market. Investors are anticipating larger price swings, usually in a negative direction.
Lower VIX (<20): Suggests a calm market with lower expected volatility, often indicating complacency or a bullish outlook in the equity markets.
Crypto Fear and Greed Index:
0-24 (Extreme Fear): Indicates significant fear in the crypto market. Traders may be overly concerned about price drops, which could lead to buying opportunities based on contrarian strategies.
25-49 (Fear): The market is still cautious, with more sellers than buyers.
50-74 (Greed): Optimism and confidence are high, with traders taking on more risk.
75-100 (Extreme Greed): Overconfidence or euphoria in the market. This is often seen as a warning that the market may be overbought, making a correction likely.
4. Time Horizon
VIX:
It focuses on expected short-term volatility (the next 30 days), meaning it's more of a short-term indicator of market swings.
Crypto Fear and Greed Index:
A broader measure of overall sentiment, not specifically tied to volatility or timeframes, it captures emotional extremes in the market that could persist for days, weeks, or longer.
5. Use Cases for Investors
VIX:
Used by traditional investors to gauge risk in the stock market. When the VIX is high, it can be a signal to hedge positions, reduce exposure to equities, or take advantage of volatility-driven strategies like options trading.
During periods of low volatility, investors may become complacent and could be blindsided by sudden spikes in the VIX, often driven by external events (e.g., geopolitical issues or economic reports).
Crypto Fear and Greed Index:
Helps crypto traders assess the general market mood. Extreme fear can signal potential buying opportunities (contrarian strategy), while extreme greed may indicate an overheated market, possibly a time to sell or de-risk.
Useful for emotional market analysis in a space that is known for strong, irrational sentiment swings, making it a helpful tool for timing market entries and exits.
6. Impact on Price
VIX:
Typically inversely correlated with stock prices. A rising VIX often accompanies a falling stock market, and vice versa.
Crypto Fear and Greed Index:
A sentiment indicator is not directly tied to price movements, but extreme readings can signal turning points or potential corrections in crypto prices due to market overreactions.
If you have any questions, please reach out!

Dow Made a Parabolic Move: Did You See the Signs?
The Dow made an unsustainable Parabolic Arc that is a giant U-shaped pattern on Friday, September 27. Did you see the signs? I missed some of them, which lead to a much closer look at what price action moves lead up to a highly volatile ascent and steep drop that's also known as a "Pump and Dump".
The Parabolic move followed typical behaviors that can be seen through price action without needing any indicators. It happened in phases over 3-days, from September 25 - 27:
1. Day 1: A Peak High formed.
2. Day 1 - 2: Valley Low followed.
3. Day 2 - 3: Consolidation between the Peak High and Valley Low. Price action made stair-step moves that created a S&R Zone. Traders also refer to these moves as making multiple bases. An average number of bases is 3 - 4 during a parabolic move. The long consolidation can confuse many traders, including myself, because of no breakout from the Zone happened, especially to the downside. There was strong anticipation for a drop.
4. Day 3: A Triple Inside Day showed up to represent the tight "coiling" action from the consolidation to eventually spring out in an EXPLOSIVE move. The Triple Inside Day pattern that was part of the consolidation was a big giveaway of what's to come.
5. Day 3: A pullback from the consolidation, but was more like a fakeout to trap traders with the Trendbar Reversal, that often leads to no follow through by the bears to really drop. The second, opposing bar within the pattern is a setup for a reversal to the upside. Many traders get fooled by this pattern and drop out at this point, right before the long rally starts.
6. Day 3: Ascending Channel (also called a "Parabolic Channel") formed that is typical after a pullback to the downside before the greater ascent.
7. Day 3: Steep Vertical Ascent with a bullish bar that is 240 tics tall - an Exhaustion Phase.
8. Day 3: Reversal to the downside (that is comparable to or exceeds in length to the steep ascent) from the formation of an Evening Star. The Parabolic move ended with a steep, vertical descent.
______________________________________________
*Citation of Resources:
- Jet Toyco
- FX Open
- Pips 2 Profit
- Top 1 Markets

CHOCH vs BOS !!WHAT IS BOS ?
BOS - break of strucuture. I will use market structure bullish or bearish to understand if the institutions are buying or selling a financial asset.
To spot a bullish / bearish market structure we should see a higher highs and higher lows and viceversa, to spot the continuation of the bullish market structure we should see bullish price action above the last old high in the structure this is the BOS.
BOS for me is a confirmation that price will go higher after the retracement and we are still in a bullish move
WHAT IS CHOCH?
CHOCH - change of character. Also known as reversal, when the price fails to make a new higher high or lower low, then the price broke the structure and continue in other direction.

Prop Trading - All you need to know !!A proprietary trading firm, often abbreviated as "prop firm," is a financial institution that trades stocks, currencies, options, or other financial instruments with its own capital rather than on behalf of clients.
Proprietary trading firms offer several advantages for traders who join their ranks:
1. Access to Capital: One of the most significant advantages of working with a prop firm is access to substantial capital. Prop firms typically provide traders with significant buying power, allowing them to take larger positions in the market than they could with their own funds. This access to capital enables traders to potentially earn higher profits and diversify their trading strategies.
2. Professional Support and Guidance: Many prop firms offer traders access to experienced mentors, coaches, and support staff who can provide guidance, feedback, and assistance. This professional support can be invaluable for traders looking to improve their skills, refine their trading strategies, and navigate volatile market conditions.
3. Risk Management Tools: Prop firms typically have sophisticated risk management systems and tools in place to help traders monitor and manage their exposure to market risks. These systems may include real-time risk analytics, position monitoring, and risk controls that help traders mitigate potential losses and preserve capital.
4. Profit Sharing: Some prop firms operate on a profit-sharing model, where traders receive a share of the profits generated from their trading activities. This arrangement aligns the interests of traders with those of the firm, incentivizing traders to perform well and contribute to the overall success of the firm.
Overall, prop firms provide traders with access to capital, technology, support, and learning resources that can help them succeed in the competitive world of trading. By leveraging these advantages, traders can enhance their trading performance, grow their portfolios, and achieve their financial goals.

What is Confluence ?✅ Confluence refers to any circumstance where you see multiple trade signals lining up on your charts and telling you to take a trade. Usually these are technical indicators, though sometimes they may be price patterns. It all depends on what you use to plan your trades. A lot of traders fill their charts with dozens of indicators for this reason. They want to find confluence — but oftentimes the result is conflicting signals. This can cause a lapse of confidence and a great deal of confusion. Some traders add more and more signals the less confident they get, and continue to make the problem worse for themselves.
✅ Confluence is very important to increase the chances of winning trades, a trader needs to have at least two factors of confluence to open a trade. When the confluence exists, the trader becomes more confident on his negotiations.
✅ The Factors Of Confluence Are:
Higher Time Frame Analysis;
Trade during London Open;
Trade during New York Open;
Refine Higher Time Frame key levels in Lower
Time Frame entries;
Combine setups;
Trade during High Impact News Events.
✅ Refine HTF key levels in LTF entries or setups for confirmation that the HTF analysis will hold the price.
HTF Key Levels Are:
HTF Order Blocks;
HTF Liquidity Pools;
HTF Market Structure.

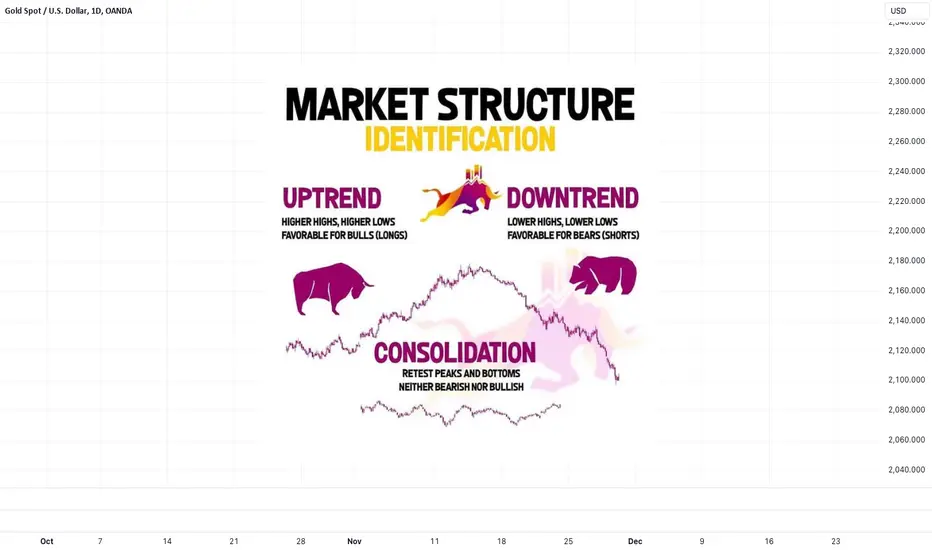
Market Structure Identification !!Hello traders!
I want to share with you some educational content.
✅ MARKET STRUCTURE .
Today we will talk about market structure in the financial markets, market structure is basically the understading where the institutional traders/investors are positioned are they short or long on certain financial asset, it is very important to be positioned your trading opportunities with the trend as the saying says trend is your friend follow the trend when you are taking trades that are alligned with the strucutre you have a better probability of them closing in profit.
✅ Types of Market Structure
Bearish Market Structure - institutions are positioned LONG, look only to enter long/buy trades, we are spotingt the bullish market strucutre if price is making higher highs (hh) and higher lows (hl)
Bullish Market Structure - institutions are positioned SHORT, look only to enter short/sell trades, we are spoting the bearish market strucutre when price is making lower highs (lh) and lower lows (ll)
Range Market Structure - the volumes on short/long trades are equall instiutions dont have a clear direction we are spoting this strucutre if we see price making equal highs and equal lows and is accumulating .
I hope I was clear enough so you can understand this very important trading concept, remember its not in the number its in the quality of the trades and to have a better quality try to allign every trading idea with the actual structure
Trading is a waiting game🔸Trading is a waiting game. Stop forcing trades. Learn waiting for your setups. A trader who can't wait is not a successful trader.
🔸Waiting is the hardest part of trading. And also the least talked about. If you can improve your waiting you will improve your trading.
🔸Trading is a waiting game. You sit, you wait, and you make a lot of money all at once. Profits come in bunches. The trick when going sideways between home runs is not to lose too much in between.
🔸Overtrading is the number one reason why traders blow their entire accounts because it exposes them to unnecessary risks and costs that vanish their capital. Some studies show that overtrading accounts for more than 75% of trading losses among retail traders.
🎁Please hit the like button and
🎁Leave a comment to support our team!
RISK DISCLAIMER:
Trading Futures , Forex, CFDs and Stocks involves a risk of loss.
Please consider carefully if such trading is appropriate for you.
Past performance is not indicative of future results.

My personal interpretation of the Volume Footprint chart
Hello, traders.
If you "Follow", you can always get new information quickly.
Please click "Boost" as well.
Have a nice day today.
-------------------------------------
I signed up for an expensive plan on TradingView, but I think there are some parts of the chart that I can't use properly.
I think the Volume Footprint chart is a chart that can be used when you sign up for a premium plan. (I may be wrong, so please check.)
I think it's because I'm used to the old way, so I feel resistant to new things, and the explanation is difficult to read.
In order to solve that problem a little, I'd like to explain how to interpret the chart using only the core interpretation methods.
Since my explanation may be different from the creator's intention, I strongly recommend that you read the creator's explanation.
Volume Footprint Chart Description:
www.tradingview.com
----------------------------------------
I think you should pay attention to and interpret the part indicated above.
I think the section marked as VAL, VAH is the section that is mainly traded.
Therefore, I think that depending on which direction it deviates from this section, it will affect the future flow.
Therefore,
- If it rises near or above VAH, it is likely to show an upward trend,
- If it falls near or below VAL, it is likely to show a downward trend.
-
The next thing to look at is the column indicated next to each volume. (The part that the arrow points to)
- The column in the Sell Volume section indicates that it is a section with strong selling pressure,
- The column in the Buy Volume section indicates that it is a section with strong buying pressure.
(The creator explains that this is the part that is indicated by the imbalance of volume.)
Anyway, since there is a high possibility of a rebound or reversal in the part where this column is indicated, I think it can be a tradable section depending on whether it receives support or resistance in this part.
-
The Delta section shows the difference between Sell Volume and Buy Volume.
-----------------------------------------------------------
The time frame charts that are good for viewing the volume footprint chart are 1s, 1m, 15m, 1h, and 1D charts, so I recommend viewing them with the corresponding time frame charts.
If it deviates from the VAL, VAH area near 1, 1-1 and 2, 2-1 shown on the chart, a trend is formed, so you should check whether it deviates from this section.
If it does not deviate, it can be interpreted that there is a high possibility of sideways movement.
-
Therefore,
1. Is it located near VAL, VAH?
2. Is there a section where columns are created next to Sell Volume, Buy Volume?
I think this chart allows you to detect the trading volume, that is, the movement of buyers and sellers, with the above two things.
-
Have a good time.
Thank you.
--------------------------------------------------

Trading Psychological Levels 101What are psychological levels?
🔸Psychological levels are price points in financial markets that hold significant meaning for traders and investors, mainly due to their simplicity and ease.
🔸Typically, these levels are round numbers, ending in 00 or halfway points like 50.
🔸With currency pairs, the exchange rate of 1.0” or parity is also a major psychological level.
🔸Traders tend to anchor their decisions around these levels, leading to increased buying and selling pressure when prices approach or surpass them.
How to Trade Psychological Levels
🔸Identify Key levels: The first step in incorporating psychological levels into your trading is to identify the key levels relevant to the financial instrument (e.g. currency pair) you are trading. This can be done by observing historical price action and noting round numbers where the price has previously shown significant reactions.
🔸Monitor Price Action: Keep a close eye on how the price behaves as it approaches a psychological level. Look for signs of increased price volatility, as this can indicate heightened interest from market participants.
🔸Set Entry and Exit Points: Once you have identified a psychological level and observed price action around it, use this information to set entry and exit points for your trades. For example, if the price has bounced off a psychological support level, you might enter a long position just above the level and set a stop loss slightly below it.
🎁Please hit the like button and
🎁Leave a comment to support our team!
RISK DISCLAIMER:
Trading Futures , Forex, CFDs and Stocks involves a risk of loss.
Please consider carefully if such trading is appropriate for you.
Past performance is not indicative of future results.

A Detailed Guide for New Traders!Technical Analysis: A Detailed Guide for New Traders
Technical analysis (TA) is a trading method used to evaluate and predict the future price movements of assets like stocks, cryptocurrencies, commodities, or forex, by analyzing past market data, primarily price and volume. It differs from fundamental analysis, which looks at financial metrics like earnings, revenue, and overall economic conditions. For beginners, here’s a breakdown of technical analysis and its essential tools and concepts:
1. Price Charts: The Foundation of TA
Price charts are visual representations of an asset’s price over a specific period. There are different types of charts, but the most common are:
Line Charts: Show the closing prices over time.
Bar Charts: Display the open, high, low, and close prices (OHLC) for each period.
Candlestick Charts: Similar to bar charts but more visually intuitive, displaying the same OHLC data with colored “candles” for up or down movements.
Candlestick charts are the most popular among traders because they provide more information and are easier to interpret visually.
2. Key Concepts in Technical Analysis
a. Trends
A trend is the general direction in which the price of an asset is moving. Understanding trends is crucial in technical analysis because traders aim to follow the market’s momentum. There are three types of trends:
Uptrend: Prices are generally increasing, making higher highs and higher lows.
Downtrend: Prices are decreasing, making lower highs and lower lows.
Sideways Trend (Range): Prices move within a specific range without a clear upward or downward direction.
b. Support and Resistance
Support: A price level where an asset tends to stop falling due to increased buying demand.
Resistance: A price level where an asset tends to stop rising due to increased selling pressure.
These levels are essential for identifying potential entry and exit points for trades.
c. Moving Averages
Moving averages (MAs) are a simple way to smooth out price data over a specified time period to identify trends more easily. There are two main types:
Simple Moving Average (SMA): The average price over a set number of periods (e.g., 50-day or 200-day SMA).
Exponential Moving Average (EMA): Gives more weight to recent prices, making it more responsive to new information.
Traders use MAs to determine the overall trend, and crossovers (e.g., when a short-term MA crosses a long-term MA) are often seen as buy or sell signals.
3. Indicators and Oscillators
Indicators and oscillators are tools derived from price and volume data to help identify potential trends, reversals, and overbought or oversold conditions.
a. Relative Strength Index (RSI)
The RSI measures the magnitude of recent price changes to evaluate whether an asset is overbought or oversold. It ranges from 0 to 100:
Above 70: Overbought (price might be too high, possible reversal).
Below 30: Oversold (price might be too low, possible reversal).
b. Moving Average Convergence Divergence (MACD)
The MACD is a trend-following momentum indicator that shows the relationship between two moving averages of an asset’s price. It helps traders identify changes in the strength, direction, and momentum of a trend.
MACD Line: The difference between the 12-day and 26-day EMA.
Signal Line: A 9-day EMA of the MACD Line.
Histogram: Shows the difference between the MACD Line and the Signal Line.
A crossover between the MACD Line and the Signal Line can signal buying or selling opportunities.
c. Bollinger Bands
Bollinger Bands consist of a moving average (middle band) and two outer bands that are two standard deviations away from the middle. The bands expand and contract based on market volatility. When the price moves toward the upper band, the asset might be overbought, and when it moves toward the lower band, it might be oversold.
4. Chart Patterns
Chart patterns are formations created by the price movement of an asset, and traders use them to predict future price movements. Some common patterns include:
Head and Shoulders: A reversal pattern that signals a change from bullish to bearish or vice versa.
Triangles (Ascending, Descending, Symmetrical): Continuation patterns that suggest the price will break out in the direction of the current trend.
Double Top and Double Bottom: Reversal patterns indicating that the price may reverse its current trend after testing a support or resistance level twice.
5. Volume Analysis
Volume refers to the number of shares, contracts, or lots traded during a particular period. It can confirm trends or warn of potential reversals:
Rising volume during an uptrend confirms the strength of the trend.
Decreasing volume in a rising trend can indicate a weakening trend and potential reversal.
Volume spikes often occur at trend reversals.
6. Risk Management
No trading strategy is foolproof, and technical analysis is not a crystal ball. To succeed, you must manage your risk:
Stop-Loss Orders: Automatically sell a position if the price moves against you by a certain amount, limiting your losses.
Risk-Reward Ratio: Determine the amount you're willing to risk for a potential reward. A typical ratio is 1:2, meaning for every $1 risked, you aim to make $2 in profit.
Position Sizing: Only risk a small percentage of your total capital (e.g., 1-2%) on a single trade to prevent significant losses.
7. Combining TA with Fundamental Analysis
While technical analysis is valuable, many traders combine it with fundamental analysis to get a complete picture. For instance, in the stock market, technical analysis might show that a stock is oversold, but if the company’s fundamentals (earnings, revenue) are strong, it could be a buying opportunity.
8. Conclusion
Technical analysis is a powerful tool for traders to predict price movements and make informed trading decisions. However, it requires practice and patience. Start with the basics, use demo accounts to test your skills, and never forget to manage your risk.
For beginners, mastering the key concepts like trends, support and resistance, moving averages, and common indicators like RSI and MACD will set you on the path to becoming a successful trader.
Like and follow if you found this helpful!
#Crypto #Bitcoin #bullrun

The 20 Trading Lessons from Top Traders I have read a lot of trading books since the time I started trading my own account and the one book that really helps me out and “I wish I’ve read this one first” – is Market Wizards Interview with Top Traders by Jack D. Schwager.
Here’s the list that struck me most that I’d like to share:
“Early trading failure is a sign that you are doing something wrong; it is not necessarily a good predictor of ultimate potential failure or success.” – Michael Marcus
“If you don’t stay with your winners, you are not going to be able to pay for the losers.” – Michael Marcus
“Liquidating positions is the way to achieve mental clarity when one is losing money and confused regarding market decisions.” – Michael Marcus
“Being a successful trader also takes courage: the courage to try, the courage to fail, the courage to succeed, and the courage to keep going when the going keeps tough.” – Michael Marcus
“Place your stops at a point that, if reached, will reasonably indicate that the trade is wrong, not at a point determined primarily by the maximum dollar amount you are willing to lose per contract. If the meaningful stop point implies an uncomfortably large loss per contract, trade a smaller number of contracts.” – Bruce Kovner
“The times when you least want to think about trading – the losing periods – are precisely the times when you need to focus most on trading.” – Richard Dennis
“Everybody gets what they want out of the market.” – Ed Seykota
“It is a happy circumstance that when nature gives us true burning desires, it also gives us the means to satisfy them.” – Ed Seykota
“Frankly, I don’t see markets; I see risks, rewards and money.” – Larry HIte
“ I have two basic rules about winning in trading as well as in life: 1. If you don’t bet, you can’t win. 2. If you lose all your chips, you can’t bet” – Larry Hite
“In my judgment, all traders are seekers of truth.” – Michael Steinhardt
“The more disciplined you can get, the better you are going to do in the market. The more you listen to tips and rumors, the more money you’re likely to lose.” – David Ryan
“When the market gets good news and goes down, it means the market is very weak; when it gets bad news and goes up, it means the market is healthy.” – Marty Schwartz
“Learn to take losses. The most important thing in making money is not letting your losses get out of hand. Also, don’t increase your position size until you have doubled or tripled your capital. Most people make the mistake of increasing their bets as soon as they start making money. That is a quick way to get wiped out.” – Marty Schwartz
“The best traders are the most humble.” – Mark Weinstein
“You have to learn how to lose; it is more important than learning how to win.” – Mark Weinstein
“Most traders who fail have large egos and can’t admit that they are wrong. Even those who are willing to admit that they are wrong early in their career can’t admit it later on. Also, some traders fail because they are too worried about losing.” – Brian Gelber
“You are never really confident in this business, because you can always be wiped out pretty quickly. The way I trade is: Live by the sword, die by the sword. There is always the potential that I could get caught with the big position in a fluke move with the market going the limit against me. On the other hand, there is no doubt in my mind that I could walk into any market in the world and make money.” – Tom Baldwin
“Clear thinking, ability to stay focused, and extreme discipline. Discipline is number one: Take a theory and stick with it. But you have to be open-minded enough to switch tracks if you feel that your theory has been proven wrong. You have to be able to say, my method worked for this type of market, but we are not in that type of market anymore.” – Tony Saliba
“ How do you judge success? I don’t know. All I know is that all the money in the world isn’t the answer.” Tony Saliba
There’s still a lot of golden information that I want to write in here – for ourselves and for everyday reading so as to keep us aligned with our trading goal, but I prefer to encourage you to read the book.
