Which altcoins hold the potential to conquer the crypto market?Have you ever heard of ISO 20022?
Do you know what this standard is all about?
Which tokens have adopted or are compliant with this standard?
ISO 20022 is an international standard for the exchange of financial data between financial institutions, banks, corporations, and other entities. Developed by the International Organization for Standardization (ISO), its purpose is to provide a universal language for financial messaging on a global scale.
Hello✌
Spend 3 minutes ⏰ reading this educational material. The main points are summarized in 3 clear lines at the end 📋 This will help you level up your understanding of the market 📊 and Bitcoin💰.
🎯 Analytical Insight on Bitcoin: A Personal Perspective:
Bitcoin is currently near a strong trendline and a solid daily support level. I’m expecting it to break the $90,000 mark, a key psychological level, within the next few days. My main target is at least a 7% increase, reaching $90,500.
📈
Now , let's dive into the educational section, which builds upon last week's lesson (linked in the tags of this analysis). Many of you have been eagerly waiting for this, as I have received multiple messages about it on Telegram.
🔍 What Is ISO 20022 and Why Should Traders Care?
Have you come across ISO 20022 and wondered what it really means in the world of finance and crypto? It’s not just a technical standard—it could be a major bridge between traditional finance and blockchain-based assets.
🌐 A Global Standard for Financial Messaging
ISO 20022 is an international protocol developed by the International Organization for Standardization. It defines a universal language for exchanging financial data between institutions—banks, governments, payment networks, and corporations.
💡 Key Features of ISO 20022
• Uses XML-based message formatting—both machine and human-readable
• Covers multiple financial areas: payments, securities, trade, treasury, and cards
• Highly flexible and extendable to future innovations
• Designed to reduce processing errors and boost interoperability worldwide
📈 Why It’s Becoming a Big Deal
With increasing digitization, the global financial system is shifting toward unified communication standards. Major infrastructures like SWIFT are already migrating to ISO 20022 to future-proof their operations.
🪙 The Crypto Connection
Some cryptocurrencies have been developed to align with ISO 20022 standards. This means they have the potential to integrate directly into regulated financial systems—making them more likely to be adopted by banks and governments.
✅ ISO 20022-Compliant Cryptocurrencies (As of 2024)
• XRP (Ripple)
• XLM (Stellar)
• XDC (XinFin)
• IOTA
• ALGO (Algorand)
• QNT (Quant)
• HBAR (Hedera Hashgraph)
🤝 Why Compliance Matters
If traditional finance fully adopts ISO 20022, only tokens that meet its criteria will likely be considered for official integration. This could have huge implications for utility, regulation, and long-term value.
🧠 Strategic Insight for Investors
Incorporating ISO 20022-compliant assets into your portfolio isn’t just about trends—it’s about positioning yourself for future financial system evolution. These tokens may play a key role in bridging the gap between DeFi and TradFi.
However , this analysis should be seen as a personal viewpoint, not as financial advice ⚠️. The crypto market carries high risks 📉, so always conduct your own research before making investment decisions. That being said, please take note of the disclaimer section at the bottom of each post for further details 📜✅.
🧨 Our team's main opinion is: 🧨
ISO 20022 is a global financial messaging standard designed to streamline data exchange between banks and institutions. It's becoming crucial as traditional systems like SWIFT adopt it for greater efficiency. Several cryptocurrencies, including XRP, XLM, and ALGO, are ISO 20022-compliant, positioning them for future integration with mainstream financial systems. This compliance could lead to wider adoption by banks and governments, making them more valuable long-term. 🚀
Give me some energy !!
✨We invest countless hours researching opportunities and crafting valuable ideas. Your support means the world to us! If you have any questions, feel free to drop them in the comment box.
Cheers, Mad Whale. 🐋
Chart Patterns

Trend Exhaustion SignalsTrend Exhaustion Signals: How to Know When a Trend is Losing Steam
Every trend eventually runs out of fuel. Knowing when momentum is fading can give you the edge to exit early, avoid late entries, or even prepare for a reversal. This article dives into key signs of trend exhaustion and how to trade around them.
🔵Understanding Trend Exhaustion
Trends can persist far longer than expected, but they don’t last forever. Trend exhaustion occurs when the driving force behind a trend—be it buying or selling pressure—starts to weaken. Recognizing this shift is crucial for:
Protecting profits
Avoiding bad entries
Spotting early reversal opportunities
🔵1. RSI and MACD Divergence
A classic signal of trend exhaustion is divergence between price and momentum indicators like RSI (Relative Strength Index) and MACD (Moving Average Convergence Divergence).
Bearish Divergence: Price makes a higher high, but the indicator makes a lower high.
Bullish Divergence: Price makes a lower low, but the indicator makes a higher low.
This suggests that although price continues in the trend's direction, momentum is lagging—a red flag for potential exhaustion.
🔵2. Volume Dry-Up
Volume is the fuel of trends. When volume starts to shrink during a strong move, it often signals that the crowd is losing interest or that institutions are offloading positions.
In an uptrend, a series of green candles with decreasing volume = caution.
In a downtrend, falling volume can signal seller fatigue.
🔵3. Long-Wick Candles at Extremes
Candlestick patterns offer visual clues of exhaustion. When you start seeing long upper wicks at the top of an uptrend (or long lower wicks at the bottom of a downtrend), it means price is being rejected from continuing further.
Common exhaustion patterns:
Shooting Star (bearish)
Inverted Hammer (bullish)
Doji at highs/lows
These patterns are more reliable when they form near resistance or support zones.
🔵4. Structure Break: CHoCH and BOS
Market structure tells a deeper story than indicators. Two key terms here:
CHoCH (Change of Character): The first sign of reversal—a higher low broken in an uptrend, or a lower high broken in a downtrend.
BOS (Break of Structure): The confirmation—a key swing point is broken, confirming a new trend.
Traders can watch for these breaks to anticipate when the current trend is ending and a reversal is forming.
🔵5. Parabolic Price Action & Overextension
When a trend becomes parabolic—with steep, accelerating price movement—it often signals the final stage of the trend. This is when retail traders usually enter, and smart money begins to exit.
Warning signs:
Sudden vertical moves
Price far above/below moving averages
Lack of consolidation or pullbacks
Parabolic moves are unsustainable. Look for reversion to the mean or a sharp correction.
🔵How to Trade Around Trend Exhaustion
Tighten Stops: If in a winning trend trade, consider locking in profits or trailing your stop.
Avoid Chasing Entries: Late entries into exhausted trends are high-risk, low-reward.
Prepare for Reversal Setups: Watch for confirmation (CHoCH, divergence, candle patterns) before entering counter-trend positions.
Use Multi-Timeframe Analysis: Exhaustion on the 1H chart may just be a pullback on the 4H. Always zoom out for context.
Trend exhaustion is a natural part of market behavior. Recognizing the signs—such as divergence, fading volume, long wicks, structure breaks, and parabolic moves—can help you time exits better and avoid late trades. Instead of reacting after the fact, you’ll be prepared in advance. Add these tools to your trading routine and stay one step ahead of the crowd.

Mastering Candlestick Patterns - How to use them in trading!Introduction
Candlesticks are one of the most popular and widely used tools in technical analysis. They offer a visual representation of price movements within a specific time period, providing valuable insights into market trends, sentiment, and potential future price movements.
Understanding candlestick patterns is crucial for traders, as these formations can indicate whether a market is bullish or bearish, and can even signal potential reversals or continuations in price. While candlesticks can be powerful on their own, trading purely based on candlestick patterns can be challenging and risky.
-----------------------------------------------------------------------------------------------
What are we going to discuss:
1. What are candlesticks?
2. What are bullish candlestick patterns?
3. What are bearish candlestick patterns?
4. How to use candlestick patterns in trading?
-----------------------------------------------------------------------------------------------
1. What are candlesticks?
A candlestick in trading is a visual representation of price movement in a specific time period on a chart. It is a fundamental element used in technical analysis to study market trends, determine price levels, and predict potential future price movements. A single candlestick consists of four main components: the open, close, high, and low prices for that time period.
Here’s how a candlestick works:
- The Body: The rectangular area between the open and close prices. If the close is higher than the open, the body is green, indicating a bullish (upward) movement. If the close is lower than the open, the body is red, signaling a bearish (downward) movement.
- The Wick (high and low of the candle): The thin lines extending above and below the body. These represent the highest and lowest prices reached during the period. The upper wick shows the highest price, while the lower wick shows the lowest price.
- The Open Price: The price at which the asset began trading in that time period (for example, the start of a day, hour, or minute depending on the chart timeframe).
- The Close Price: The price at which the asset finished trading at the end of the period.
-----------------------------------------------------------------------------------------------
2. What are bullish candlestick patterns?
What is a Hammer Candlestick Pattern?
A hammer candlestick pattern has a small body near the top of the candle and a long lower wick, typically two to three times the length of the body. There is little to no upper wick. This formation shows that during the trading session, sellers managed to push the price significantly lower, continuing the downward momentum. However, buyers eventually stepped in with strong demand and drove the price back up near the opening level by the close.
What is an Inverted Hammer?
An inverted hammer has a small body near the bottom of the candle with a long upper wick, usually at least two to three times the size of the body, and little to no lower wick. This unique shape resembles an upside-down hammer, hence the name.
What is a Dragonfly Doji?
A dragonfly doji has a unique shape where the open, close, and high prices are all at or very close to the same level, forming a flat top with a long lower wick and little to no upper wick. This gives the candle the appearance of a "T," resembling a dragonfly.
What is a Bullish Engulfing?
A bullish engulfing candlestick consists of two candles. The first candle is bearish, indicating that sellers are still in control. The second candle is a large bullish candle that completely engulfs the body of the first one, meaning it opens below the previous close and closes above the previous open. This pattern reflects a clear shift in market sentiment. During the second candle, buyers step in with significant strength, overpowering the previous selling pressure and reversing the momentum. The fact that the bullish candle completely engulfs the previous bearish candle indicates that demand has taken over, signaling a potential trend reversal.
What is a Morning Star?
The morning star consists of three candles. The first is a long bearish candle, indicating that the downtrend is in full force, with strong selling pressure. The second candle is a small-bodied candle, which can be either bullish or bearish, representing indecision or a pause in the downtrend. Often, the second candle gaps down from the first, indicating that the selling pressure is subsiding but not yet fully reversed. The third candle is a long bullish candle that closes well above the midpoint of the first candle, confirming that buyers have taken control and signaling the potential start of an uptrend.
-----------------------------------------------------------------------------------------------
3. What are bearish candlestick patterns?
What is a Shooting Star?
A shooting star has a smal body near the low of the candle and a long upper wick, usually at least twice the size of the body, with little to no lower wick. This shape shows that buyers initially pushed the price higher during the session, continuing the upward momentum. However, by the close, sellers stepped in and drove the price back down near the opening level.
What is a Hanging Man?
A hanging man has a distinct shape, with a small body positioned near the top of the candle and a long lower wick, usually at least twice the length of the body. There is little to no upper wick. The appearance of this candle suggests that although there was strong selling pressure during the session, buyers managed to bring the price back up near the opening level by the close. Despite the recovery, the long lower wick shows that sellers were able to push the price down significantly at one point. This introduces uncertainty into the uptrend and can indicate that bullish momentum is weakening.
What is a Gravestone Doji?
A gravestone doji has a distinctive shape where the open, low, and close prices are all at or near the same level, forming a flat base. The upper wick is long and stretches upward. This shape resembles a gravestone, which is where the pattern gets its name.
What is a Bearish Engulfing?
A bearish engulfing candlestick pattern is a two-candle reversal pattern that typically appears at the end of an uptrend and signals a potential shift from bullish to bearish sentiment. The first candle is a smaller bullish candle, reflecting continued upward momentum. The second candle is a larger bearish candle that completely engulfs the body of the first one, meaning it opens higher than the previous close and closes lower than the previous open. This indicates that bears have taken control, overpowering the buyers, and suggests a potential downside movement.
What is an Evening Star?
An evening star is a bearish candlestick pattern that typically signals a potential reversal at the top of an uptrend. It consists of three candles and reflects a shift in momentum from buyers to sellers. The pattern starts with a strong bullish candle, showing continued buying pressure and confidence in the upward move. This is followed by a smaller-bodied candle, which can be bullish or bearish, and represents indecision or a slowdown in the uptrend. The middle candle often gaps up from the first candle, showing that buyers are still trying to push higher, but the momentum is starting to weaken. The third candle is a strong bearish candle that closes well into the body of the first bullish candle. This candle confirms that sellers have taken control and that a trend reversal could be underway. The more this third candle erases the gains of the first, the stronger the reversal signal becomes.
-----------------------------------------------------------------------------------------------
4. How to use candlestick patterns in trading?
Candlestick patterns are most useful when they appear at key levels, such as support, resistance, or significant trendlines. For instance, if a bullish reversal pattern like a hammer or bullish engulfing forms at a support level, it may indicate that the downtrend is losing momentum, and a reversal could be coming.
Trading based on candlestick patterns alone can be risky. To improve your chances of success, always seek additional confirmation from other technical analysis tools. Here are some common ones:
- Support and Resistance Levels: Look for candlestick patterns that form near key support or resistance levels. For instance, if the price reaches a support zone and a bullish reversal candlestick pattern forms, this may suggest a potential upward reversal.
- Fibonacci Retracement: Use Fibonacci levels to identify potential reversal zones. If a candlestick pattern appears near a key Fibonacci level (such as the Golden Pocket), it adds confirmation to the idea that the price may reverse.
- Liquidity Zones: These are areas where there is a high concentration of buy or sell orders. Candlestick patterns forming in high liquidity zones can indicate a stronger potential for a reversal or continuation.
- Indicators and Oscillators: Incorporating indicators like the Relative Strength Index (RSI), Moving Averages, MACD, or Stochastic RSI can help confirm the momentum of the price. For example, if a candlestick pattern forms and the RSI shows an oversold condition (below 30), this could indicate a potential reversal to the upside.
It’s crucial to wait for confirmation before entering a trade. After a candlestick pattern forms, it’s important to wait for the next candle or price action to confirm the signal. For example, if you spot a bullish reversal candlestick like a hammer at support, wait for the next candle to close above the hammer’s high to confirm that buyers are in control and a reversal is likely.
-----------------------------------------------------------------------------------------------
Thanks for your support.
- Make sure to follow me so you don't miss out on the next analysis!
- Drop a like and leave a comment!

How to Analyze a Technical Chart: Practical Guide (BTC EXAMPLE)Hello, traders! ✍🏻
Understanding a chart isn't about predicting the future — it’s about recognizing what’s already happening. Whether you're evaluating a Bitcoin breakout or watching a new altcoin pump, technical chart analysis is one of the most powerful tools traders use to make sense of price movements. But how exactly do you read a technical analysis chart? What matters most — and what’s just noise?
Let’s break it down.
1. Look at the Big Picture: Price Trends and Structure
Before zooming in, zoom out. Start with the daily or weekly chart to identify the primary trend. Is the asset making higher highs and higher lows (an uptrend)? Or is it stuck in a sideways channel?
In Price Analysis, Market Structure Is Your Anchor:
Uptrend: Higher Highs and Higher Lows
Downtrend: Lower Highs and Lower Lows
Consolidation: Sideways Moves with Clear Support/Resistance
This high-level view helps you avoid common traps, like going long in a downtrend or shorting near long-term support.
2. Use Support and Resistance Like a Map
Support and resistance levels form the backbone of chart technical analysis. They show you where price reacted in the past — and likely will again.
Support: A Price Level Where Buyers Previously Stepped In.
Resistance: A Level Where Sellers Pushed Price Down.
The more times a level is tested, the more important it becomes. These zones can act as entry/exit points or as signals for potential breakouts or reversals.
3. Add Indicators — But Don’t Overload!
Indicators are helpful — if used right. The key is to complement price action, not replace it. Start Simple:
RSI (Relative Strength Index): Detect Overbought/Oversold Conditions
Volume: Confirms Strength Behind Price Moves
Moving Averages: Help Identify Trends and Dynamic Support/Resistance
Avoid piling on too many indicators. If your technical analysis chart looks like a control panel, you might be overcomplicating your decision-making.
4. Timeframes Matter — And So Does Context
Don’t mix signals across timeframes without context. A bullish setup on the 15-minute chart can collapse under a bearish daily trend.
Watch for Multi-Timeframe Analysis:
Weekly: Macro Trend
Daily: Trading Bias
4H/1H: Entry and Exit Planning
This layered approach helps you stay aligned with momentum while avoiding short-term noise.
Full Breakdown: Technical Chart Analysis of BTC/USDT (1W)
The BTC/USDT weekly chart presents a textbook example of how price evolves through well-defined market phases, structural levels, and momentum shifts. Let’s walk through each component in detail — not just what is shown on the chart, but also why it matters and how it’s typically identified in technical analysis.
We begin by examining the market structure. From mid-2020 to late 2021, Bitcoin followed a strong uptrend, consistently printing higher highs and higher lows. This kind of price action is characteristic of bullish expansion phases, where momentum builds gradually and pullbacks are shallow. Technically, an uptrend is confirmed when each new peak surpasses the previous, and support continues to form above former lows. In this case, the trend accelerated rapidly into the $60K–$70K zone before exhaustion set in.
The shift occurred in late 2021, as the market transitioned into a macro correction. From a structural standpoint, the pattern reversed — lower highs began to form, and key support levels were breached. This downtrend, lasting through 2022, is a typical bear phase in a market cycle, where distribution outweighs accumulation. Price made several failed attempts to reclaim previous highs, confirming bearish control and increased selling pressure.
What followed was an extended period of sideways movement between late 2022 and early 2023 — a classical accumulation zone. This phase is often overlooked but is critical in technical chart analysis. Here, price consolidated in a narrow range, with volatility contracting and RSI hovering near oversold territory. This kind of stabilization often signals that selling pressure has subsided and that larger players may be building positions ahead of a breakout. It is identified not just by price flattening, but by volume dropping and the absence of directional follow-through in either direction.
By mid-2023, a recovery structure began to emerge. Bitcoin started printing higher lows and eventually broke above prior resistance zones, indicating the formation of a new trend. As of early 2025, this trend appears to be unfolding, though price is once again facing historical resistance near its all-time highs — the $69K–$74K zone. This region has acted as a ceiling in both the 2021 and 2024 cycles, making it a well-established historical resistance level. In technical terms, the more times a level rejects price, the more significant it becomes, as market participants tend to place orders around such zones in anticipation of repeated behavior.
One of the most important structural zones on the chart lies around the $50K–$53K range. This mid-zone has acted as support during the 2021 bull run, flipped into resistance during the 2022 downtrend, and has once again returned to functioning as a support area in the current recovery. This phenomenon — where old support becomes new resistance and vice versa — is a classic concept in technical chart analysis, signaling that market memory is active and that this level is psychologically and technically significant.
At the lower end, the $30K level has held repeatedly across multiple market phases, establishing itself as a long-term support zone. Its durability, despite heavy corrections, suggests significant accumulation and investor interest at that level. This zone has marked major bottoms and remains a key threshold that, if broken, could signal a structural shift in sentiment.
Momentum analysis further confirms these phases. The Relative Strength Index (RSI), plotted beneath the price chart, hovered in overbought territory during both the 2021 and 2024 peaks, exceeding 70 and signaling potential exhaustion. In contrast, the RSI dipped into the 30s in 2022, aligning with the end of the downtrend and beginning of accumulation. These signals are not to be taken in isolation, but when combined with structure and volume, they add powerful confirmation to trend shifts. At the time of writing, RSI sits around 48 — neutral ground, indicating the market has not yet committed to a new directional move.
This layered approach — combining trend structure, support and resistance zones, and momentum indicators like RSI — is fundamental to technical chart analysis. It enables traders to navigate through market noise and identify phases of expansion, correction, and re-accumulation with greater clarity. Each of these elements, when aligned, increases the probability of high-conviction setups and helps avoid emotionally driven decisions in volatile environments.
Final Thought
Mastering technical chart analysis isn’t about memorizing patterns — it’s about training your eyes to read structure, sentiment, and context. And like any skill, the more charts you read, the sharper you get.
This is only an isolated analysis of the macro trend — a high-level look at Bitcoin’s price structure using weekly timeframes. In reality, technical analysis can be performed across multiple timeframes, combining far more indicators, chart patterns, and volume-based tools depending on your strategy and goals.
Platforms like TradingView offer a wide range of features for deeper technical insight — from advanced oscillators to custom scripting and community-driven indicators. The chart above serves as a historical case study, not a trading signal. It provides a reference point for how sentiment shifts can be visualized over time through structure and momentum.
If you’d like to explore other educational breakdowns or real-time analysis, feel free to check out more content on our TradingView page. This post is not financial advice, but 100% a technical perspective on past price action and market behavior.
💬 What’s your go-to indicator or setup when doing token price analysis?
This analysis is performed on historical data, does not relate to current market conditions, is for educational purposes only, and is not a trading recommendation.

Technical Analysis on BitcoinHey guys
Bitcoin has recently broken out of a long-term descending channel, which has caught the attention of many traders. Typically, once the price stabilizes outside of such a channel with confirmed candlestick closes, buyers enter the market in anticipation of a bullish move. However, it's important to be cautious.
There is still a possibility that the price may retrace to a highlighted liquidity zone below, where it can gather enough momentum and liquidity for a stronger upward movement.
Therefore, traders should be aware of potential false breakouts and wait for solid confirmations before fully committing to long positions.

Trading Smarter, Not Harder: Decoding Institutional MovesThere’s an old saying in trading: “Follow the smart money.” But how do you know where the smart money is going? The answer lies not in guesswork but in data—specifically, the kind of institutional-grade data that most retail traders overlook. If you’re serious about understanding market dynamics, it’s time to dive into the world of **COT (Commitment of Traders) reports** and **options flow data** from the **CME (Chicago Mercantile Exchange)**. These tools are like your personal radar, cutting through the noise to reveal what the big players are doing.
Step 1: Understanding the Big Picture – Why Market Sentiment Matters
Before we zoom into the specifics, let’s start with the basics. Markets are driven by sentiment—the collective mood of participants. When fear dominates, prices fall; when greed takes over, they rise. But here’s the catch: Retail traders often react to sentiment after it’s already priced in. By the time you see a headline screaming “Market Crashes!” or “Record Highs!”, the opportunity has likely passed.
This is where systematic analysis comes in. Instead of relying on emotions or lagging indicators, smart traders use raw data to anticipate shifts in sentiment. And two of the most powerful sources of this data are **COT reports** and **CME options flow**.
Step 2: The Commitment of Traders (COT) Report – Peering Into the Mind of Institutions
The **COT report**, published weekly by the Commodity Futures Trading Commission (CFTC), provides a breakdown of positions held by different types of traders: commercial hedgers, non-commercial speculators (like hedge funds), and small retail traders. Here’s why it’s invaluable:
- **Commercial Hedgers**: These are the “smart money” players—producers and consumers who use futures markets to hedge their risk. For example, a sugar producer might sell futures contracts to lock in prices. Their actions often signal future supply and demand trends.
- **Non-Commercial Speculators**: These are the momentum-driven players who bet on price movements. Tracking their positioning helps identify potential reversals.
- **Small Traders**: Often considered the “dumb money,” their positions frequently coincide with market tops or bottoms.
By systematically analyzing the COT report, you will discover your ability to identify patterns and positioning levels of participants that signal trend reversals or the onset of corrections. Seriously, this will blow your mind! The insights you gain will be so groundbreaking that they will change your trading game forever.
Step 3: Options Flow – Real-Time Insights Into Institutional Activity
While the COT report offers a macro view, **options flow** gives you real-time insights into institutional activity. Directly through CME data feeds, you can track large block trades in options markets. Here’s why this matters:
It will take some time, observation, and comparison with price charts to learn how to uncover insights that lead to trades with a risk-reward ratio of 1:10 or even higher. This isn’t about needing to make options trades; that’s not a requirement. It’s about being able to trade the Forex market much more effectively by using entry points highlighted by options and futures market reports.
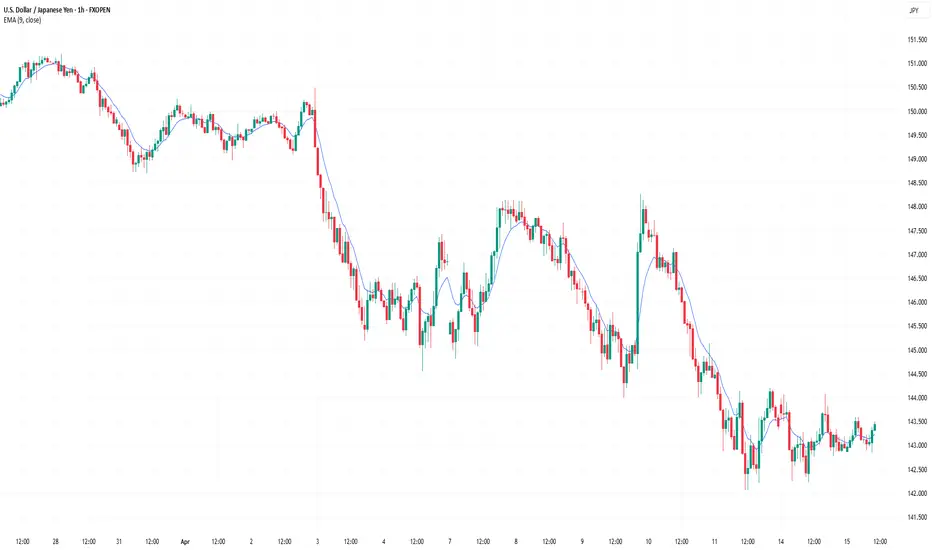
For example, over the past few weeks, the USD/JPY pair has been in a downtrend. Long before this happened, major players were accumulating positions in call options on the futures for the yen (which is equivalent to a decline in the yen). We discussed this before the drop occurred (you can easily find those analyses on our page ).
What’s remarkable is that there are many such insights available. For certain instruments (like precious metals and currency pairs), these insights appear with a certain regularity and provide excellent sentiment for opening positions or reversing positions in the opposite direction.
Step 4: Connecting the Dots – From General Trends to Specific Trades
Now that we’ve covered the tools, let’s talk about how to apply them systematically. Imagine you’re analyzing the sugar futures market (a favorite among commodity traders):
1. **Check the COT Report**: In the precious metals market, commercials are often positioned short, hedging against the risk of a decline in the underlying asset's value. When their net position hovers around zero , it typically signals a bullish trend for gold prices in the vast majority of cases.
2. **Analyze Options Flow**: when filtering options by sentiment, there are several key factors to consider:
- Size and value of the option portfolio
- Distance from the central strike (Delta)
- Time to expiration
- Appearance on the rise/fall of the underlying asset
Option portfolios with names such as vertical spread, butterfly, and condor (iVERTICAL SPREAD, IRON FLY/FLY, CONDOR/IRON CONDOR) have predictive sentiment regarding the direction of the asset's price movement. While "naked" options (PUT or CALL options) with above-average volume can signal that the price is encountering a significant obstacle at that level, leading to a potential bounce off that level (support or resistance).
3 **Combine with Retail Positions Analysis**: Look for opportunities to trade against the crowd. If retail sentiment is overwhelmingly bullish, consider a bearish position, and vice versa.
This layered approach ensures you’re not just reacting to headlines but making informed decisions based on valuable data.
Step 5: Why Systematic Analysis Sets You Apart
Here’s the truth: Most traders fail because they rely on intuition rather than evidence. They chase tips, follow social media hype, or get swayed by emotional biases. But markets reward discipline and preparation. By mastering tools like COT reports and options flow, you gain a competitive edge—a deeper understanding market breath! The path of least resistance!
Remember, even seasoned professionals don’t predict every move correctly.However, having a reliable structure allows you to maximize profits from transactions, eliminate noise and unnecessary (questionable) transactions.
Final Thoughts: Your Path to Mastery
If there’s one takeaway from this article, let it be this: The best traders aren’t fortune-tellers; they’re detectives. They piece together clues from multiple sources to form a coherent picture of the market. Start with the big picture (COT reports), zoom into real-time activity (options flow), and then refine your strategy with technical analysis.
So next time you open chart, don’t just look at price. Dive into the reports/data before. Ask questions. Connect the dots. Because in the world of trading, knowledge truly is power.
What’s your experience with COT reports or options flow? Share your thoughts in the comments below—I’d love to hear how you incorporate these tools into your trading routine!
**P.S.** If you found this article helpful, consider bookmarking it for future reference.

Smart Traders Watch the Fed — Smarter Ones Watch the DollarHello Traders 🐺
In this idea, I decided to talk about the U.S. Dollar Index (DXY) — because so many people have been asking me:
“How do you predict the Fed’s moves, and how do they affect deflationary assets like BTC?”
My last idea was about BTC, where I explained why I believe a major bull run is coming — and part of that is because the Fed might soon shift back to QE.
But if you're trying to predict QE...
The first thing you need to watch is the U.S. Dollar Index, which reflects the strength of the U.S. Dollar.
So let’s break it all down:
🔍 Part 1: What Does the Fed Actually Do?
The Fed isn’t just a printer — it’s the U.S. central bank, and it has a dual mandate:
✅ Keep prices stable (control inflation)
✅ Promote maximum employment
That means the Fed doesn’t just want growth — it wants sustainable growth. No crazy inflation, no deep recession. Balance is key.
🧰 How Does the Fed Do It?
Through Monetary Policy, which is basically the toolkit used to control liquidity, interest rates, and economic behavior (like how much people borrow, spend, or save).
Let’s break down the main tools:
1️⃣ Federal Funds Rate
This is the most powerful tool the Fed has.
It’s the rate banks use to lend to each other overnight.
If the Fed raises the rate:
→ Loans get expensive
→ Spending slows
→ Inflation drops
→ But markets can crash
If the Fed cuts the rate:
→ Loans get cheaper
→ Demand rises
→ Growth accelerates
→ But inflation can surge
2️⃣ Open Market Operations (OMO)
This is how the Fed injects or removes liquidity using bonds.
Buys bonds → Injects money → 🟩 QE (Quantitative Easing)
Sells bonds / lets them expire → Removes money → 🟥 QT (Quantitative Tightening)
3️⃣ Reserve Requirements
This used to be a big deal — the % banks had to hold in reserves.
But since 2020, it's set to 0%.
4️⃣ Discount Rate
The interest rate the Fed charges banks directly.
A change here sends a strong signal to the markets.
Sometimes the Fed also works in sync with the U.S. government — using fiscal support like:
💸 Stimulus checks
🏢 Corporate bailouts
🧾 Tax relief packages
📈 So... Why Does the Dollar Index (DXY) Matter?
There’s a very clear inverse correlation between the DXY and BTC.
When the dollar gets stronger (DXY pumps), BTC usually dumps.
Why? Because rising DXY often means:
🔺 The Fed is raising rates
🔺 Liquidity is being pulled out
🔺 QT is in play
Let me show you some real chart examples:
📉 July 2014 — DXY pumped → BTC dumped hard
DXY Chart:
BTC Chart:
➡️ Just a 28% DXY pump → 80% BTC crash. Ouch.
📈 2017 — DXY dropped → BTC entered full bull market
DXY Chart:
BTC Chart:
➡️ A 15% DXY drop → Bitcoin bull run of a lifetime.
Now here’s the good news 👇
DXY is starting to look very bearish on the chart:
Combine that with the Fed shifting to QE, and guess what?
We're likely entering the early stages of another bull market.
If you read my last BTC idea, you already know what I’m expecting...
🚀 A massive run is just around the corner.
I hope you found this idea useful, and as always —
🐺 Discipline is rarely enjoyable, but almost always profitable 🐺
🐺 KIU_COIN 🐺

Head and Shoulders Pattern: Advanced Analysis for Beginners█ Head and Shoulders Pattern: Advanced Analysis for Beginners
The Head and Shoulders pattern is one of the most widely recognized and reliable patterns in technical analysis. And today, I am going to teach you how to use it as efficiently as an experienced trader would.
Learning to spot and trade this pattern can be a great asset in your tool belt —whether you’re trading stocks, forex, or cryptocurrencies.
The Head and Shoulders is a well-known reversal pattern in technical analysis that signals a potential trend change.
⚪ It consists of three peaks:
The Left Shoulder: A peak followed by a decline.
The Head: A higher peak formed after the left shoulder, followed by a decline.
The Right Shoulder: A smaller peak resembling the left shoulder, followed by another decline.
When these peaks form in a specific order and the price breaks below the neckline (the line connecting the two troughs between the shoulders), it indicates a bearish reversal from an uptrend to a downtrend.
█ What about Bullish reversals? Don’t worry — there's good news!
Conversely, the Inverse Head and Shoulders pattern forms at the bottom of a downtrend and signals a potential reversal to the upside. By recognizing the pattern early, you can position yourself for a high-probability trade with a clear entry and exit strategy.
█ How to Identify a Head and Shoulders Pattern?
I truly believe the best way to learn any trading strategy is to keep it simple, away from the “technical” jargon unless absolutely necessary. We’ll do the same with this strategy.
Despite its varied usage, you can break it down into four simple steps:
1. Look for the Left Shoulder
The first part of the pattern forms when the price rises , creating a peak. Then, it declines back down to form the trough . This creates the Left Shoulder of the pattern.
Example: If the price of Bitcoin (BTC) rises from $85,000 to $90,000, and then declines to $87,500. This is your Left Shoulder.
2. Spot the Head
The second part of the pattern is the Head . After the Left Shoulder, the price rises again , but this time, it forms a higher peak than the Left Shoulder. The price then declines again, creating a second trough .
Example: Continuing with Bitcoin, after the price dropped to $87,500, it rises to a new high of $95,000 before dropping back to around $90,000. This $95,000 peak is the Head, which is higher than the Left Shoulder.
3. Find the Right Shoulder
After the decline from the Head, the price rises again, but this time, the peak should be smaller than the Head, forming the Right Shoulder . The price then starts declining again, and this is where the neckline is formed (connecting the two troughs).
Example: Bitcoin then rises from $90,000 to $92,000 (lower than the $95,000 peak). This forms the Right Shoulder, and the price starts to decline from there.
4. Draw the Neckline
The neckline is drawn by connecting the lows (troughs) between the Left Shoulder and the Head, and between the Head and the Right Shoulder. This is your key reference level.
█ How to Trade the Head and Shoulders Pattern
Once you've spotted the Head and Shoulders pattern on your chart, it’s time to trade it. And yes, it did need a separate section of its own. This is where most amateur traders mess up - the finish line.
1. Wait for the Neckline Breakout
The most crucial part of the Head and Shoulders pattern is the neckline breakout . This is when the price breaks below the neckline, signaling the start of the trend reversal.
Example: After the price rises to form the Right Shoulder at $92,000, Bitcoin then drops below the neckline (around $90,000). This is the confirmation that the pattern is complete. The price of BTCUSD is likely to continue downward past the 90k mark.
2. Enter the Trade
Once the price breaks below the neckline, enter a short position (for a bearish Head and Shoulders pattern). This is your signal that the market is reversing from an uptrend to a downtrend.
3. Set Your Stop Loss
Your stop loss should be placed just above the right shoulder for a bearish Head and Shoulders pattern . This makes sure you are protected in case the pattern fails and the price reverses back upward.
Example: Place your stop loss at around $93,000 (just above the Right Shoulder at $92,000) on BTCUSD.
You can also try one of these strategies I have used in the past:
⚪ Conservative Stop: Place the stop above the head (for bearish H&S) or below the head (for bullish iH&S) for maximum safety.
⚪ Aggressive Stop: Place the stop above the right shoulder (for bearish H&S) or below the right shoulder (for bullish iH&S) to reduce your stop size.
⚪ Neckline Reclaim Invalidation: Exit the trade if the price reclaims the neckline after breaking it. This could be an indication of a false positive/invalid pattern.
4. Set Your Profit Target
To calculate your profit target, measure the distance from the top of the Head to the neckline and project that distance downward from the breakout point.
Example: The distance from the Head at $95,000 to the neckline at $90,000 is $5,000. So, after the price breaks the neckline, project that $5,000 downward from the breakout point ($89,800), which gives you a target of $84,800.
5. Monitor the Trade
We’re in the home stretch now, people. This is the 9th inning.
There’s only one job left: keeping an eye on any retests or contrarian moves.
As the price moves in your favor, you can scale out or move your stop loss to break even to lock in profits.
█ What makes H&S strategy an all-time classic?
It’s simple. It works.
This pattern works because it reflects a shift in market sentiment:
In a Head and Shoulders pattern , the uptrend slows down as the market struggles to make new highs, and then the price ultimately breaks down, signaling that the bulls have lost control.
In an Inverse Head and Shoulders pattern , the downtrend weakens as the market fails to make new lows, and the price breaks upwards, signaling a bullish reversal.
⚪ Here are a few points to remember as a cheatsheet for Head and Shoulders patterns:
Wait for the neckline breakout to confirm the pattern.
Set a stop loss above the right shoulder for protection.
Project the price target using the height of the head for a realistic profit goal.
Always monitor the trade for any signs of reversal or false breakouts.
Mastering this pattern can be a game-changer for any trader, but like any tool, it’s only effective when combined with other indicators, strategies, and a solid risk management plan.
-----------------
Disclaimer
The content provided in my scripts, indicators, ideas, algorithms, and systems is for educational and informational purposes only. It does not constitute financial advice, investment recommendations, or a solicitation to buy or sell any financial instruments. I will not accept liability for any loss or damage, including without limitation any loss of profit, which may arise directly or indirectly from the use of or reliance on such information.
All investments involve risk, and the past performance of a security, industry, sector, market, financial product, trading strategy, backtest, or individual's trading does not guarantee future results or returns. Investors are fully responsible for any investment decisions they make. Such decisions should be based solely on an evaluation of their financial circumstances, investment objectives, risk tolerance, and liquidity needs.

Understanding Our Approach: High-Probability Reversals Understanding Our Approach: High-Probability Reversals with Price & Time Analysis
Hello Fellow Traders!
We often get asked about the core principles behind our analysis here on TradingView. Today, we want to share a key part of our methodology: how we combine Price Analysis and Time Analysis to pinpoint potentially high-probability reversal signals in the market.
Our goal isn't just about finding any setup, but finding setups where the odds seem stacked more favorably for a potential trend change. We do this by looking for confluence – where different factors align.
1. Price Analysis: Finding Where the Market Might Turn
What it is: This is about identifying significant price levels on the chart. Think of these as important zones, not just single lines.
How we use it:
Support & Resistance: We look for historical areas where price has repeatedly bounced off (support) or struggled to break through (resistance). The stronger and more tested the level, the more significant it becomes.
Price Action Clues: We watch how price behaves when it reaches these key levels. Are there strong rejection candles (like pin bars or engulfing patterns)? Is momentum slowing down? These clues tell us if buyers or sellers are stepping in or losing control.
2. Time Analysis: Finding When the Market Might Turn
What it is: This adds the dimension of time to our price analysis. Markets often move in cycles or react around specific time points.
How we use it:
Timing Cycles: We look for potential cycles or rhythmic patterns in price swings. Sometimes, trends tend to exhaust themselves after a certain duration.
Time Convergence: We pay close attention when price approaches a key Price Level (from step
1) around a potentially significant Time point (e.g., end of a known cycle, specific session timing, alignment with time-based indicators if used).
The Synergy: Combining Price & Time for High-Probability Signals
The real power in our approach comes when Price and Time align.
Imagine price reaching a major historical resistance level (Price Analysis).
Now, imagine this happens exactly when a known time cycle is expected to complete (Time Analysis).
This convergence signals a potentially higher probability reversal point than if only one factor was present. It tells us that where the market is and when it got there are both significant.
How You Can Apply This Concept:
Identify Key Levels: Mark major support and resistance zones on your charts.
Observe Time: Become aware of market timing – session opens/closes, news events, or potential cyclical patterns you observe.
Look for Confluence: Wait for price to test a strong level around a potentially significant time point.
Seek Confirmation: Always look for confirmation signals (like candlestick patterns or divergence) at these points of confluence before considering any action.
Important Note: Trading involves significant risk. This methodology aims to identify higher probability setups, but no method guarantees success. Always use proper risk management and conduct your own analysis before making any trading decisions. This is shared for educational purposes.
We hope this gives you a clearer insight into our analysis process! Follow us here on TradingView to see how we apply these concepts in our regular updates. Feel free to ask questions in the comments – we're all here to learn together.
Want to Level Up?
Join Shunya Trade’s Mentoring Program to master these strategies and sharpen your technical analysis skills.
Trade safely!
-----------------------------------------------------------------------------------------------
Here few Historical chart study's
-----------------------------------------------------------------------------------------------
PriceAnalysis, TimeAnalysis, PriceAction, TechnicalAnalysis, SupportResistance, CandlestickPatterns, ChartPatterns, MarketStructure, TimeCycles, MarketTiming, TradingSignals, ReversalTrading, TradingStrategy, MarketAnalysis, TradingView, Forex, Stocks, Crypto, Trading, Investing, DayTrading, SwingTrading, MarketCycles, FibonacciTime, Gann, TradingLevels, PricePatterns

The Ultimate Guide to Smart Money ReversalsLet’s cut to it. Most retail traders get caught chasing moves that were never meant for them. They’re entering late, reacting to structure breaks without context, or fading moves without understanding what’s really happening behind the price.
If you're trying to trade like smart money on the reversal, at the turn then you need to know when the game is flipping. That’s where the Market Structure Shift (MSS) comes in. But not just any MSS. I'm talking about MSS that follow a liquidity sweep and are driven by real displacementnot weak candles, not in consolidation. Real intent. Real shift.
Here’s how I approach it.
What Actually Counts as a Market Structure Shift?
Everyone talks about market structure higher highs, lower lows, etc. But structure breaks alone don’t mean anything. A valid MSS isn’t just about breaking a swing point. It’s why it broke and how it broke that matters.
I only consider a shift valid when three things are in place:
Liquidity has been taken (above a high or below a low).
The shift is caused by a displacement candle that clearly shows urgency.
The move happens with strength, not during chop or consolidation.
If you don’t have all three, it’s just noise.
Liquidity Comes First
Everything starts with a liquidity sweep. That’s the trap.
Price has to reach into a pool of liquidity usually above equal highs, clean swing highs, or below clean lows to grab those orders, and reject. That rejection is key. It shows smart money is offloading positions into retail breakouts or stop hunts.
Without a sweep, I don’t care what breaks. No liquidity = no reversal setup.
So the first thing I do is mark out obvious liquidity levels. Equal highs, equal lows, trendline touches anywhere retail is likely to have their stops sitting. That’s where the fuel is.
Then Comes Displacement
After the sweep, I want to see displacement a sharp, aggressive move in the opposite direction.
Not a weak pullback. Not a slow grind. A real candle that shows intent.
Displacement is always obvious. You’ll get a clean candle, often engulfing multiple others, that breaks structure and leaves behind an imbalance what we call a Fair Value Gap (FVG). That imbalance is the signature of smart money hitting the market hard enough to leave a gap in the order flow.
If the candle’s weak, or if it happens during consolidation, I skip it. Displacement is what separates real reversals from fakeouts.
Here is a clean example of what it should look like.
Confirming the Shift
Once displacement confirms intent, I check if it actually broke structure.
That means:
In an uptrend, I want to see price break a previous higher low after sweeping a high.
In a downtrend, I want price to break a lower high after sweeping a low.
When that happens, that’s your MSS. Price has grabbed liquidity, shown displacement, and broken a key point in the structure. At that point, we’ve got a confirmed shift in control.
Entries, Stops, and Targets
Here’s how I trade it.
After the MSS, I wait for price to pull back into the origin of the move. Usually, that’s going to be one of two things:
The Fair Value Gap (imbalance left by the displacement candle)
Or the MSS line itself (Shown on the example)
Once price comes back into that zone, that’s where I’m interested in getting in.
Stop loss always goes just above the high (for shorts) or below the low (for longs) of the displacement candle that caused the MSS. You’re giving it room to breathe, but keeping it tight enough to protect capital.
Targets are straightforward: go for the next pool of liquidity. That means swing lows (sell-side) if you’re short, or swing highs (buy-side) if you’re long. That’s where price is most likely to be drawn next.
A Clean Bearish Example
Let’s say price is trending up, putting in higher highs and higher lows. Then it takes out a recent swing high liquidity swept.
Immediately after that, a strong bearish candle drops and breaks the most recent higher low. That candle leaves an imbalance behind—perfect.
Now I’ve got:
✅ Liquidity sweep
✅ Displacement
✅ Break of structure
I mark out the FVG / MSS line, wait for price to retrace back into it, and enter the short. My stop goes above the displacement candle high. My target? The next clean swing low. That's the next spot where stops are resting where the market is drawn.
A Few Things to Watch Out For
This method works, but only if you’re strict about the rules.
Don’t take MSS setups in consolidation. Wait for clean, impulsive breaks.
If the shift happens without displacement or imbalance, skip it. It’s not clean.
Be realistic with stops. Tight is good, but don’t choke the trade. Give it the structure it needs.
The biggest mistake I see? Traders jump in too early trying to front-run the shift before displacement confirms it. Let the story unfold. Wait for the sweep. Wait for the candle that slaps the market and breaks structure. That’s your edge.
As shown here, the first "MSS" is invalid and not the A+ setup you're looking for.
Final Thoughts
Trading smart money reversals is about reading intent. You’re not just looking at price, you’re understanding why it moved the way it did.
When you combine a liquidity grab, displacement, and a break in structure, you're aligning with institutional activity. You're trading at the turn when smart money flips the script and leaves everyone else chasing.
This isn’t about trading every break. It’s about knowing which breaks matter.
Keep it clean. Stay patient. Follow the flow.
__________________________________________
Thanks for your support!
If you found this guide helpful or learned something new, drop a like 👍 and leave a comment, I’d love to hear your thoughts! 🚀
Make sure to follow me for more price action insights, free indicators, and trading strategies. Let’s grow and trade smarter together! 📈

Supply and Demand by Thapelo Consolidation and Expansion
The markets either do one of two things: Price either consolidates or expands.
Consolidation: a period in the market where price is moving calm which moves in a range known as the dealing range. We will be able to identify a clear high and low to this range.
You have probably heard of the term range bound, ranging, or consolidating. This means that price is typically staying in one area, and just moving sideways, rather than up or down.
The range can be tight (meaning a spread of only a few pounds), or the range can be loose (meaning a spread of hundreds of thousands of pounds from range high to low. This partly will come down to the timeframe implemented.
Expansion: a period in the market where price is moving aggressively in one direction or the other. We will see an impulsive move to the upside, or an impulsive move to the downside, where price will give us large candle bodies or wicks. This is known as expansion.

How Can You Use the Ascending Triangle in Trading?How Can You Use the Ascending Triangle in Trading?
An ascending triangle is a chart pattern traders rely on to identify potential breakouts and further price movements. Recognised for its versatility, this pattern can signal trend continuations across all types of markets, including stocks, forex, commodities, and cryptocurrencies*. In this article, we’ll break down how to spot and trade this formation.
What Is an Ascending Triangle?
An ascending or rising triangle is a bullish chart pattern that usually signals a trend continuation. It is framed by two trendlines. The upper line connects highs placed at almost the same level, while the lower line is angled and connects higher lows.
The triangle’s appearance is explained as follows: buyers try to push the price up, but they meet a strong resistance level, so the price rebounds. Still, buyers have strength, which is reflected in higher lows. Therefore, they continue pushing the price until it breaks above the resistance level. The period during which the price bounces back and forth between the two lines depends on the timeframe. On daily charts, the triangle can be in place for over a week.
Note: The ascending triangle is a continuation chart pattern but sometimes it can be used as a reversal signal. It happens when the ascending triangle occurs in a downtrend. It’s the biggest challenge of all the triangles.
The rising triangle is one of the setups in the triangle group. There are also descending and symmetrical formations.
Ascending, Descending, and Symmetrical Triangles: The Differences
The triangle group of patterns comprises ascending, descending, and symmetrical formations.
The ascending triangle is a bullish formation and the descending triangle is bearish. At the same time, the symmetrical triangle is a bilateral setup that signals a rise and a fall in the price.
To distinguish between them, traders draw trendlines. In a rising triangle pattern, an upper trendline is horizontal and connects equal or almost equal highs, while the lower trendline is rising as it connects higher lows. In a descending or falling triangle pattern, the lower trendline is horizontal and connects equal or almost equal lows, while the upper trendline declines, going through lower highs. A symmetrical triangle has a falling upper line that connects lower highs and a rising lower line that connects upper lows.
How Traders Spot the Ascending Triangle
It’s quite easy to identify the formation on a chart. Still, there are a few rules that may help a trader determine its strength.
- The trend strength. Although the setup may appear on any timeframe, traders look for strong long-term trends as risks of a fakeout on low charts are higher.
- Consolidation. Triangles appear when the market consolidates within an overall trend.
- Trendlines. Trendlines must be drawn through at least two points. Still, the larger the number of points, the higher the possibility the setup works.
- Breakout. Can the ascending triangle pattern be bearish? No. It is a bullish formation that appears in a bullish and a bearish trend but always signals a potential price rise.
How Can You Trade Ascending Triangles?
The rising triangle pattern is usually considered a continuation setup formed in an uptrend. Still, if the ascending triangle is in a downtrend, it may signal a trend reversal. The trading rules will be the same in both cases.
As with most chart patterns, triangles have specific rules that help traders place entry and exit points.
Entry
The theory suggests trades go long when the price breaks above the setup's upper boundary. In a conservative approach, traders wait for the price to form at least several candles before entering the market. In a risky strategy, traders open a position as soon as the breakout occurs, and the breakout candlestick closes.
It's worth considering trading volumes as breakouts often turn into fakeouts, meaning the market returns to its previous trend. The chance of a strong breakout is higher if the volumes are high.
However, increased volumes aren't the only tool used to confirm a breakout. Many traders consider trend indicators and oscillators to potentially limit the risks of bad trading decisions.
- If the triangle serves as a continuation setup, it may be helpful to look at the signals of trend-strength indicators, including the average directional index.
- If traders use the ascending triangle as a reversal setup, they usually implement indicators that may signal a trend reversal, including the moving average, the relative strength index, the moving average convergence divergence, and the stochastic oscillator.
Take Profit
A standard take-profit target equals the size of the largest part of the setup and is measured just from the breakout trendline.
Stop Loss
Traders consider several options when placing stop-loss levels. In a conservative approach, they implement the risk/reward ratio, which is usually 1:2 or 1:3 but depends on the trader's willingness to take risks. Also, traders utilise the upper trendline as a threshold and place the stop-loss order just under it.
Note: These are general rules. However, traders can develop their own trading strategies and adjust the pattern's parameters and rules according to their trading approach.
Ascending Triangle: Strategy
In this strategy, traders observe an existing bullish trend and the formation of an ascending triangle, which suggests the potential for a continuation pattern. Incorporating a short-term moving average, such as a 9-period EMA, provides dynamic support, aligning with the trendline to strengthen the setup.
Entries
- Traders typically wait for the price to break through the top trendline of the ascending triangle.
- A strong candle breaking the resistance level adds confidence, though any move above the top trendline can serve as an entry signal.
- The price should also trade above the moving average, offering additional confirmation.
- An order is often placed at the top trendline, anticipating a retracement to this level, which now acts as support.
Stop Loss
- Traders place a stop-loss below the most recent swing low within the triangle.
- For more conservative traders, the stop may be set at any prior swing low, depending on risk tolerance.
Take Profit
- Many traders aim for a risk-reward ratio of 1:2 or 1:3.
- Profits might also be taken at the next strong resistance level, aligning with the market structure.
Rising Triangle: Benefits and Drawbacks
This formation has advantages and pitfalls that traders consider when developing their strategies.
Benefits
- It can be used on any timeframe. Triangles are formed on charts of any period. Still, they might be more effective if the setup appears in a solid trend on a high timeframe.
- It can be used for any asset. Another advantage is that the ascending triangle pattern is used for stock, commodity, cryptocurrency*, and Forex trading.
- Easy to spot. A trader only needs to draw two trendlines to define this setup on the chart.
- Exact entry and exit points. Although traders can develop their entry and exit points, the setup assumes there are specific rules traders with any experience utilise.
Drawbacks
- It can confuse traders. As the rising triangle is used as a reversal and continuation formation, traders with less experience may be confused with its signals.
- False breakouts. The setup works when a price breakout occurs. However, there is a high risk the breakout will appear to be a fakeout, and the price will return.
- The pattern may fail. Aside from a fakeout, there is another risk when trading with triangles. The price may break another side of the formation, and the formation will fail.
- The trading rules may not work. Although specific rules indicate where a trader should place entry and exit points, buyers may be too weak to push the price to the take-profit target.
Final Thoughts
The ascending triangle is one of the more common chart patterns traders use when trading various assets. Still, there is no 100% guarantee that it will work every time you spot it on a price chart. It's vital to remember that every signal must be confirmed with other indicators, chart patterns, and candlesticks. Also, it's a well-known fact that any trade involves risks that should be considered every time a trader enters the market. Improve your skills by practising on different assets and timeframes.
FAQ
How Do You Form an Ascending Triangle?
An ascending triangle is formed when the price action creates a series of higher lows while facing a resistance level, resulting in a horizontal upper trendline and a rising lower trendline. The price consolidates between these two lines before potentially breaking out above the resistance, signalling a bullish continuation.
Is an Ascending Triangle Bullish or Bearish?
The ascending triangle is a bullish pattern. It suggests that buyers are gaining strength as higher lows form, increasing the likelihood of a breakout above the resistance level. There is a descending triangle pattern that usually appears in a downtrend, signalling a downward movement.
How to Enter an Ascending Triangle?
According to the theory, in triangle pattern trading, it’s common to enter the market when the price breaks above the upper trendline of the triangle. In a conservative approach, traders wait for confirmation through several closing candles after the breakout. The increased volume also adds confidence to the trade.
What Is the Ascending Triangle Pattern Retest?
A retest occurs when the price breaks out of the triangle but then briefly falls back to test the former resistance level. A successful retest confirms the breakout and can provide an additional entry point.
How Long Does an Ascending Triangle Pattern Take to Form?
The formation of a bullish triangle pattern can vary based on the timeframe. On daily charts, it can take several days to weeks, while on shorter timeframes, it might form within hours.
What Is the Difference Between an Ascending Triangle and a Rising Wedge?
In comparing the ascending triangle vs. the rising wedge, it’s key to recognise that the rising wedge has converging trendlines, signalling a possible weakening trend, often leading to a bearish reversal. In contrast, an ascending triangle trading pattern typically signals a continuation of the uptrend.
*At FXOpen UK, Cryptocurrency CFDs are only available for trading by those clients categorised as Professional clients under FCA Rules. They are not available for trading by Retail clients.
This article represents the opinion of the Companies operating under the FXOpen brand only. It is not to be construed as an offer, solicitation, or recommendation with respect to products and services provided by the Companies operating under the FXOpen brand, nor is it to be considered financial advice.
The Charts Wall Street Watches – And Why Crypto Should Too📉 Crisis or Rotation? Understanding Bonds Before the Bitcoin Reveal 🔍
Hi everyone 👋
Before we dive into the next major Bitcoin post (the 'Bitcoin Reveal' is coming up, yes!), let's take a moment to unpack something critical most crypto traders overlook — the world of bonds .
Why does this matter? Because the bond market often signals risk... before crypto even reacts.
We're going to walk through 4 charts I've posted recently — not the usual BTC or altcoin setups, but key pieces of the credit puzzle . So here’s a simple breakdown:
1️⃣ BKLN – Leveraged Loans = Floating Risk 🟠
These are loans to risky companies with floating interest rates.
When rates go up and liquidity is flowing, these do well.
But when the economy weakens? They’re often the first to fall.
📌 Key level: $20.31
This level held in COVID (2020), the 2022 bank scare... and now again in 2025.
⚠️ Watch for a breakdown here = real credit stress.
Right now? Concerned, but no panic.
2️⃣ HYG – Junk Bonds = Risk Appetite Tracker 🔴
Junk bonds are fixed-rate debt from companies with poor credit.
They pay high interest — if they survive.
When HYG bounces, it means investors still want risk.
📌 Fear line: 75.72
Held in 2008, 2020 (COVID), and again now.
Price rebounded — suggesting risk appetite is trying to return .
3️⃣ LQD – Investment Grade = Quality Credit 💼
LQD holds bonds from blue-chip companies like Apple, Microsoft, Johnson & Johnson.
These are lower-risk and seen as safer during stress.
📊 Chart still shows an ascending structure since 2003, with recent pressure on support.
📌 Support: 103.81
Holding well. Rebound looks solid.
Unless we break 100, this says: "No panic here."
4️⃣ TLT – U.S. Treasuries = Trust in the Government 🇺🇸
This is the BIG one.
TLT = Long-term U.S. bonds (20+ yrs) = safe haven assets .
But since 2022, that trust has been visibly broken .
A key trendline going back to 2004 was lost — and is now resistance.
📉 Price is in a clear descending channel .
📌 My expectation: One final flush to $76 or even $71–68
…before a potential macro reversal toward $112–115
🔍 The Big Picture – What Are Bonds Telling Us?
| Chart | Risk Level | Signal |
|--------|------------|--------|
| BKLN | High | Credit stress rising, but support holding |
| HYG | High | Risk appetite bouncing at a key level |
| LQD | Medium | Rotation into quality, no panic |
| TLT | Low | Trust in Treasuries fading, support being tested |
If BKLN breaks $20...
If HYG fails to hold 75.72...
If LQD dips under 100...
If TLT falls to all-time lows...
That’s your crisis signal .
Until then — the system is still rotating, not collapsing.
So, Should We Panic? 🧠
Not yet.
But we’re watching closely.
Next: We add Bitcoin to the chart.
Because if the traditional system starts breaking... 🟧 Bitcoin is the alternative.
One Love,
The FXPROFESSOR 💙
📌 Next Post:
BTC vs Treasuries – The Inversion Nobody Saw Coming
Because if the system is shaking… Bitcoin is Plan B.
Stay ready.

The End of Meme Coin Scams: A New UpdateWith the latest update, we are witnessing a shift in how meme coins operate in the crypto world, effectively putting an end to scams that have plagued the meme coin space.
Hello✌
Spend 3 minutes ⏰ reading this educational material. The main points are summarized in 3 clear lines at the end 📋 This will help you level up your understanding of the market 📊 and Bitcoin💰.
🎯 Analytical Insight on Bitcoin: A Personal Perspective:
Bitcoin is currently near a strong trendline and a solid daily support level. I’m expecting it to break the $90,000 mark, a key psychological level, within the next few days. My main target is at least a 7% increase, reaching $90,500.
📈
Now , let's dive into the educational section, which builds upon last week's lesson (linked in the tags of this analysis). Many of you have been eagerly waiting for this, as I have received multiple messages about it on Telegram.
A Recap of Meme Coin Creation and Scams
In a previous educational analysis, I walked you through the step-by-step process of how meme coins are created and, most importantly, how scammers often exploit these coins for personal gain. I explained the mechanics behind the manipulation of meme coins, where bad actors would create a coin, pump its price, and then abandon it once they made a profit, leaving countless investors in financial ruin.
The Hidden Aspect: How Creators Profited from Commissions
However, there was one critical aspect I did not discuss—how meme coin creators were profiting through transaction fees, also known as commissions. Prior to this update, many small-scale creators were incentivized to sell portions of their holdings at high prices, ensuring they made a profit, often at the cost of the coin's long-term stability. This led to price crashes, the collapse of the coin's market, and devastating losses for thousands of investors. 🚨
The Previous Model: 2 important platform one for creating the mem coin and second for transactions and fees
Under the previous system, meme coins were typically launched on platforms like P p .F n, which helped boost the coin’s liquidity through in-app promotions and social media outreach. This initial momentum would attract many investors, and then the coin would be listed on various exchanges for wider visibility.
To ensure that creators could continue to profit, the transactions would eventually shift to a new platform, which took all of the transaction fees, further enriching the platform but leaving creators with limited sustainable profits.
The New Update: Introducing new version for enring fees directly
With the latest update, the creator introduces a revolutionary feature. This addition fundamentally changes how meme coin creators can profit. Instead of relying on external platforms that take all the transaction fees, allows creators to receive a significant percentage of trading fees directly. This ensures that creators who are genuinely committed to the long-term success of their coin can continue to benefit from it without destroying the project once the coin gains traction.
A Sustainable Future for Meme Coins
This update paves the way for a new era where meme coins are not just tools for short-term profit but are sustainable and beneficial in the long run for both creators and investors. Creators who have the genuine intention to build and maintain their projects will now have the opportunity to continuously profit from them as the coin grows stronger and attracts more users. 🌱
Why This Matters for Investors
For investors, this is a game-changer. As meme coins become more reliable and profitable for creators, they also become safer and more promising for long-term investment. The more successful these meme coins become, the more lucrative it will be for investors in both the short and long term. 📈
By fostering a system that rewards creators based on the coin's success and longevity, this update helps eliminate the risk of sudden crashes. As a result, meme coins have the potential to evolve into solid, dependable projects rather than speculative assets that leave many in financial distress.
However , this analysis should be seen as a personal viewpoint, not as financial advice ⚠️. The crypto market carries high risks 📉, so always conduct your own research before making investment decisions. That being said, please take note of the disclaimer section at the bottom of each post for further details 📜✅.
🧨 Our team's main opinion is: 🧨
With the latest update, meme coin scams are effectively ending. creator website of meme coin now introduces new direct update for fees, which allows creators to earn a fair share of trading fees, ensuring they benefit long-term without abandoning the project. This makes meme coins more sustainable, rewarding both creators and investors. It’s a major shift towards stability and profitability in the meme coin space. 🚀
Give me some energy !!
✨We invest countless hours researching opportunities and crafting valuable ideas. Your support means the world to us! If you have any questions, feel free to drop them in the comment box.
Cheers, Mad Whale. 🐋

QE vs QT: The Invisible Force Behind Every Pump and Dump !Hello Traders 🐺
In this idea, I want to talk about macroeconomics and how QE and QT actually impact the economy and financial markets — and more importantly, how both pro traders and even non-professionals can benefit from understanding these basic concepts in their trading journey and even their everyday life.
So make sure to stick with me until the very end, because if you still don't know about these key metrics, this is going to be extremely helpful — and I promise I’ll keep it simple.
🔄 First... What Are QE and QT Anyway?
It’s simple:
QE (Quantitative Easing) = Pumping money into the system 💸
QT (Quantitative Tightening) = Sucking money out of the system 💀
That’s it.
The Fed either injects liquidity — or pulls it back.
And that liquidity is the real fuel of the market —
Not your RSI, not your fib levels, not your favorite influencer's altcoin pick.
🟩 What Is QE?
When the Fed wants to support the economy (like during a crash or recession), it prints money and buys government bonds, mortgage-backed securities, and more.
This increases liquidity → makes borrowing easier → and drives people toward risky assets like stocks and crypto.
✅ Benefits of QE:
Boosts markets (stocks, crypto, real estate — all of it)
Supports employment and economic growth
Weakens the dollar → makes exports stronger
❌ Downsides of QE:
Can lead to inflation or even hyperinflation if overused
Creates asset bubbles (aka pumps with no real fundamentals)
Weakens long-term purchasing power
In short:
QE = Bullish AF for markets — but dangerous if left unchecked.
🟥 What Is QT?
QT is the opposite.
When the economy overheats or inflation gets out of control, the Fed stops printing — and even starts removing liquidity from the system.
They let bonds expire or sell them off, reducing the amount of money circulating.
✅ Benefits of QT:
Helps bring inflation down
Cools off overheated markets
Restores balance after aggressive QE periods
❌ Downsides of QT:
Slows down the economy
Crashes risk assets (like BTC, tech stocks, etc.)
Can trigger a recession if done too fast or too long
QT = Bearish pressure for almost every chart you trade.
💡 Now that you understand QT and QE, let's talk about how we can use this in our trading.
To help you visualize it better, I’ve marked the QT and QE periods on the chart.
And as you’ll see, there’s a perfect correlation between Fed policy decisions and the BTC chart.
It almost looks like their policies decide exactly where and even when the tops and bottoms happen!
Let me explain it step by step — because while it might sound complicated, it’s actually very easy to understand:
📉 Example: The QT Period from 2017 to 2019
From October 2017 to September 2019, the Fed was in full QT mode — and we had three major phases in the market.
Phase 1:
When the Fed first announced QT, BTC was around a red monthly resistance line after a huge parabolic run-up.
Right after the announcement, BTC entered a sharp correction — all the way down to the monthly support.
(Shown with a red ellipse on the chart)
Phase 2:
BTC started to prepare for its next move — it accumulated below a bullish structure and slowly positioned itself for the next wave.
📉📈 Phase 3: The Big Corona Dump + QE Restart
Then came the third and most important phase of QT in the BTC chart:
The COVID crash — a sudden, brutal dump across all markets.
Sound familiar? Yeh, same pattern…
Immediately after the crash, the Fed announced QE and started pumping liquidity again → and we saw that huge parabolic run everyone remembers.
🔁 Now Here’s the Plot Twist... We’re Repeating the Same Pattern
Let’s break it down:
A huge crash after QT announcement (phase 1)
Market accumulation below a bullish structure (phase 2)
One final shakeout — just like the COVID dump — which I personally call Black Monday 2025 👀
And now… the Fed has hinted that they're ready to step in to stabilize the markets if needed ( phase three )
Guess what? Another round of QE could be coming...
In this idea, I tried to explain how QE and QT work — and show you the hidden forces behind every bull and bear cycle.
If you enjoyed this, make sure to follow and stay tuned for more.
And as always, never forget our rule:
🐺 Discipline is rarely enjoyable, but almost always profitable 🐺
🐺 KIU_COIN 🐺

Inversion Fair Value Gaps (IFVGs) - A Deep Dive Trading GuideIntroduction
Inversion Fair Value Gaps (IFVGs) are an advanced price action concept rooted in Smart Money theory. Unlike standard Fair Value Gaps (FVGs), IFVGs consider the idea of price revisiting inefficiencies from an inverse perspective. When price "respects" a previously violated gap from the opposite side, it creates a powerful confluence for entries or exits.
This guide will cover:
- What an IFVG is
- How it differs from traditional FVGs
- Market context for IFVG setups
- How to trade them effectively
- Real chart examples for clarity
---
What is an IFVG?
An Inversion Fair Value Gap (IFVG) occurs when price trades through a traditional Fair Value Gap and later returns to that area, but instead of continuing in the original direction, it uses the gap as a support or resistance from the other side.
Standard FVG vs. IFVG:
- FVG: Price creates a gap (imbalance), and we expect a return to the gap for mitigation.
- IFVG: Price violates the FVG, but instead of invalidation, it respects it from the other side.
Example Logic: A bullish FVG is formed -> price trades through it -> later, price revisits the FVG from below and uses it as resistance.
---
Structure and Market Context
Understanding structure is key when trading IFVGs. Price must break structure convincingly through a Fair Value Gap. The gap then acts as an inversion zone for future reactions.
Ideal Market Conditions for IFVGs:
1. Market is trending or has recently had a strong impulsive move.
2. A Fair Value Gap is created and violated with displacement .
3. Price retraces back to the FVG from the opposite side .
4. The gap holds as support/resistance, indicating smart money has respected the zone.
---
Types of IFVGs
1. Bullish IFVG: Price trades up through a bearish FVG and later uses it as support.
2. Bearish IFVG: Price trades down through a bullish FVG and later uses it as resistance.
Note: The best IFVGs are often aligned with Order Blocks, liquidity levels, or SMT divergences.
---
How to Trade IFVGs
1. Identify a clear Fair Value Gap in a trending market.
2. Wait for price to break through the FVG with momentum .
3. Mark the original FVG zone on your chart.
4. Monitor for price to revisit the zone from the other side.
5. Look for reaction + market structure shift on lower timeframes.
6. Enter trade with a clear stop loss just beyond the IFVG.
Entry Confluences:
- SMT divergence
- Order Block inside or near the IFVG
- Breaker Blocks
- Time of day (e.g., NY open)
---
Refined Entries & Risk Management
Once the IFVG is identified and price begins to react, refine entries using:
- Lower timeframe market structure shift
- Liquidity sweeps just before tapping the zone
- Candle closures showing rejection
Risk Management Tips:
- Set stop loss just beyond the IFVG opposite wick
- Use partials at 1:2 RR and scale out based on structure
- Don’t chase missed entries—wait for clean setups
---
Common Mistakes to Avoid
- Confusing IFVG with invalidated FVGs
- Trading them in low volume or choppy conditions
- Ignoring market context or structure shifts
- Blindly entering on first touch without confirmation
Tip: Let price prove the level—wait for reaction, not prediction.
---
Final Thoughts
IFVGs are an advanced but powerful tool when used with precision. They highlight how Smart Money uses inefficiencies in both directions, and when combined with other concepts, they can form sniper-like entries.
Practice finding IFVGs on historical charts. Combine them with SMT divergences, OBs, and market structure, and soon you’ll start seeing the market through Smart Money eyes.
Happy Trading!

How Momentum Divergence Reveals Hidden Market Strength and WeaknMost traders watch price action closely: candlesticks, moving averages, trendlines. But there’s a deeper, less obvious layer of information that often signals shifts in direction before price confirms it: momentum.
📌 Quick overview – what you'll learn:
What momentum divergence is (clearly explained)
How it helps predict potential trend shifts
Practical ways to spot and trade divergences
📈 Price vs Momentum: They're Not the Same!
Momentum doesn't simply track price direction. Instead, it measures the strength behind price movements.
Rising prices, falling momentum often signals upcoming bearish reversals.
Falling prices, rising momentum often hints at bullish reversals building beneath the surface.
These subtle divergences are powerful because they reveal hidden market shifts before everyone else notices them.
⚠️ How to Spot Momentum Divergence (Simple Steps):
Step-by-step:
- Find clear price swings:
Clearly defined highs/lows on your chart.
- Check momentum indicators (RSI, MACD, CCI, etc.):
Does the indicator agree or disagree with the price action?
- Spot divergence:
Bullish divergence: Price makes lower lows, indicator shows higher lows.
Bearish divergence: Price makes higher highs, indicator shows lower highs.
- Confirmation:
Always wait for price confirmation like a reversal candle or break of a trendline.
🔥 Why Momentum Divergence Works:
Divergence highlights hidden accumulation or distribution by smart money.
Helps you anticipate reversals before price confirms.
Filters out weak moves and helps you avoid fake breakouts.
📊 Real Example (XAUUSD – April 2025):
Recently in Gold:
Price was dropping steadily, reaching new lows.
Meanwhile, RSI showed clear higher lows – classic bullish divergence.
Result: Price exploded significantly shortly after momentum divergence appeared clearly.
🧠 Trading Tips to Remember:
Divergence signals are stronger near key support/resistance zones.
Use momentum divergence with your existing strategy for confirmation, not isolation.
Always define your risk clearly (set stops above/below recent highs/lows).
🚩 Common Pitfalls to Avoid:
Trading divergence without confirmation: always wait for the market to show its hand.
Ignoring the bigger picture: check higher timeframes for stronger signals.
Overtrading: not every divergence leads to a reversal; quality beats quantity.
🚀 Your Action Plan for Next Week:
Pick one momentum indicator and identify at least 3 divergences on your favorite assets.
Monitor how they play out.
Note down what works best in your trading journal.
💬 Question for you:
What’s your go-to momentum indicator when spotting divergence? RSI, MACD, CCI, or something else? Drop a comment below!
Happy trading!
TrendGo Team

Instructional for my brother. IThis is a bad swing trade, it is under the 180 day moving average. You wouldn't enter this using a swing trading system alone, its more advanced to identify. But you can see the yellow line I drew, that is strong resistance. That means the price don't want to go below that line.
I put what a trade would look like on it. You see how in this trade there is much more green than red? That is a good risk to reward ration.
Now here is CBOE. See how the green and red of this projected trade are nearly equal? Yeah, that is a bad risk to reward ration. At a 1:1 (that is for each dollar you can gain, you are risking) you are at a coin toss odds. Which is better than gambling but isn't trading.
You pretty much have the gist of Bravo simple trading, these are more advanced things. IF you are trading, you want to know where you will set your stop loss and where you will set your take profit BEFORE you buy anything. And then set those with the trade. That way you know beforehand what a worse case scenario looks like. If you do this, you will very likely succeed in the long run.

Learning The Excess Phase Peak Pattern : How To Identify/Use ItThis new tutorial video is for all the new followers I have on TradingView who don't understand the Excess Phase Peak pattern (EPP) yet.
I received a question from a new follower yesterday about the EPP patterns. He/She could not understand what they were or how to use/identify them.
This video should help you understand what the EPP patterns are, how to identify them, how to trade with them, and how to identify/use proper expectations with them.
I hope this video is informative and clear. Remember, price only does two things...
FLAG or TREND - NOTHING ELSE
And the EPP pattern is the CORE STRUCTURE of price that happens on all charts, all intervals, and all the time.
The second pattern, the Cradle pattern, is part of the EPP pattern, but it acts as another price construct related to how to identify opportunities in price action.
Get some.
#trading #research #investing #tradingalgos #tradingsignals #cycles #fibonacci #elliotwave #modelingsystems #stocks #bitcoin #btcusd #cryptos #spy #gold #nq #investing #trading #spytrading #spymarket #tradingmarket #stockmarket #silver

Learn These Patterns And You'll Never Regret ItEVERYTHING ON THE TRIANGLE PATTERN
a triangle chart pattern involves price moving into a tighter and tighter range (like a consolidation phase which has a triangle-like shape) as time goes by and provides a visual display of a battle between bulls and bears.
The triangle pattern is generally categorised as a “continuation pattern”, meaning that after the pattern completes, it’s assumed that the price will continue in the trend direction it was moving before the pattern appeared.
note: the triangle pattern depends on the trend however don't hold on to that thought since fake-outs are possible. the point i am trying to make is that you should not be obsessed with which direction the price goes, but you should be ready for movement in either direction.
there are three triangle patterns:
a) the ascending (upward slope consisting of higher-lows and a consistent resistance),
b) descending (downward slope consisting of lower-highs and a consistent support)
c) symmetrical (equal slopes the market is forming lower-highs and higher-lows)..
the triangle is different from a wedge. however, a wedge can be in a triangle or better put the general formation of a wedge is a triangle-like shape (in some cases).
point to note:
• you need at least two points (bullish or bearish) to connect for a triangle to be considered, and a consistent support or resistance.
• the volatility of price of any instrument decreases when there's a triangle pattern and increases on breakout of the pattern.
• measuring the size of the triangle can serve as a good profit target (will explain in meeting)
• keep an open mind at all times.
📝..

The Flag Chart Pattern ExplainedHello, traders! 👋🏻
If price action had a way of saying, “HOLD MY BEER, I’M NOT DONE YET,”— it would be through a flag pattern. This classic continuation setup is where strong trends take a breather before launching their next move. Whether you're seeing a bullish flag chart pattern or a bearish flag pattern, you’re looking at a market that’s just catching its breath before running again.
Let’s break down how this works and what to watch for!
What Is a Flag Pattern?
A flag pattern forms when the market makes a strong move (called the “flagpole”), then consolidates in a narrow, counter-trend range that looks like a flag. Eventually, the price breaks out in the direction of the original trend.
Think of it like a runner sprinting, slowing down to recover, and then taking off again. That pause? That’s your flag.
There Are Two Main Types:
🟢 Bull Flag Pattern (Bullish Flag Pattern)
It appears after a sharp upward move. The flag part slopes downward or moves sideways.
It also might signal a continuation of the bullish trend. This is the kind of setup that gets traders excited — it’s all about momentum.
🔴 Bear Flag Pattern (Bearish Flag Pattern)
It appears after a sharp downward move. The flag part slopes upward or consolidates sideways. It also might signal a continuation of the bearish trend. When the market pauses in a falling trend, the bear flag pattern warns that sellers are just regrouping before the next drop.
How to Recognize a Flag Chart Pattern
Spotting a Flag Trading Pattern Is Fairly Straightforward — Just Look For:
✔ A Strong Price Move (the Flagpole)
✔ A Tight Consolidation That Slopes Opposite the Trend
✔ Lower Volume During Consolidation
✔ A Breakout in the Direction of the Original Trend
📊 Real Example: BTC Flag Pattern in 2024
Take a look at the chart above. From October to March 2024, Bitcoin made a massive upward move from around $40,000 to $72,000+ — this was the flagpole.
Then, from March through November 2024, BTC entered a long, downward-sloping consolidation channel, forming the flag itself. Despite the lower highs and lower lows, the pullback was contained within parallel trend lines — a classic setup.
Once the price broke above the top of the flag, it kicked off a second leg, surging to a new all-time high above $108,000. That breakout confirmed the bullish flag pattern and rewarded traders who recognized the structure early.
This BTC move is a textbook example of how a bull flag chart pattern plays out in real markets — offering clean entry signals and strong momentum if the pattern completes.
There are variations, too — like the rising flag pattern, which can appear in both bullish and bearish conditions, depending on the context. Some traders even debate whether a flag pattern is a continuation or a subtle reversal flag pattern — so CONTEXT MATTERS.
Final Thoughts: Trust the Flag, Not the Noise
The flag chart pattern is a reminder that not every pullback means the trend is over. Sometimes, it’s just the market catching its breath. Whether you’re spotting a bull flag pattern in a crypto rally or a bear flag pattern in a downtrend, learning to trade these setups can possibly add precision to your strategy.
So, next time you see a price taking a nap in a narrow channel, ask yourself: Is this a bullish flag chart pattern gearing up for another leg up? Or is it a bearish flag pattern just waiting to drop the floor out? Let the structure tell the story and the trend do the rest.
This analysis is performed on historical data, does not relate to current market conditions, is for educational purposes only, and is not a trading recommendation.

Connecting Your Tickmill Account to TradingView: A Step-by-Step In this step-by-step guide, we’ll show you exactly how to connect your Tickmill account to TradingView in just a few seconds.
✅ Easy walkthrough
✅ Real-time trading from charts
✅ Tips for a smooth connection
Don’t forget to like, comment, and subscribe for more trading tutorials!
All Strategies Are Good; If Managed Properly!
~Richard Nasr

Examples of invalid setups | Judas Swing Strategy 07/04/2025As traders, it's crucial to spend time in the lab backtesting your strategy and exploring ways to optimize it for better performance in live markets. You’ll start to notice recurring patterns, some that work in your favor, and others that consistently lead to unnecessary losses. It might take time to spot these patterns and even longer to refine them to fit your trading system, but going through this process is what helps you evolve. In the long run, this is what you need to do to become a better trader.
We spent a considerable amount of time refining our entry technique for the Judas Swing strategy after noticing a recurring issue where entering with a limit order sometimes gets us stopped out on the very same candle. After testing a few alternative entry methods and making some key adjustments, we finally found an approach that worked consistently for us. On Monday, April 7th, 2025, this refinement proved its worth by saving us from two potentially painful losses. In this post, we’ll walk you through exactly what happened and how the improved entry made all the difference.
We got to our trading desks ready to scout for setups and were drawn to promising setups forming on both FX:AUDUSD and $NZDUSD. This was exciting since the previous week offered no solid trading opportunities. As price swept the liquidity resting above the highs of the zone our bias quickly shifted toward potential selling setups for the session. But before taking any trade, we always ensure every item on our entry checklist is met. Here’s what we look for:
1. A break of structure to the sell side
2. The formation of a Fair Value Gap (FVG)
3. A retracement into the FVG
4. Entry only after a confirmed candle close
With the first two requirements on our checklist confirmed, all that remained were the final two and at this stage, patience is key. As price began retracing toward the FVG on both FX:AUDUSD and OANDA:NZDUSD , things got interesting. Price came into the Fair Value Gap on both pairs, checking off the third requirement. Now, all that was left was to wait for the current candle to close.
But that’s where things will be clear to you now.
Had we jumped in early with a limit order, we would’ve been stopped out on the same candle. This moment served as a perfect reminder of why we now wait for a confirmed candle close before taking any trade. It’s this extra step that helps us avoid unnecessary losses and stick to high-quality setups.
This entry technique like any other, comes with its own set of pros and cons. At times a limit order might offer a more favorable entry price compared to waiting for a candle close and that can influence both your stop-loss and take-profit placements. On the flip side, there are also instances where waiting for the candle close gives you a better entry than the limit order would have. That’s why it’s so important to backtest.
Your job as a trader is to put in the time to study and test what works best for your system. We chose this candle close entry method because we did the work. After extensive backtesting and data analysis, we found this approach aligns best with the results we aim for in the long run.
