The End of Meme Coin Scams: A New UpdateWith the latest update, we are witnessing a shift in how meme coins operate in the crypto world, effectively putting an end to scams that have plagued the meme coin space.
Hello✌
Spend 3 minutes ⏰ reading this educational material. The main points are summarized in 3 clear lines at the end 📋 This will help you level up your understanding of the market 📊 and Bitcoin💰.
🎯 Analytical Insight on Bitcoin: A Personal Perspective:
Bitcoin is currently near a strong trendline and a solid daily support level. I’m expecting it to break the $90,000 mark, a key psychological level, within the next few days. My main target is at least a 7% increase, reaching $90,500.
📈
Now , let's dive into the educational section, which builds upon last week's lesson (linked in the tags of this analysis). Many of you have been eagerly waiting for this, as I have received multiple messages about it on Telegram.
A Recap of Meme Coin Creation and Scams
In a previous educational analysis, I walked you through the step-by-step process of how meme coins are created and, most importantly, how scammers often exploit these coins for personal gain. I explained the mechanics behind the manipulation of meme coins, where bad actors would create a coin, pump its price, and then abandon it once they made a profit, leaving countless investors in financial ruin.
The Hidden Aspect: How Creators Profited from Commissions
However, there was one critical aspect I did not discuss—how meme coin creators were profiting through transaction fees, also known as commissions. Prior to this update, many small-scale creators were incentivized to sell portions of their holdings at high prices, ensuring they made a profit, often at the cost of the coin's long-term stability. This led to price crashes, the collapse of the coin's market, and devastating losses for thousands of investors. 🚨
The Previous Model: 2 important platform one for creating the mem coin and second for transactions and fees
Under the previous system, meme coins were typically launched on platforms like P p .F n, which helped boost the coin’s liquidity through in-app promotions and social media outreach. This initial momentum would attract many investors, and then the coin would be listed on various exchanges for wider visibility.
To ensure that creators could continue to profit, the transactions would eventually shift to a new platform, which took all of the transaction fees, further enriching the platform but leaving creators with limited sustainable profits.
The New Update: Introducing new version for enring fees directly
With the latest update, the creator introduces a revolutionary feature. This addition fundamentally changes how meme coin creators can profit. Instead of relying on external platforms that take all the transaction fees, allows creators to receive a significant percentage of trading fees directly. This ensures that creators who are genuinely committed to the long-term success of their coin can continue to benefit from it without destroying the project once the coin gains traction.
A Sustainable Future for Meme Coins
This update paves the way for a new era where meme coins are not just tools for short-term profit but are sustainable and beneficial in the long run for both creators and investors. Creators who have the genuine intention to build and maintain their projects will now have the opportunity to continuously profit from them as the coin grows stronger and attracts more users. 🌱
Why This Matters for Investors
For investors, this is a game-changer. As meme coins become more reliable and profitable for creators, they also become safer and more promising for long-term investment. The more successful these meme coins become, the more lucrative it will be for investors in both the short and long term. 📈
By fostering a system that rewards creators based on the coin's success and longevity, this update helps eliminate the risk of sudden crashes. As a result, meme coins have the potential to evolve into solid, dependable projects rather than speculative assets that leave many in financial distress.
However , this analysis should be seen as a personal viewpoint, not as financial advice ⚠️. The crypto market carries high risks 📉, so always conduct your own research before making investment decisions. That being said, please take note of the disclaimer section at the bottom of each post for further details 📜✅.
🧨 Our team's main opinion is: 🧨
With the latest update, meme coin scams are effectively ending. creator website of meme coin now introduces new direct update for fees, which allows creators to earn a fair share of trading fees, ensuring they benefit long-term without abandoning the project. This makes meme coins more sustainable, rewarding both creators and investors. It’s a major shift towards stability and profitability in the meme coin space. 🚀
Give me some energy !!
✨We invest countless hours researching opportunities and crafting valuable ideas. Your support means the world to us! If you have any questions, feel free to drop them in the comment box.
Cheers, Mad Whale. 🐋
Chart Patterns

QE vs QT: The Invisible Force Behind Every Pump and Dump !Hello Traders 🐺
In this idea, I want to talk about macroeconomics and how QE and QT actually impact the economy and financial markets — and more importantly, how both pro traders and even non-professionals can benefit from understanding these basic concepts in their trading journey and even their everyday life.
So make sure to stick with me until the very end, because if you still don't know about these key metrics, this is going to be extremely helpful — and I promise I’ll keep it simple.
🔄 First... What Are QE and QT Anyway?
It’s simple:
QE (Quantitative Easing) = Pumping money into the system 💸
QT (Quantitative Tightening) = Sucking money out of the system 💀
That’s it.
The Fed either injects liquidity — or pulls it back.
And that liquidity is the real fuel of the market —
Not your RSI, not your fib levels, not your favorite influencer's altcoin pick.
🟩 What Is QE?
When the Fed wants to support the economy (like during a crash or recession), it prints money and buys government bonds, mortgage-backed securities, and more.
This increases liquidity → makes borrowing easier → and drives people toward risky assets like stocks and crypto.
✅ Benefits of QE:
Boosts markets (stocks, crypto, real estate — all of it)
Supports employment and economic growth
Weakens the dollar → makes exports stronger
❌ Downsides of QE:
Can lead to inflation or even hyperinflation if overused
Creates asset bubbles (aka pumps with no real fundamentals)
Weakens long-term purchasing power
In short:
QE = Bullish AF for markets — but dangerous if left unchecked.
🟥 What Is QT?
QT is the opposite.
When the economy overheats or inflation gets out of control, the Fed stops printing — and even starts removing liquidity from the system.
They let bonds expire or sell them off, reducing the amount of money circulating.
✅ Benefits of QT:
Helps bring inflation down
Cools off overheated markets
Restores balance after aggressive QE periods
❌ Downsides of QT:
Slows down the economy
Crashes risk assets (like BTC, tech stocks, etc.)
Can trigger a recession if done too fast or too long
QT = Bearish pressure for almost every chart you trade.
💡 Now that you understand QT and QE, let's talk about how we can use this in our trading.
To help you visualize it better, I’ve marked the QT and QE periods on the chart.
And as you’ll see, there’s a perfect correlation between Fed policy decisions and the BTC chart.
It almost looks like their policies decide exactly where and even when the tops and bottoms happen!
Let me explain it step by step — because while it might sound complicated, it’s actually very easy to understand:
📉 Example: The QT Period from 2017 to 2019
From October 2017 to September 2019, the Fed was in full QT mode — and we had three major phases in the market.
Phase 1:
When the Fed first announced QT, BTC was around a red monthly resistance line after a huge parabolic run-up.
Right after the announcement, BTC entered a sharp correction — all the way down to the monthly support.
(Shown with a red ellipse on the chart)
Phase 2:
BTC started to prepare for its next move — it accumulated below a bullish structure and slowly positioned itself for the next wave.
📉📈 Phase 3: The Big Corona Dump + QE Restart
Then came the third and most important phase of QT in the BTC chart:
The COVID crash — a sudden, brutal dump across all markets.
Sound familiar? Yeh, same pattern…
Immediately after the crash, the Fed announced QE and started pumping liquidity again → and we saw that huge parabolic run everyone remembers.
🔁 Now Here’s the Plot Twist... We’re Repeating the Same Pattern
Let’s break it down:
A huge crash after QT announcement (phase 1)
Market accumulation below a bullish structure (phase 2)
One final shakeout — just like the COVID dump — which I personally call Black Monday 2025 👀
And now… the Fed has hinted that they're ready to step in to stabilize the markets if needed ( phase three )
Guess what? Another round of QE could be coming...
In this idea, I tried to explain how QE and QT work — and show you the hidden forces behind every bull and bear cycle.
If you enjoyed this, make sure to follow and stay tuned for more.
And as always, never forget our rule:
🐺 Discipline is rarely enjoyable, but almost always profitable 🐺
🐺 KIU_COIN 🐺

Inversion Fair Value Gaps (IFVGs) - A Deep Dive Trading GuideIntroduction
Inversion Fair Value Gaps (IFVGs) are an advanced price action concept rooted in Smart Money theory. Unlike standard Fair Value Gaps (FVGs), IFVGs consider the idea of price revisiting inefficiencies from an inverse perspective. When price "respects" a previously violated gap from the opposite side, it creates a powerful confluence for entries or exits.
This guide will cover:
- What an IFVG is
- How it differs from traditional FVGs
- Market context for IFVG setups
- How to trade them effectively
- Real chart examples for clarity
---
What is an IFVG?
An Inversion Fair Value Gap (IFVG) occurs when price trades through a traditional Fair Value Gap and later returns to that area, but instead of continuing in the original direction, it uses the gap as a support or resistance from the other side.
Standard FVG vs. IFVG:
- FVG: Price creates a gap (imbalance), and we expect a return to the gap for mitigation.
- IFVG: Price violates the FVG, but instead of invalidation, it respects it from the other side.
Example Logic: A bullish FVG is formed -> price trades through it -> later, price revisits the FVG from below and uses it as resistance.
---
Structure and Market Context
Understanding structure is key when trading IFVGs. Price must break structure convincingly through a Fair Value Gap. The gap then acts as an inversion zone for future reactions.
Ideal Market Conditions for IFVGs:
1. Market is trending or has recently had a strong impulsive move.
2. A Fair Value Gap is created and violated with displacement .
3. Price retraces back to the FVG from the opposite side .
4. The gap holds as support/resistance, indicating smart money has respected the zone.
---
Types of IFVGs
1. Bullish IFVG: Price trades up through a bearish FVG and later uses it as support.
2. Bearish IFVG: Price trades down through a bullish FVG and later uses it as resistance.
Note: The best IFVGs are often aligned with Order Blocks, liquidity levels, or SMT divergences.
---
How to Trade IFVGs
1. Identify a clear Fair Value Gap in a trending market.
2. Wait for price to break through the FVG with momentum .
3. Mark the original FVG zone on your chart.
4. Monitor for price to revisit the zone from the other side.
5. Look for reaction + market structure shift on lower timeframes.
6. Enter trade with a clear stop loss just beyond the IFVG.
Entry Confluences:
- SMT divergence
- Order Block inside or near the IFVG
- Breaker Blocks
- Time of day (e.g., NY open)
---
Refined Entries & Risk Management
Once the IFVG is identified and price begins to react, refine entries using:
- Lower timeframe market structure shift
- Liquidity sweeps just before tapping the zone
- Candle closures showing rejection
Risk Management Tips:
- Set stop loss just beyond the IFVG opposite wick
- Use partials at 1:2 RR and scale out based on structure
- Don’t chase missed entries—wait for clean setups
---
Common Mistakes to Avoid
- Confusing IFVG with invalidated FVGs
- Trading them in low volume or choppy conditions
- Ignoring market context or structure shifts
- Blindly entering on first touch without confirmation
Tip: Let price prove the level—wait for reaction, not prediction.
---
Final Thoughts
IFVGs are an advanced but powerful tool when used with precision. They highlight how Smart Money uses inefficiencies in both directions, and when combined with other concepts, they can form sniper-like entries.
Practice finding IFVGs on historical charts. Combine them with SMT divergences, OBs, and market structure, and soon you’ll start seeing the market through Smart Money eyes.
Happy Trading!

How Momentum Divergence Reveals Hidden Market Strength and WeaknMost traders watch price action closely: candlesticks, moving averages, trendlines. But there’s a deeper, less obvious layer of information that often signals shifts in direction before price confirms it: momentum.
📌 Quick overview – what you'll learn:
What momentum divergence is (clearly explained)
How it helps predict potential trend shifts
Practical ways to spot and trade divergences
📈 Price vs Momentum: They're Not the Same!
Momentum doesn't simply track price direction. Instead, it measures the strength behind price movements.
Rising prices, falling momentum often signals upcoming bearish reversals.
Falling prices, rising momentum often hints at bullish reversals building beneath the surface.
These subtle divergences are powerful because they reveal hidden market shifts before everyone else notices them.
⚠️ How to Spot Momentum Divergence (Simple Steps):
Step-by-step:
- Find clear price swings:
Clearly defined highs/lows on your chart.
- Check momentum indicators (RSI, MACD, CCI, etc.):
Does the indicator agree or disagree with the price action?
- Spot divergence:
Bullish divergence: Price makes lower lows, indicator shows higher lows.
Bearish divergence: Price makes higher highs, indicator shows lower highs.
- Confirmation:
Always wait for price confirmation like a reversal candle or break of a trendline.
🔥 Why Momentum Divergence Works:
Divergence highlights hidden accumulation or distribution by smart money.
Helps you anticipate reversals before price confirms.
Filters out weak moves and helps you avoid fake breakouts.
📊 Real Example (XAUUSD – April 2025):
Recently in Gold:
Price was dropping steadily, reaching new lows.
Meanwhile, RSI showed clear higher lows – classic bullish divergence.
Result: Price exploded significantly shortly after momentum divergence appeared clearly.
🧠 Trading Tips to Remember:
Divergence signals are stronger near key support/resistance zones.
Use momentum divergence with your existing strategy for confirmation, not isolation.
Always define your risk clearly (set stops above/below recent highs/lows).
🚩 Common Pitfalls to Avoid:
Trading divergence without confirmation: always wait for the market to show its hand.
Ignoring the bigger picture: check higher timeframes for stronger signals.
Overtrading: not every divergence leads to a reversal; quality beats quantity.
🚀 Your Action Plan for Next Week:
Pick one momentum indicator and identify at least 3 divergences on your favorite assets.
Monitor how they play out.
Note down what works best in your trading journal.
💬 Question for you:
What’s your go-to momentum indicator when spotting divergence? RSI, MACD, CCI, or something else? Drop a comment below!
Happy trading!
TrendGo Team

Instructional for my brother. IThis is a bad swing trade, it is under the 180 day moving average. You wouldn't enter this using a swing trading system alone, its more advanced to identify. But you can see the yellow line I drew, that is strong resistance. That means the price don't want to go below that line.
I put what a trade would look like on it. You see how in this trade there is much more green than red? That is a good risk to reward ration.
Now here is CBOE. See how the green and red of this projected trade are nearly equal? Yeah, that is a bad risk to reward ration. At a 1:1 (that is for each dollar you can gain, you are risking) you are at a coin toss odds. Which is better than gambling but isn't trading.
You pretty much have the gist of Bravo simple trading, these are more advanced things. IF you are trading, you want to know where you will set your stop loss and where you will set your take profit BEFORE you buy anything. And then set those with the trade. That way you know beforehand what a worse case scenario looks like. If you do this, you will very likely succeed in the long run.

Learning The Excess Phase Peak Pattern : How To Identify/Use ItThis new tutorial video is for all the new followers I have on TradingView who don't understand the Excess Phase Peak pattern (EPP) yet.
I received a question from a new follower yesterday about the EPP patterns. He/She could not understand what they were or how to use/identify them.
This video should help you understand what the EPP patterns are, how to identify them, how to trade with them, and how to identify/use proper expectations with them.
I hope this video is informative and clear. Remember, price only does two things...
FLAG or TREND - NOTHING ELSE
And the EPP pattern is the CORE STRUCTURE of price that happens on all charts, all intervals, and all the time.
The second pattern, the Cradle pattern, is part of the EPP pattern, but it acts as another price construct related to how to identify opportunities in price action.
Get some.
#trading #research #investing #tradingalgos #tradingsignals #cycles #fibonacci #elliotwave #modelingsystems #stocks #bitcoin #btcusd #cryptos #spy #gold #nq #investing #trading #spytrading #spymarket #tradingmarket #stockmarket #silver

Learn These Patterns And You'll Never Regret ItEVERYTHING ON THE TRIANGLE PATTERN
a triangle chart pattern involves price moving into a tighter and tighter range (like a consolidation phase which has a triangle-like shape) as time goes by and provides a visual display of a battle between bulls and bears.
The triangle pattern is generally categorised as a “continuation pattern”, meaning that after the pattern completes, it’s assumed that the price will continue in the trend direction it was moving before the pattern appeared.
note: the triangle pattern depends on the trend however don't hold on to that thought since fake-outs are possible. the point i am trying to make is that you should not be obsessed with which direction the price goes, but you should be ready for movement in either direction.
there are three triangle patterns:
a) the ascending (upward slope consisting of higher-lows and a consistent resistance),
b) descending (downward slope consisting of lower-highs and a consistent support)
c) symmetrical (equal slopes the market is forming lower-highs and higher-lows)..
the triangle is different from a wedge. however, a wedge can be in a triangle or better put the general formation of a wedge is a triangle-like shape (in some cases).
point to note:
• you need at least two points (bullish or bearish) to connect for a triangle to be considered, and a consistent support or resistance.
• the volatility of price of any instrument decreases when there's a triangle pattern and increases on breakout of the pattern.
• measuring the size of the triangle can serve as a good profit target (will explain in meeting)
• keep an open mind at all times.
📝..

The Flag Chart Pattern ExplainedHello, traders! 👋🏻
If price action had a way of saying, “HOLD MY BEER, I’M NOT DONE YET,”— it would be through a flag pattern. This classic continuation setup is where strong trends take a breather before launching their next move. Whether you're seeing a bullish flag chart pattern or a bearish flag pattern, you’re looking at a market that’s just catching its breath before running again.
Let’s break down how this works and what to watch for!
What Is a Flag Pattern?
A flag pattern forms when the market makes a strong move (called the “flagpole”), then consolidates in a narrow, counter-trend range that looks like a flag. Eventually, the price breaks out in the direction of the original trend.
Think of it like a runner sprinting, slowing down to recover, and then taking off again. That pause? That’s your flag.
There Are Two Main Types:
🟢 Bull Flag Pattern (Bullish Flag Pattern)
It appears after a sharp upward move. The flag part slopes downward or moves sideways.
It also might signal a continuation of the bullish trend. This is the kind of setup that gets traders excited — it’s all about momentum.
🔴 Bear Flag Pattern (Bearish Flag Pattern)
It appears after a sharp downward move. The flag part slopes upward or consolidates sideways. It also might signal a continuation of the bearish trend. When the market pauses in a falling trend, the bear flag pattern warns that sellers are just regrouping before the next drop.
How to Recognize a Flag Chart Pattern
Spotting a Flag Trading Pattern Is Fairly Straightforward — Just Look For:
✔ A Strong Price Move (the Flagpole)
✔ A Tight Consolidation That Slopes Opposite the Trend
✔ Lower Volume During Consolidation
✔ A Breakout in the Direction of the Original Trend
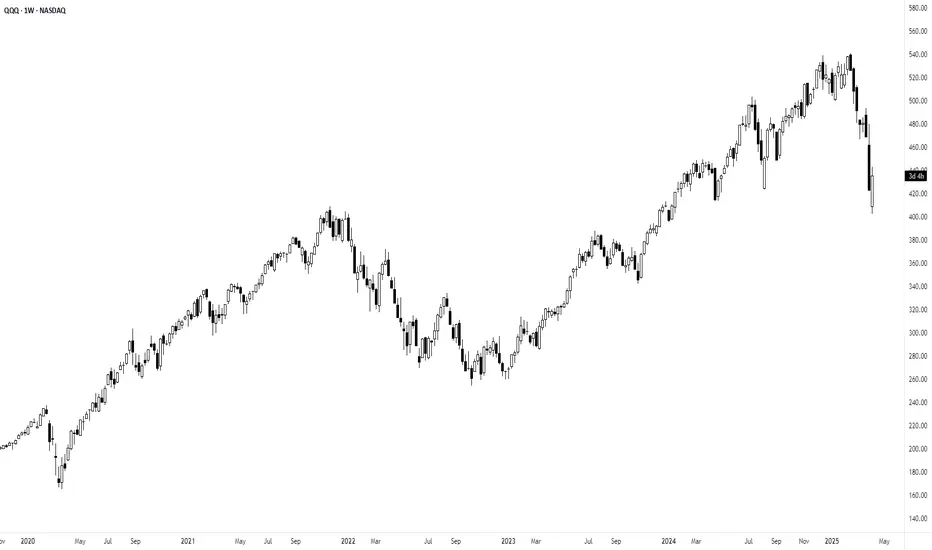
📊 Real Example: BTC Flag Pattern in 2024
Take a look at the chart above. From October to March 2024, Bitcoin made a massive upward move from around $40,000 to $72,000+ — this was the flagpole.
Then, from March through November 2024, BTC entered a long, downward-sloping consolidation channel, forming the flag itself. Despite the lower highs and lower lows, the pullback was contained within parallel trend lines — a classic setup.
Once the price broke above the top of the flag, it kicked off a second leg, surging to a new all-time high above $108,000. That breakout confirmed the bullish flag pattern and rewarded traders who recognized the structure early.
This BTC move is a textbook example of how a bull flag chart pattern plays out in real markets — offering clean entry signals and strong momentum if the pattern completes.
There are variations, too — like the rising flag pattern, which can appear in both bullish and bearish conditions, depending on the context. Some traders even debate whether a flag pattern is a continuation or a subtle reversal flag pattern — so CONTEXT MATTERS.
Final Thoughts: Trust the Flag, Not the Noise
The flag chart pattern is a reminder that not every pullback means the trend is over. Sometimes, it’s just the market catching its breath. Whether you’re spotting a bull flag pattern in a crypto rally or a bear flag pattern in a downtrend, learning to trade these setups can possibly add precision to your strategy.
So, next time you see a price taking a nap in a narrow channel, ask yourself: Is this a bullish flag chart pattern gearing up for another leg up? Or is it a bearish flag pattern just waiting to drop the floor out? Let the structure tell the story and the trend do the rest.
This analysis is performed on historical data, does not relate to current market conditions, is for educational purposes only, and is not a trading recommendation.

Connecting Your Tickmill Account to TradingView: A Step-by-Step In this step-by-step guide, we’ll show you exactly how to connect your Tickmill account to TradingView in just a few seconds.
✅ Easy walkthrough
✅ Real-time trading from charts
✅ Tips for a smooth connection
Don’t forget to like, comment, and subscribe for more trading tutorials!
All Strategies Are Good; If Managed Properly!
~Richard Nasr

Examples of invalid setups | Judas Swing Strategy 07/04/2025As traders, it's crucial to spend time in the lab backtesting your strategy and exploring ways to optimize it for better performance in live markets. You’ll start to notice recurring patterns, some that work in your favor, and others that consistently lead to unnecessary losses. It might take time to spot these patterns and even longer to refine them to fit your trading system, but going through this process is what helps you evolve. In the long run, this is what you need to do to become a better trader.
We spent a considerable amount of time refining our entry technique for the Judas Swing strategy after noticing a recurring issue where entering with a limit order sometimes gets us stopped out on the very same candle. After testing a few alternative entry methods and making some key adjustments, we finally found an approach that worked consistently for us. On Monday, April 7th, 2025, this refinement proved its worth by saving us from two potentially painful losses. In this post, we’ll walk you through exactly what happened and how the improved entry made all the difference.
We got to our trading desks ready to scout for setups and were drawn to promising setups forming on both FX:AUDUSD and $NZDUSD. This was exciting since the previous week offered no solid trading opportunities. As price swept the liquidity resting above the highs of the zone our bias quickly shifted toward potential selling setups for the session. But before taking any trade, we always ensure every item on our entry checklist is met. Here’s what we look for:
1. A break of structure to the sell side
2. The formation of a Fair Value Gap (FVG)
3. A retracement into the FVG
4. Entry only after a confirmed candle close
With the first two requirements on our checklist confirmed, all that remained were the final two and at this stage, patience is key. As price began retracing toward the FVG on both FX:AUDUSD and OANDA:NZDUSD , things got interesting. Price came into the Fair Value Gap on both pairs, checking off the third requirement. Now, all that was left was to wait for the current candle to close.
But that’s where things will be clear to you now.
Had we jumped in early with a limit order, we would’ve been stopped out on the same candle. This moment served as a perfect reminder of why we now wait for a confirmed candle close before taking any trade. It’s this extra step that helps us avoid unnecessary losses and stick to high-quality setups.
This entry technique like any other, comes with its own set of pros and cons. At times a limit order might offer a more favorable entry price compared to waiting for a candle close and that can influence both your stop-loss and take-profit placements. On the flip side, there are also instances where waiting for the candle close gives you a better entry than the limit order would have. That’s why it’s so important to backtest.
Your job as a trader is to put in the time to study and test what works best for your system. We chose this candle close entry method because we did the work. After extensive backtesting and data analysis, we found this approach aligns best with the results we aim for in the long run.

Falling Wedge Trading Pattern: Unique Features and Trading RulesFalling Wedge Trading Pattern: Unique Features and Trading Rules
Various chart patterns give an indication of possible market direction. A falling wedge is one such formation that indicates a possible bullish reversal. This FXOpen article will help you understand whether the falling wedge pattern is bullish or bearish, what its formation signifies about the market direction, and how it can be used to spot trading opportunities.
What Is a Falling Wedge Pattern?
Also known as the descending wedge, the falling wedge technical analysis chart pattern is a bullish formation that typically occurs in the downtrend and signals a trend reversal. It forms when an asset's price drops, but the range of price movements starts to get narrower. As the formation contracts towards the end, the buyers completely absorb the selling pressure and consolidate their energy before beginning to push the market higher. A falling wedge pattern means the end of a market correction and an upside reversal.
How Can You Spot a Falling Wedge on a Price Chart?
This pattern is usually spotted in a downtrend, which would indicate a possible bullish reversal. However, it may appear in an uptrend and signal a trend continuation after a market correction. Either way, the falling wedge provides bullish signals. The descending formation generally has the following features.
- Price Action. The price trades lower, forming lower highs and lower lows.
- Trendlines. Traders draw two trendlines. One connects the lower highs, and the other connects the lower lows. Finally, they intersect towards a convergence point. Each line should connect at least two points. However, the greater the number, the higher the chance of the market reversal.
- Contraction. The contraction in the price range signals decreasing volatility in the market. As the formation matures, new lows contract as the selling pressure decreases. Thus, the lower trendline acts as support, and the price consolidating within the narrowing range creates a coiled spring effect, finally leading to a sharp move on the upside. The price breaks through the upper trendline resistance, indicating that sellers are losing control and buyers are gaining momentum, resulting in an upward move.
- Volume. The trading volume ideally decreases as the pattern forms, and the buying volume increases with the breakout above the upper trendline, reflecting a shift in momentum towards the buyers.
Falling and Rising Wedge: Differences
There are two types of wedge formation – rising (ascending) and falling (descending).
An ascending wedge occurs when the highs and lows rise, while a descending wedge pattern has lower highs and lows. In an ascending formation, the slope of the lows is steeper and converges with the upper trendline at some point, while in a descending formation, the slope of the highs is steeper and converges with the support trendline at some point.
Usually, a rising wedge indicates that sellers are taking control, resulting in a downside breakdown. Conversely, a descending wedge pattern indicates that buyers are gaining momentum after consolidation, generally resulting in an upside breakout.
The Falling Wedge: Trading Rules
Trading the falling wedge involves waiting for the price to break above the upper line, typically considered a bullish reversal. The pattern’s conformity increases when it is combined with other technical indicators.
- Entry
According to theory, the ideal entry point is after the price has broken above the wedge’s upper boundary, indicating a potential upside reversal. Furthermore, this descending wedge breakout should be accompanied by an increase in trading volume to confirm the validity of the signal.
The price may retest the resistance level before continuing its upward movement, providing another opportunity to enter a long position. However, the entry point should be based on the traders' risk management plan and trading strategy.
- Take Profit
It is essential to determine an appropriate target level. Traders typically set a profit target by measuring the height of the widest part of the formation and adding it to the breakout point. Another approach some traders use is to look for significant resistance levels above the breakout point, such as previous swing highs.
- Stop Loss
Traders typically place their stop-loss orders just below the lower boundary of the wedge. Also, the stop-loss level can be based on technical or psychological support levels, such as previous swing lows. In addition, the stop-loss level should be set according to the trader's risk tolerance and overall trading strategy.
Trading Example
In the chart above, there is a falling wedge. A trader opened a buy position on the close of the breakout candlestick. A stop loss was placed below the wedge’s lower boundary, while the take-profit target was equal to the pattern’s widest part.
Falling Wedge and Other Patterns
Here are chart patterns that can be confused with a falling wedge.
Falling Wedge vs Bullish Flag
These are two distinct chart formations used to identify potential buying opportunities in the market, but there are some differences between the two.
A descending wedge is a bullish setup, forming in a downtrend. It is characterised by two converging trendlines that slope downward, signalling decreasing selling pressure. A breakout above the upper trendline suggests a bullish move.
A bullish flag appears after a strong upward movement and forms a rectangular shape with parallel trendlines that slope slightly downward or move sideways. This formation represents a brief consolidation before the market resumes its upward trajectory.
While the falling wedge indicates a potential shift in a downtrend, the bullish flag suggests a continuation of an uptrend.
Falling Wedge vs Bearish Pennant
The falling wedge features two converging trendlines that slope downward, indicating decreasing selling pressure and often signalling a bullish reversal when the price breaks above the upper trendline.
Conversely, the bearish pennant forms after a significant downward movement and is characterised by converging trendlines that create a small symmetrical triangle. This pattern represents a consolidation phase before the market continues its downward trend upon breaking below the lower trendline.
While the falling wedge suggests a potential bullish move, the bearish pennant indicates a continuation of the bearish trend.
Falling Wedge vs Descending Triangle
The falling wedge consists of two downward-sloping converging trendlines, indicating decreasing selling pressure and often signalling a bullish reversal when the price breaks above the upper trendline. In contrast, the descending triangle features a flat lower trendline and a downward-sloping upper trendline, suggesting a buildup of selling pressure and typically signalling a bearish continuation when the price breaks below the flat lower trendline.
While the falling wedge is associated with a potential bullish move, the descending triangle generally indicates a bearish trend.
Falling Wedge: Advantages and Limitations
Like any technical pattern, the falling wedge has both limitations and advantages.
Advantages
- High Probability of a Reversal. The falling wedge is often seen as a strong, bullish signal, especially when it occurs after a downtrend. It suggests that selling pressure is subsiding, and a reversal to the upside may be imminent.
- Clear Entry and Exit Points. The pattern provides clear points for entering and exiting trades. Traders often enter when the price breaks out above the upper trendline and set stop-loss orders below a recent low within the formation.
- Versatility. The wedge can be used in various market conditions. It is effective in both continuation and reversal scenarios, though it is more commonly associated with bullish reversals.
- Widely Recognised. Since the falling wedge is a well-known formation, it is often self-fulfilling to some extent, as many traders recognise and act on it, further driving the market.
Limitations
- False Breakouts. Like many chart patterns, the falling wedge is prone to false breakouts. Prices may briefly move above the resistance line but then fall back below, trapping traders.
- Dependence on Market Context. The effectiveness of the falling wedge can vary depending on broader market conditions. In a strong downtrend, it might fail to result in a significant reversal.
- Requires Confirmation. The wedge should be confirmed with other technical indicators or analysis tools, such as volumes or moving averages, to increase the likelihood of an effective trade. Relying solely on the falling wedge can be risky.
- Limited Use in Low-Volatility Markets. In markets with low volatility, the falling wedge may not be as reliable, as price movements might not be strong enough to confirm the falling wedge's breakout.
The Bottom Line
The falling wedge is a powerful chart pattern that can offer valuable insights into potential trend reversals or continuations, depending on its context within the broader market. By understanding and effectively utilising the falling wedge in your strategy, you can enhance your ability to identify many trading opportunities. As with all trading tools, combining it with a comprehensive trading plan and proper risk management is crucial.
FAQ
Is a Falling Wedge Bullish?
Yes, the falling wedge is a bullish continuation pattern in an uptrend, and it acts as a bullish reversal formation in a bearish market.
What Does a Falling Wedge Pattern Indicate?
It indicates that the buyers are absorbing the selling pressure, which is reflected in the narrower price range and finally results in an upside breakout.
What Is the Falling Wedge Pattern Rule?
The falling wedge is a technical analysis formation that occurs when the price forms lower highs and lower lows within converging trendlines, sloping downward. Its rule is that a breakout above the upper trendline signals a potential reversal to the upside, often indicating the end of a downtrend or the continuation of a strong uptrend.
How to Trade Descending Wedge Patterns?
To trade descending wedges, traders first identify them by ensuring that the price is making lower highs and lows within converging trendlines. Then, they wait for the price to break out above the upper trendline, ideally accompanied by increased trading volume, which confirms the breakout. After the breakout, a common approach is to enter a long position, aiming to take advantage of the anticipated upward movement.
What Is the Target of the Descending Wedge Pattern?
The target for a descending wedge is typically set by measuring the maximum width of the wedge at its widest part and projecting that distance upwards from the breakout point. This projection gives a potential price target.
What Is the Entry Point for a Falling Wedge?
The entry point for a falling wedge is ideally just after the breakout above the upper trendline. Some traders prefer to wait for a retest of the broken trendline, which may act as a new support level, before entering a trade to confirm the breakout.
*Important: At FXOpen UK, Cryptocurrency trading via CFDs is only available to our Professional clients. They are not available for trading by Retail clients. To find out more information about how this may affect you, please get in touch with our team.
This article represents the opinion of the Companies operating under the FXOpen brand only. It is not to be construed as an offer, solicitation, or recommendation with respect to products and services provided by the Companies operating under the FXOpen brand, nor is it to be considered financial advice.

Why you should WAIT for trades to come to YOU!In this video, we dive deep into one of the most underrated but powerful habits that separates consistently profitable traders from the rest: waiting for the trade to come to you.
It sounds simple, even obvious. But in reality, most traders—especially newer ones—feel the constant urge to do something. They scan for setups all day, jump in at the first sign of movement, and confuse activity with progress. That mindset usually leads to emotional trading, overtrading, and eventually burnout.
If you've ever felt the pressure to chase price, force trades, or trade just because you're bored… this video is for you.
I’ll walk you through:
1. Why chasing trades destroys your edge—even when the setup “kind of” looks right
2. How waiting allows you to trade from a position of strength, not desperation
3. The psychological shift that happens when you stop trading to feel busy and start trading to feel precise
4. How the pros use waiting as a weapon, not a weakness
The truth is, trading is a game of probabilities and precision. And that means you don’t need 10 trades a day—you need a few good ones a week that truly align with your plan.
Patience doesn’t mean doing nothing, it means doing the right thing at the right time. And when you develop the skill to sit back, trust your process, and wait for price to come to your level… everything changes. Your confidence grows. Your equity curve smooths out. And most importantly, your decision-making gets sharper.
So if you're tired of overtrading, feeling frustrated, or constantly second-guessing your entries—take a breath, slow it down, and start thinking like a sniper instead of a machine gun.
Let the market come to you. That’s where the real edge is.

Trump's Tariff Wars : Why It Is Critical To Address Global TradeThis video, a continuation of the Trump's Tariff Wars video I created last week, tries to show you why it is critically important that we, as a nation, address the gross imbalances related to US trade to global markets that are resulting in a $1.5-$1.8 TRILLION deficit every fiscal year.
There has been almost NOTHING done about this since Trump's last term as President.
Our politicians are happy to spend - spend - spend - but none of them are worries about the long-term fiscal health of the US. (Well, some of them are worried about it - but the others seem to be completely ignorant of the risks related to the US).
Trump is raising this issue very early into his second term as president to protect ALL AMERICANS. He is trying to bring the issue into the news to highlight the imbalances related to US trade throughout the world.
When some other nation is taking $300B a year from the us with an unfair tariff rate - guess what, we need to make that known to the American consumer because we are the ones that continue to pay that nation the EXTRA every year.
Do you want to keep paying these other nations a grossly inefficient amount for cheap trinkets, or do you want our politicians and leaders to take steps to balance the trade deficits more efficiently so we don't pass on incredible debt levels to our children and grandchildren?
So many people simply don't understand what is at risk.
Short-term - the pain may seem excessive, but it may only last 30, 60, 90 days.
Long-term - if we don't address this issue and resolve it by negotiating better trade rates, this issue will destroy the strength of the US economy, US Dollar, and your children's future.
Simply put, we can't keep going into debt without a plan to attempt to grow our GDP.
The solution to this imbalance is to grow our economy and to raise taxes on the uber-wealthy.
We have to grow our revenues and rebalance our global trade in an effort to support the growth of the US economy.
And, our politicians (till now) have been more than happy to ignore this issue and hide it from the American people. They simply didn't care to discuss it or deal with it.
Trump brought this to the table because it is important.
I hope you now see HOW important it really is.
Get some.
#trading #research #investing #tradingalgos #tradingsignals #cycles #fibonacci #elliotwave #modelingsystems #stocks #bitcoin #btcusd #cryptos #spy #gold #nq #investing #trading #spytrading #spymarket #tradingmarket #stockmarket #silver

Learn 3 Best Time Frames for Day Trading Forex & Gold
If you want to day trade Forex & Gold, but you don't know what time frames you should use for chart analysis and trade execution, don't worry.
In this article, I prepared for you the list of best time frames for intraday trading and proven combinations for multiple time frame analysis.
For day trading forex with multiple time frame analysis, I recommend using these 3 time frames: daily, 1 hour, 30 minutes.
Daily Time Frame Analysis
The main time frame for day trading Forex is the daily.
It will be applied for the identification of significant support and resistance levels and the market trend.
You should find at least 2 supports that are below current prices and 2 resistances above.
In a bullish trend, supports will be applied for trend-following trading, the resistances - for trading against the trend.
That's the example of a proper daily time frame analysis on GBPCHF for day trading.
The pair is in an uptrend and 4 significant historic structures are underlined.
In a downtrend, a short from resistance will be a daytrade with the trend while a long from support will be against.
Look at GBPAUD. The market is bearish, and a structure analysis is executed.
Identified supports and resistances will provide the zones to trade from. You should let the price reach one of these areas and start analyzing lower time frames then.
Remember that counter trend trading setups always have lower accuracy and a profit potential. Your ability to properly recognize the market direction and the point that you are planning to open a position from will help you to correctly assess the winning chances and risks.
1H/30M Time Frames Analysis
These 2 time frames will be used for confirmations and entries.
What exactly should you look for?
It strictly depends on the rules of your strategy and trading style.
After a test of a resistance, one should wait for a clear sign of strength of the sellers : it can be based on technical indicators, candlestick, chart pattern, or something else.
For my day trading strategy, I prefer a price action based confirmation.
I wait for a formation of a bearish price action pattern on a resistance.
Look at GBPJPY on a daily. Being in an uptrend, the price is approaching a key resistance. From that, one can look for a day trade .
In that case, a price action signal is a double top pattern on 1H t.f and a violation of its neckline. That provides a nice confirmation to open a counter trend short trade.
Look at this retracement that followed then.
In this situation, there was no need to open 30 minutes chart because a signal was spotted on 1H.
I will show you when one should apply this t.f in another setup.
Once the price is on a key daily support, start looking for a bullish signal.
For me, it will be a bullish price action pattern.
USDCAD is in a strong bullish trend. The price tests a key support.
It can be a nice area for a day trade.
Opening an hourly chart, we can see no bullish pattern.
If so, open even lower time frame, quite often it will reveal hidden confirmations.
A bullish formation appeared on 30 minutes chart - a cup & handle.
Violation of its neckline is a strong day trading long signal.
Look how rapidly the price started to grow then.
In order to profitably day trade Forex, a single time frame analysis is not enough . Incorporation of 3 time frames: one daily and two intraday will help you to identify trading opportunities from safe places with the maximum reward potential.
❤️Please, support my work with like, thank you!❤️
I am part of Trade Nation's Influencer program and receive a monthly fee for using their TradingView charts in my analysis.

How to Build a Super Pitchfork with Reaction & Trigger LinesIn this educational video tutorial, I guide you through the process of setting up a Super Pitchfork using the Bitcoin daily chart. This method is inspired by Patrick Mikula’s work in " The Best Trendline Methods of Alan Andrews. "
I demonstrate how to:
- Create and project reaction lines
- Generate bullish and bearish trigger lines
- Apply a personal timing technique for pitchforks based on Michael Jenkins’ methods by squaring significant pivots to the median line, reaction lines, and upper parallel to produce time-based reaction points anticipating potential market turns.
This walkthrough is for traders who already have a foundational understanding of pitchforks.
Inspired by the work of Patrick Mikula, this is how I personally apply and expand on the Super Pitchfork method in my own charting.

Ultimate Guide to Smart Money ConceptsWhat Are Smart Money Concepts?
Introduction:
If you’ve been trading for a while, you’ve probably noticed that sometimes the market moves in ways that just don’t make sense. You’ve got your technical analysis all set, but the market seems to go in the opposite direction. That’s where Smart Money Concepts (SMC) come in.
At its core, SMC is all about understanding how big players in the market (think hedge funds, institutions, and banks) move prices. These players have massive amounts of capital and information, and they don’t trade like the average retail trader. Understanding their behavior can help you see where the market is going next before it happens.
What is Smart Money?
In the world of trading, smart money refers to the institutional investors who move markets with their huge orders. Unlike retail traders, who might be relying on indicators or patterns, smart money trades based on liquidity, market structure, and order flow.
While retail traders are typically reacting to price movements, smart money is the one causing those moves. They’re out there seeking out places where they can accumulate positions or distribute them. The tricky part is that they’ll often make the market go in one direction just to trap retail traders and get them to take positions before flipping it back to where they wanted it to go in the first place.
Key Concepts in Smart Money Trading
1. Market Structure
Market structure refers to the way price moves in a trend. It’s essentially a pattern of higher highs and higher lows for an uptrend, or lower highs and lower lows for a downtrend.
Smart money uses these patterns to their advantage. When they see the market creating a series of higher highs and higher lows, they’ll take advantage of that momentum to push prices further, knowing retail traders will follow along.
But when they want to reverse the market, they’ll push it in the opposite direction, creating a market structure shift or a break of structure, which signals that the trend is over and a new one is starting.
2. Liquidity
Liquidity refers to the amount of orders available to be filled at different price levels. Smart money knows exactly where retail traders are likely to place their stops or buy orders.
They’ll often push the price to these levels, triggering those stops and collecting the liquidity. Once that liquidity is grabbed, they’ll reverse the price and move it in the intended direction.
A common way to spot liquidity is by looking for equal highs or equal lows, where traders often place their stop-loss orders. These are often areas smart money will target.
3. Order Blocks
Order blocks are areas on the chart where institutions have placed big orders. These are key levels that represent where price might return to later, and they can act as areas of support or resistance.
Order blocks are usually found after big price moves. Institutions place these orders to either accumulate positions or offload them, and price often comes back to these levels to fill orders that were left behind.
4. Fair Value Gaps (FVG)
Fair value gaps, or imbalances, are price areas where the market moves quickly, leaving gaps between candlesticks. These gaps represent areas where the market has moved too fast for regular orders to fill, and price tends to return to these levels to fill the gaps.
Smart money knows that these imbalances are critical areas for future price action, and they’ll use them to re-enter the market after a move has been completed.
Why Does Smart Money Matter?
Understanding smart money concepts is like learning to think like an institution. Instead of chasing after price based on typical retail indicators, you start looking for the big moves that smart money is making. You begin to notice when the market is setting traps for retail traders, and how these large players accumulate positions before pushing price in a big way.
With SMC, you stop guessing and start anticipating. By looking for liquidity zones, order blocks, and market structure shifts, you can get in sync with the big players and follow their moves, not fight them.
Conclusion
Smart Money Concepts are all about shifting your perspective. Instead of thinking like a retail trader looking for quick breakouts, oversold/overbought conditions, or chasing trends — start looking at the market as the big players do. Pay attention to where the liquidity is, identify key order blocks, and use market structure shifts to guide your trades.
By learning to spot these key signs, you’ll stop being the one who’s trapped and start being the one who’s in sync with the smart money.
Ready to trade smarter? Keep an eye on those order blocks and liquidity zones — they’re where the real money is made.
Next Steps
- Start practicing by reviewing charts through the SMC lens.
- Keep refining your understanding of market structure, liquidity, and order blocks.
- Stay patient, smart money trades aren’t about quick wins, but about positioning yourself for big moves.
__________________________________________
Thanks for your support!
If you found this guide helpful or learned something new, drop a like 👍 and leave a comment, I’d love to hear your thoughts! 🚀
Make sure to follow me for more price action insights, free indicators, and trading strategies. Let’s grow and trade smarter together! 📈

OptionsMastery: This is the "h" DayTrading Pattern.This is the "h" pattern. A highly successful daytrading pattern!
🔉Sound on!🔉
📣Make sure to watch fullscreen!📣
Thank you as always for watching my videos. I hope that you learned something very educational! Please feel free to like, share, and comment on this post. Remember only risk what you are willing to lose. Trading is very risky but it can change your life!

Foundation of Technical Trading: What Makes a Chart Tradable?The Foundation of Technical Trading
There is an abundance of information on price charts, technical methods, indicators, and various tools. However, the required first step is to understand basic market structure. Without this foundational knowledge, technical applications risk becoming inconsistent and disconnected from broader market behavior.
It is also important to question whether technical charts and tools are effective at all. What makes the market responsive to a trendline, a pattern, or an indicator? And why, at other times, do these tools seem entirely irrelevant? Is the market random? If certain events are predictable, under what conditions can such occurrences be expected?
Experiment: Random Charts
Here is an illustration of four charts; two showing real price data and two randomly generated. While some visual distortion gives away subtle differences, there are more refined methods to construct this experiment that makes telling the difference between real and random almost impossible.
All these charts show viable patterns and possible applications. When presented with these, even experienced people tend to construct narratives, whether or not structure is present. This raises a fundamental question; how can one distinguish real occurrences from coincidental formations on a chart? In case all movements are considered random, then this should indicate that applied methods perform no better than coincidence?
Bias and Distortion
It’s also important to comprehend the influence our perception. As humans we are wired to find patterns, even in random data, which can lead to various cognitive biases that distort our interpretation. For example, confirmation bias may lead us to focus only on evidence that supports our expectations, while apophenia causes us to see patterns where none exist. Similarly, hindsight bias can trick us into believing past patterns were obvious, which can develop overconfidence in future decisions. Awareness of these biases allows us to approach technical tools and charts with greater objectivity, with more focus on probabilistic methods and calculated risks.
Experiment: Random Levels
Perform the following experiment; open a chart and hide the price data. Then draw a few horizontal lines at random levels.
Then reveal the price again. You’ll notice that price can touch or reverse near these lines, as if they were relevant levels.
The same thing can happen with various indicators and tools. This experiment shows how easy it is to find confluence by chance. It also raises an important question, is your equipment and approach to the markets more reliable than random?
Market Disorder
Financial markets consist of various participants including banks, funds, traders and algorithmic systems. These participants operate with different objectives and across multiple timeframes resulting in a wide range of interpretations of market behavior. Trades are executed for various reasons such as speculation, hedging, rebalancing, liquidation or automation; directional intent could be unclear. For instance, the prior may serve to offset exposure, and portfolio rebalancing could require the execution of large orders without directional intent.
Technical and chart-based trading likely makes up a minor segment of the overall market; even within this subset, there is considerable variation in perception and interpretation. There could be differences in timeframe, reference points, pattern relevance and responses to similar information. The market is broader, more complex and less definitive than it appears. The point is that markets contain a high degree of structural disorder, which means most assumptions should be questioned and perceived as estimative.
The effect of buying and selling pressure on multiple timeframes sets the foundation for oscillation in price movements, rather than linear and monotonic movements. This pattern of rising and falling in a series of waves sets the points for where the current structure transitions between balance and imbalance. An overall equilibrium between buying and selling pressure results in consolidative price movement, whereas dominance leads to trending or progressive movement.
Volatility Distribution
To answer the main question: What differentiates real market behavior and charts from random data, and ultimately makes it tradable, is the distribution of volatility. This forms the basis for the phenomenon of volatility clustering, where periods of high volatility tend to follow high volatility, and low volatility follows low volatility. It is rare for the market to shift into a volatile state and then immediately revert to inactivity without some degree of persistence. Research supports the presence of this volatility persistence, though with the important caveat that it does not imply directional intent.
Volatility Cycles
These phases tend to occur in alternation, known as volatility cycles, which set the foundation for tradable price structures. This sequence consists of a contractive phase, marked by compression in price movements, followed by an expansive phase, characterized by increased volatility and directional movement. The alternation reflects shifts in underlying buying and selling pressure. This behavior offers a practical approach to interpret market behavior. A more detailed explanation of the concept could be explored in a future post.
Conclusion
While the idea of profitability through technical trading is often questioned, it remains a viable approach when based on sound principles. The edges available to the average trader are smaller and less frequent than commonly presumed. The concepts of volatility and the ability to locate areas of imbalance forms the basis for identifying conditions where market behavior becomes less random and more structured. This sets the foundation for developing technical edges.
The content in this post is adapted from the book The Art of Technical Trading for educational purposes.
Trump’s Tariffs & the Silent Setup — Why This Could Be Bigger ?Hello Traders 🐺
I hope you enjoyed yesterday’s Black Monday 😂 because honestly, it was brutal for all investors.
But corrections like this are always necessary — and I want to talk about that in this idea with a bit more detail.
Also, I’ll update you on the current situation of BTC.D, because as I told you in my last update, the market is about to create a bear trap on the BTC.D chart.
I already shared the proof for this prediction before the dump — you can check it here:
So now, let’s talk about the economic reason behind the dump, and then I’ll go over the technical side of the chart.
This idea I’ll explain how we can use macroeconomic data in our trading decisions.
So make sure to read it carefully and see how you can apply it to your strategy ✅
Do deep corrections always mean danger?
Not necessarily.
Let’s go back and remember some of the biggest crashes in financial history —
The COVID dump or even the famous Black Monday.
If you ask yourself now, “What was the smartest move back then?”
You’ll probably say:
Buy. Accumulate. Because that was the bottom — and we never saw those prices again.
And guess what?
The current state of the market is no different.
So why do I believe Trump’s new tariff policy could actually be bullish?
Let me break it down simply for you:
🔥 The Tariff War: Why it started
For years, most countries had easy access to the U.S. consumer market — the largest in the world — with little or no tariffs.
But U.S. manufacturers didn’t enjoy the same freedom when exporting abroad — they faced heavy tariffs, while also struggling with intense competition inside their own borders due to lack of import restrictions.
So what happened?
✅ The new tariffs brought two key benefits:
1️⃣ Forced negotiations:
Other countries now have to either remove or reduce their own export tariffs to keep trading with the U.S.,
or else they lose access to a market that’s extremely consumption-driven.
2️⃣ Advantage to U.S. domestic production:
If foreign exporters lose access, U.S. producers finally get room to breathe,
and can grow competitively inside their own market.
💰 What happened after tariff fears hit?
In the past month, markets reacted with fear.
A massive amount of capital flew out of financial markets and inflation-hedged assets,
the dollar strengthened, and recession fears grew.
But here’s the twist...
What if Trump had started printing money before this shakeout?
If liquidity was still high, printing more would’ve:
Crushed the dollar
Destroyed consumer buying power
Sparked inflation again
But right now, after money has already been squeezed out of markets and the dollar is strong,
the Fed has a clean path to restart QE (quantitative easing) without tanking the dollar’s value.
So what's next?
Lower interest rates, stimulus packages, subsidies — all will likely come soon.
This time, Trump can inject liquidity exactly where he wants it to go:
Straight into U.S. industry, not into meme coins and junk assets.
With fewer export tariffs, American factories will be more competitive,
U.S. exports could rise, and the country will rely less on foreign production.
And what does this mean for the markets?
Simple.
Once the Fed pivots back to easing, markets will react violently to the upside.
So, as I always say:
Don’t waste this opportunity. Use these prices wisely.
now let's come back into the chart :
As I told you before , BTC.D now is testing the blue monthly resistance line and also hit the rising wedge upward resistance line and in my opinion there is a big chance to see a massive bull market incoming...
I hope you find this idea valuable and as always remember :
🐺 Discipline is rarely enjoyable , but almost always profitable 🐺
🐺 KIU_COIN 🐺

Tutorial on how I use stoch few other tricksVideo on how I use stoch 15 Min daily weekly
few other TA tricks hope u enjoy

What’s the Most Valuable Token in the Crypto World?Hello and greetings to all the crypto enthusiasts,✌
Spend 3 minutes ⏰ reading this educational material. The main points are summarized in 3 clear lines at the end 📋 This will help you level up your understanding of the market 📊 and Bitcoin💰.
🎯 Analytical Insight on Bitcoin: A Personal Perspective:
Regarding the movement of the Bitcoin market, I'll briefly mention that the price is currently near a very strong monthly support, which I’ve marked on the chart for you. I believe now is not the time to break this support, and the price will likely retest it. I foresee at least a 10% increase from here, with a short-term target of $83,000. 📈
Now, let's dive into the educational section, which builds upon last week's lesson (linked in the tags of this analysis). Many of you have been eagerly waiting for this, as I have received multiple messages about it on Telegram.
What’s the Most Valuable Token in the Crypto World?
If we were to simplify things, one could argue that the most important token in the world of crypto is... the Gold Token.
Yes — a digital representation of gold itself. 🪙✨
Why Gold, and Why Now?
With the return of Donald Trump to the presidency of the United States, global markets are likely to face renewed uncertainty and directional shifts. Historically, political shake-ups like this have had a profound effect on financial systems, commodity prices, and investor sentiment.
In times of unpredictability, gold has always been a safe haven. It's trusted, time-tested, and globally valued. That’s why it makes sense for investors to allocate a portion of their capital to gold — especially now.
But what if you didn’t have to deal with storing physical gold? What if you could hold it digitally, within the same crypto ecosystem you’re already familiar with? That’s where gold-backed tokens come into play.
What Are Gold Tokens? 🌐
Gold tokens are digital assets built on blockchain networks (typically Ethereum) and backed by real, physical gold held in secure vaults. These tokens offer a modern bridge between traditional wealth preservation and decentralized finance.
They’re designed to let users enjoy the benefits of gold investment — without the inconvenience of owning, storing, or securing physical bars.
Key Features of Gold-Backed Tokens:
🔹 Real Asset Backing: Each token typically represents a fixed amount of gold (like 1 gram or 1 troy ounce).
🔹 Transparency & Security: Since they're built on blockchain, transactions are traceable, secure, and publicly verifiable.
🔹 Redeemability: Some platforms allow users to exchange their tokens for physical gold if identity verification conditions are met.
🔹 Liquidity: Unlike physical gold, these tokens can be traded instantly on major crypto exchanges.
🔹 Divisibility: You can own fractions of an ounce — making gold more accessible than ever.
Leading Gold Tokens to Know About:
Here are three of the most recognized gold-backed tokens in the crypto market:
PAX Gold (PAXG) : 1 token = 1 ounce of London Good Delivery gold
Tether Gold (XAUT) : Issued by the same company behind USDT, backed by Swiss vault gold
AurusGOLD (AWG) : A decentralized token fully backed by gold, built on Ethereum
Let’s focus on the two most dominant players: PAXG and XAUT.
1. PAX Gold (PAXG) 🏛
Issuer: Paxos Trust Company, regulated by the New York Department of Financial Services
Backing: Each token equals 1 troy ounce (≈31.1g) of high-purity gold stored in secure London vaults
✅ Users can redeem for physical gold
✅ Supports micro-investments — ideal for beginners
✅ Full transparency: Regular audits and proof of reserves
✅ Traded on top-tier exchanges like Binance, Kraken, and Coinbase
Why people trust PAXG:
Its regulatory status and institutional backing make it one of the most secure ways to gain gold exposure in the crypto world.
2. Tether Gold (XAUT) 🇨🇭
Issuer: Tether, the company behind the widely used USDT stablecoin
Backing: 1 token equals 1 ounce of physical gold held in Swiss vaults
🔐 Focuses heavily on privacy and robust asset protection
🔁 Tokens are redeemable for physical gold by verified users
📉 Less transparent than PAXG in terms of regulation and audit trails
💹 Listed on popular platforms like Bitfinex
Worth noting:
Despite Tether’s past controversies around asset disclosures, XAUT remains popular due to its ease of use and the strong brand behind it.
Which One Should You Choose?
If regulation and transparency matter most to you, PAXG may be the better fit. It’s trusted by institutions, backed by U.S. regulators, and offers detailed audits of gold reserves.
If you value brand recognition and a more flexible approach, XAUT offers a credible alternative — just be aware of the differences in oversight.
Final Thoughts 💼🪙
Gold-backed tokens combine the timeless value of gold with the flexibility and innovation of blockchain. They're an excellent way to hedge against economic uncertainty without stepping outside the crypto ecosystem.
If you’re building a diversified portfolio, allocating a portion of your investment to digital gold could be a smart move — both for stability and long-term value.
Let your crypto holdings shine with a touch of gold. 🌟
However , this analysis should be seen as a personal viewpoint, not as financial advice ⚠️. The crypto market carries high risks 📉, so always conduct your own research before making investment decisions. That being said, please take note of the disclaimer section at the bottom of each post for further details 📜✅.
🧨 Our team's main opinion is: 🧨
Gold-backed tokens, like PAXG and XAUT, let you invest in gold digitally without the hassle of storing physical gold. They’re built on blockchain, offering transparency, security, and easy trading. PAXG is more regulated, making it ideal for cautious investors, while XAUT offers privacy and is backed by Tether, a big name in crypto. These tokens represent real gold and can be redeemed for it. If you're looking to diversify and hedge against economic uncertainty, they’re a solid option in your portfolio.
Give me some energy !!
✨We invest countless hours researching opportunities and crafting valuable ideas. Your support means the world to us! If you have any questions, feel free to drop them in the comment box.
Cheers, Mad Whale. 🐋

Candlestick Pattern Trading: Reading the Market in ColorHello, traders!
Let’s face it — price charts can feel overwhelming at first. Red. Green. Wicks. Shadows. Bodies. It’s like abstract art for traders. But once you understand candlestick pattern trading, you’ll start to see structure in the chaos—and maybe even profit from it.
Candlestick patterns are one of the most popular tools in technical analysis. They don’t just show price data; they tell a story about market sentiment. Whether you’re a beginner or an experienced trader, knowing your candlestick pattern chart basics is essential. So, grab your coffee (or matcha, we don't judge), and let’s break this down.
What Is a Candlestick Pattern?
A candlestick pattern is a visual formation that appears on a price chart and helps traders predict future market movement based on past price behavior. Each candle represents the open, high, low, and close price for a specific time frame.
When grouped, candlestick chart patterns help traders spot potential reversals, continuations, and areas of indecision. These formations work across all time frames and are used in stocks, crypto, and forex – you name it.
Candles don’t just represent price; they reflect emotion. Greed. Fear. FOMO. Panic selling. It’s all there in the pattern candlestick formations. Learning to read them is like learning a new language—except this one helps you protect your capital.
Whether you're a scalper or a swing trader, the best part of candlestick pattern trading is that it gives you context. It shows who’s in control — buyers or sellers— and offers clues on what might come next.
Candlestick Patterns Cheat Sheet for Cryptomarkets
To help you better navigate, here's a handy visual reference that breaks down key candlestick chart patterns by category: bullish, bearish, and neutral. Whether you're spotting a potential reversal or riding a continuation, this cheat sheet covers some of the most reliable formations used in candlestick pattern trading.
🔵 Bullish Patterns (Reversal & Continuation)
These patterns typically appear at the bottom of a downtrend and signal potential upside momentum.
Key Bullish Patterns Shown Include:
Hammer and Inverted Hammer – Reversal patterns that signal buyer strength.
Bullish Engulfing, Morning Star, and Tweezer Bottom – These are Strong indications of a trend reversal.
Rising Three Methods, Bullish Three Line Strike, and Bullish Mat Hold – Continuation patterns that suggest a bullish trend is likely to resume.
🔴 Bearish Patterns (Reversal & Continuation)
Found at the top of uptrends, these patterns often warn of downward pressure:
Hanging Man and Shooting Star – Classic bearish reversals.
Bearish Engulfing, Evening Star, and Tweezer Top – Indicate a shift from bullish to bearish control.
Falling Three Methods, Bearish Three Line Strike, and Bearish Mat Hold – Patterns that imply the downtrend is resuming after a pause.
🟠 Neutral Patterns
These patterns signal indecision in the market and require confirmation:
Doji – A candle where the open and close are nearly the same, reflecting balance.
Gravestone Doji and Dragonfly – Unique forms of the Doji that lean toward reversals depending on their position.
This cheat sheet is a great visual companion for understanding candlestick pattern charts at a glance — especially useful in fast-moving markets like crypto.
Final Thoughts: Learn the Language of the Market
Candlestick pattern trading is like learning to read between the lines—but in chart form. Once you recognize the key candlestick chart patterns, you’ll stop guessing and start interpreting what the market is really trying to say.
So, next time you open a chart, don’t just stare at it. Ask questions:
❓ Is that a bullish candlestick pattern forming?
❓ Is this a breakout or a trap?
❓ Is the candlestick flag pattern just pausing, or is momentum dying?
When you start seeing candles not as just red and green bars but as signals of crowd behavior… well, that’s when the magic begins.
Have a favorite candlestick pattern chart setup you swear by? Drop it in the comments, and let’s compare notes. 🔥

RSI + BB strategy - the strong duo you will ever need to win Hello traders!
This article shares with you a strategy employing two famous indicators that have stood the test of time and used by professionals and amateurs alike. A solid trading plan needs at least one solid strategy which will be your bread and butter. You can always add more strategies or game plans to your repertoire but you need to master one. Trading can be as complicated or simple as you make it. To make sense of it all, you should always try to be realistic and stick to a trading plan which is "simple and stupid" so that you free your mind from overthinking and focus on the market movements instead. A good strategy, along with constant market trend analysis, good risk management, news awareness and emotion control can ultimately transition you to being a consistent profitable trader. Indeed, there are times where the odds will not be in your favour and you will have losing trades. However, the key to success is to think of trading as a game of probability and developing a winning edge that ensures you are profiting more than losing. A 1:2 RRR is the least you have to accept when entering a trade, else sit tight and wait for the next opportunity. As Jesse Livermore quoted, "It never was my thinking that made the big money for me. It always was my sitting. Got that? My sitting tight!".
RSI
Developed by J. Welles Wilder Jr. In 1978, the relative strength index is a momentum indicator that measures the speed and magnitude of price changes. At 70+, RSI is considered overbought and a retracement in price may occur. At 30-, RSI is considered oversold and price may go up. The middle line is the mean of recent prices, usually during a 14 days period.
BB
Developed by John Bollinger much later in the 1980s, BB is a volatility indicator which measures the speed and extent of price changes. A wider band signals high volatility and a narrow band signals low volatility. When price reaches the upper band, the asset is considered overbought and price may retract. When price reaches the lower band, the asset is considered oversold, meaning there are less and less sellers in the market and price may go up. The middle line is usually a simple moving average, showing the mean price across a time period.
RSI + BB strategy
The combination relies, and truthfully so, on the fact that the price of an asset usually hovers around its mean. Unless there are significant macroeconomic changes and news are strong (ultimately forming a new trend), price does not deviate much from its mean. It continues and builds its existing trend and moves up and down the moving average. By meauring both the momentum and volatility of the price, while keeping an eye on the direction of the trend, a trader can place small trades with a minimum 1:2 RRR as the asset moves in a range, an uptrend or a downtrend. The indicators give you insight on where to buy and place your SL and TP.
Trading set ups
- RSI 70+, BB touching upper band, no news, BB horizontal (showing a ranging market), price at major resistance zone - sell because price is likely to move through the moving average towards to lower band
- RSI 30-, BB touching lower band, no news, BB horizontal (showing a ranging market), price at major support zone- buy because price is likely to move through the moving average towards to upper band
- RSI 70+, BB touching upper band (price climbing up the BB ladder), BB moving upwards (uptrend), strong good news - buy because price is in uptrend and trend is likely to continue
- RSI 30-, BB touching lower band (price falling off the BB cliff), strong bad news - sell because price is in downtrend and trend is likely to continue
Sitting tight
-Playing on a 1hr timeframe, there won't be many instances when all these stars align. That is when you sit tight and wait.
- When price is hovering in between the RSI grid and BB band - sit tight and wait because the odds are not in your favour and it is impossible to predict which way price will move. Let the market do its thing, protect your capital and wait for the market to show you what to do next.
Note
- When the conditions are met, always enter the trade as soon as you get confirmation. If you are late in entry, skip the trade and wait
- Place your SL just above the upper BB if selling or just below the lower BB if buying
- TP is essential so you can lock in profits, especially in ranging markets where price quickly touches the BB band and bounces back. If you are in a trade and not able to monitor it, a TP ensures you have closed your trade at your desired and predicted price. TP is placed close to the lower band if selling or close to the upper band if buying
-Ensure that all your other criteria such as news, RRR and emotion control are met to enter a trade. If one is not met, this trade is not for you.
- Familiarise yourself using alerts. You have to be able to be present when the opportunity presents itself. Tradingview's lowest paid plan gives you 20 alerts, which is more than sufficient if you are focusing on 4-5 assets only. Alerts add to your winning edge and enable you to be trading the best set ups when they form.
Please do not hesitate to share your thoughts if you do use RSI and/or BB and have had positive outcomes. :)
GL to all!
