Why you should WAIT for trades to come to YOU!In this video, we dive deep into one of the most underrated but powerful habits that separates consistently profitable traders from the rest: waiting for the trade to come to you.
It sounds simple, even obvious. But in reality, most traders—especially newer ones—feel the constant urge to do something. They scan for setups all day, jump in at the first sign of movement, and confuse activity with progress. That mindset usually leads to emotional trading, overtrading, and eventually burnout.
If you've ever felt the pressure to chase price, force trades, or trade just because you're bored… this video is for you.
I’ll walk you through:
1. Why chasing trades destroys your edge—even when the setup “kind of” looks right
2. How waiting allows you to trade from a position of strength, not desperation
3. The psychological shift that happens when you stop trading to feel busy and start trading to feel precise
4. How the pros use waiting as a weapon, not a weakness
The truth is, trading is a game of probabilities and precision. And that means you don’t need 10 trades a day—you need a few good ones a week that truly align with your plan.
Patience doesn’t mean doing nothing, it means doing the right thing at the right time. And when you develop the skill to sit back, trust your process, and wait for price to come to your level… everything changes. Your confidence grows. Your equity curve smooths out. And most importantly, your decision-making gets sharper.
So if you're tired of overtrading, feeling frustrated, or constantly second-guessing your entries—take a breath, slow it down, and start thinking like a sniper instead of a machine gun.
Let the market come to you. That’s where the real edge is.
Chart Patterns

Trump's Tariff Wars : Why It Is Critical To Address Global TradeThis video, a continuation of the Trump's Tariff Wars video I created last week, tries to show you why it is critically important that we, as a nation, address the gross imbalances related to US trade to global markets that are resulting in a $1.5-$1.8 TRILLION deficit every fiscal year.
There has been almost NOTHING done about this since Trump's last term as President.
Our politicians are happy to spend - spend - spend - but none of them are worries about the long-term fiscal health of the US. (Well, some of them are worried about it - but the others seem to be completely ignorant of the risks related to the US).
Trump is raising this issue very early into his second term as president to protect ALL AMERICANS. He is trying to bring the issue into the news to highlight the imbalances related to US trade throughout the world.
When some other nation is taking $300B a year from the us with an unfair tariff rate - guess what, we need to make that known to the American consumer because we are the ones that continue to pay that nation the EXTRA every year.
Do you want to keep paying these other nations a grossly inefficient amount for cheap trinkets, or do you want our politicians and leaders to take steps to balance the trade deficits more efficiently so we don't pass on incredible debt levels to our children and grandchildren?
So many people simply don't understand what is at risk.
Short-term - the pain may seem excessive, but it may only last 30, 60, 90 days.
Long-term - if we don't address this issue and resolve it by negotiating better trade rates, this issue will destroy the strength of the US economy, US Dollar, and your children's future.
Simply put, we can't keep going into debt without a plan to attempt to grow our GDP.
The solution to this imbalance is to grow our economy and to raise taxes on the uber-wealthy.
We have to grow our revenues and rebalance our global trade in an effort to support the growth of the US economy.
And, our politicians (till now) have been more than happy to ignore this issue and hide it from the American people. They simply didn't care to discuss it or deal with it.
Trump brought this to the table because it is important.
I hope you now see HOW important it really is.
Get some.
#trading #research #investing #tradingalgos #tradingsignals #cycles #fibonacci #elliotwave #modelingsystems #stocks #bitcoin #btcusd #cryptos #spy #gold #nq #investing #trading #spytrading #spymarket #tradingmarket #stockmarket #silver

Learn 3 Best Time Frames for Day Trading Forex & Gold
If you want to day trade Forex & Gold, but you don't know what time frames you should use for chart analysis and trade execution, don't worry.
In this article, I prepared for you the list of best time frames for intraday trading and proven combinations for multiple time frame analysis.
For day trading forex with multiple time frame analysis, I recommend using these 3 time frames: daily, 1 hour, 30 minutes.
Daily Time Frame Analysis
The main time frame for day trading Forex is the daily.
It will be applied for the identification of significant support and resistance levels and the market trend.
You should find at least 2 supports that are below current prices and 2 resistances above.
In a bullish trend, supports will be applied for trend-following trading, the resistances - for trading against the trend.
That's the example of a proper daily time frame analysis on GBPCHF for day trading.
The pair is in an uptrend and 4 significant historic structures are underlined.
In a downtrend, a short from resistance will be a daytrade with the trend while a long from support will be against.
Look at GBPAUD. The market is bearish, and a structure analysis is executed.
Identified supports and resistances will provide the zones to trade from. You should let the price reach one of these areas and start analyzing lower time frames then.
Remember that counter trend trading setups always have lower accuracy and a profit potential. Your ability to properly recognize the market direction and the point that you are planning to open a position from will help you to correctly assess the winning chances and risks.
1H/30M Time Frames Analysis
These 2 time frames will be used for confirmations and entries.
What exactly should you look for?
It strictly depends on the rules of your strategy and trading style.
After a test of a resistance, one should wait for a clear sign of strength of the sellers : it can be based on technical indicators, candlestick, chart pattern, or something else.
For my day trading strategy, I prefer a price action based confirmation.
I wait for a formation of a bearish price action pattern on a resistance.
Look at GBPJPY on a daily. Being in an uptrend, the price is approaching a key resistance. From that, one can look for a day trade .
In that case, a price action signal is a double top pattern on 1H t.f and a violation of its neckline. That provides a nice confirmation to open a counter trend short trade.
Look at this retracement that followed then.
In this situation, there was no need to open 30 minutes chart because a signal was spotted on 1H.
I will show you when one should apply this t.f in another setup.
Once the price is on a key daily support, start looking for a bullish signal.
For me, it will be a bullish price action pattern.
USDCAD is in a strong bullish trend. The price tests a key support.
It can be a nice area for a day trade.
Opening an hourly chart, we can see no bullish pattern.
If so, open even lower time frame, quite often it will reveal hidden confirmations.
A bullish formation appeared on 30 minutes chart - a cup & handle.
Violation of its neckline is a strong day trading long signal.
Look how rapidly the price started to grow then.
In order to profitably day trade Forex, a single time frame analysis is not enough . Incorporation of 3 time frames: one daily and two intraday will help you to identify trading opportunities from safe places with the maximum reward potential.
❤️Please, support my work with like, thank you!❤️
I am part of Trade Nation's Influencer program and receive a monthly fee for using their TradingView charts in my analysis.

How to Build a Super Pitchfork with Reaction & Trigger LinesIn this educational video tutorial, I guide you through the process of setting up a Super Pitchfork using the Bitcoin daily chart. This method is inspired by Patrick Mikula’s work in " The Best Trendline Methods of Alan Andrews. "
I demonstrate how to:
- Create and project reaction lines
- Generate bullish and bearish trigger lines
- Apply a personal timing technique for pitchforks based on Michael Jenkins’ methods by squaring significant pivots to the median line, reaction lines, and upper parallel to produce time-based reaction points anticipating potential market turns.
This walkthrough is for traders who already have a foundational understanding of pitchforks.
Inspired by the work of Patrick Mikula, this is how I personally apply and expand on the Super Pitchfork method in my own charting.

Ultimate Guide to Smart Money ConceptsWhat Are Smart Money Concepts?
Introduction:
If you’ve been trading for a while, you’ve probably noticed that sometimes the market moves in ways that just don’t make sense. You’ve got your technical analysis all set, but the market seems to go in the opposite direction. That’s where Smart Money Concepts (SMC) come in.
At its core, SMC is all about understanding how big players in the market (think hedge funds, institutions, and banks) move prices. These players have massive amounts of capital and information, and they don’t trade like the average retail trader. Understanding their behavior can help you see where the market is going next before it happens.
What is Smart Money?
In the world of trading, smart money refers to the institutional investors who move markets with their huge orders. Unlike retail traders, who might be relying on indicators or patterns, smart money trades based on liquidity, market structure, and order flow.
While retail traders are typically reacting to price movements, smart money is the one causing those moves. They’re out there seeking out places where they can accumulate positions or distribute them. The tricky part is that they’ll often make the market go in one direction just to trap retail traders and get them to take positions before flipping it back to where they wanted it to go in the first place.
Key Concepts in Smart Money Trading
1. Market Structure
Market structure refers to the way price moves in a trend. It’s essentially a pattern of higher highs and higher lows for an uptrend, or lower highs and lower lows for a downtrend.
Smart money uses these patterns to their advantage. When they see the market creating a series of higher highs and higher lows, they’ll take advantage of that momentum to push prices further, knowing retail traders will follow along.
But when they want to reverse the market, they’ll push it in the opposite direction, creating a market structure shift or a break of structure, which signals that the trend is over and a new one is starting.
2. Liquidity
Liquidity refers to the amount of orders available to be filled at different price levels. Smart money knows exactly where retail traders are likely to place their stops or buy orders.
They’ll often push the price to these levels, triggering those stops and collecting the liquidity. Once that liquidity is grabbed, they’ll reverse the price and move it in the intended direction.
A common way to spot liquidity is by looking for equal highs or equal lows, where traders often place their stop-loss orders. These are often areas smart money will target.
3. Order Blocks
Order blocks are areas on the chart where institutions have placed big orders. These are key levels that represent where price might return to later, and they can act as areas of support or resistance.
Order blocks are usually found after big price moves. Institutions place these orders to either accumulate positions or offload them, and price often comes back to these levels to fill orders that were left behind.
4. Fair Value Gaps (FVG)
Fair value gaps, or imbalances, are price areas where the market moves quickly, leaving gaps between candlesticks. These gaps represent areas where the market has moved too fast for regular orders to fill, and price tends to return to these levels to fill the gaps.
Smart money knows that these imbalances are critical areas for future price action, and they’ll use them to re-enter the market after a move has been completed.
Why Does Smart Money Matter?
Understanding smart money concepts is like learning to think like an institution. Instead of chasing after price based on typical retail indicators, you start looking for the big moves that smart money is making. You begin to notice when the market is setting traps for retail traders, and how these large players accumulate positions before pushing price in a big way.
With SMC, you stop guessing and start anticipating. By looking for liquidity zones, order blocks, and market structure shifts, you can get in sync with the big players and follow their moves, not fight them.
Conclusion
Smart Money Concepts are all about shifting your perspective. Instead of thinking like a retail trader looking for quick breakouts, oversold/overbought conditions, or chasing trends — start looking at the market as the big players do. Pay attention to where the liquidity is, identify key order blocks, and use market structure shifts to guide your trades.
By learning to spot these key signs, you’ll stop being the one who’s trapped and start being the one who’s in sync with the smart money.
Ready to trade smarter? Keep an eye on those order blocks and liquidity zones — they’re where the real money is made.
Next Steps
- Start practicing by reviewing charts through the SMC lens.
- Keep refining your understanding of market structure, liquidity, and order blocks.
- Stay patient, smart money trades aren’t about quick wins, but about positioning yourself for big moves.
__________________________________________
Thanks for your support!
If you found this guide helpful or learned something new, drop a like 👍 and leave a comment, I’d love to hear your thoughts! 🚀
Make sure to follow me for more price action insights, free indicators, and trading strategies. Let’s grow and trade smarter together! 📈

OptionsMastery: This is the "h" DayTrading Pattern.This is the "h" pattern. A highly successful daytrading pattern!
🔉Sound on!🔉
📣Make sure to watch fullscreen!📣
Thank you as always for watching my videos. I hope that you learned something very educational! Please feel free to like, share, and comment on this post. Remember only risk what you are willing to lose. Trading is very risky but it can change your life!

Foundation of Technical Trading: What Makes a Chart Tradable?The Foundation of Technical Trading
There is an abundance of information on price charts, technical methods, indicators, and various tools. However, the required first step is to understand basic market structure. Without this foundational knowledge, technical applications risk becoming inconsistent and disconnected from broader market behavior.
It is also important to question whether technical charts and tools are effective at all. What makes the market responsive to a trendline, a pattern, or an indicator? And why, at other times, do these tools seem entirely irrelevant? Is the market random? If certain events are predictable, under what conditions can such occurrences be expected?
Experiment: Random Charts
Here is an illustration of four charts; two showing real price data and two randomly generated. While some visual distortion gives away subtle differences, there are more refined methods to construct this experiment that makes telling the difference between real and random almost impossible.
All these charts show viable patterns and possible applications. When presented with these, even experienced people tend to construct narratives, whether or not structure is present. This raises a fundamental question; how can one distinguish real occurrences from coincidental formations on a chart? In case all movements are considered random, then this should indicate that applied methods perform no better than coincidence?
Bias and Distortion
It’s also important to comprehend the influence our perception. As humans we are wired to find patterns, even in random data, which can lead to various cognitive biases that distort our interpretation. For example, confirmation bias may lead us to focus only on evidence that supports our expectations, while apophenia causes us to see patterns where none exist. Similarly, hindsight bias can trick us into believing past patterns were obvious, which can develop overconfidence in future decisions. Awareness of these biases allows us to approach technical tools and charts with greater objectivity, with more focus on probabilistic methods and calculated risks.
Experiment: Random Levels
Perform the following experiment; open a chart and hide the price data. Then draw a few horizontal lines at random levels.
Then reveal the price again. You’ll notice that price can touch or reverse near these lines, as if they were relevant levels.
The same thing can happen with various indicators and tools. This experiment shows how easy it is to find confluence by chance. It also raises an important question, is your equipment and approach to the markets more reliable than random?
Market Disorder
Financial markets consist of various participants including banks, funds, traders and algorithmic systems. These participants operate with different objectives and across multiple timeframes resulting in a wide range of interpretations of market behavior. Trades are executed for various reasons such as speculation, hedging, rebalancing, liquidation or automation; directional intent could be unclear. For instance, the prior may serve to offset exposure, and portfolio rebalancing could require the execution of large orders without directional intent.
Technical and chart-based trading likely makes up a minor segment of the overall market; even within this subset, there is considerable variation in perception and interpretation. There could be differences in timeframe, reference points, pattern relevance and responses to similar information. The market is broader, more complex and less definitive than it appears. The point is that markets contain a high degree of structural disorder, which means most assumptions should be questioned and perceived as estimative.
The effect of buying and selling pressure on multiple timeframes sets the foundation for oscillation in price movements, rather than linear and monotonic movements. This pattern of rising and falling in a series of waves sets the points for where the current structure transitions between balance and imbalance. An overall equilibrium between buying and selling pressure results in consolidative price movement, whereas dominance leads to trending or progressive movement.
Volatility Distribution
To answer the main question: What differentiates real market behavior and charts from random data, and ultimately makes it tradable, is the distribution of volatility. This forms the basis for the phenomenon of volatility clustering, where periods of high volatility tend to follow high volatility, and low volatility follows low volatility. It is rare for the market to shift into a volatile state and then immediately revert to inactivity without some degree of persistence. Research supports the presence of this volatility persistence, though with the important caveat that it does not imply directional intent.
Volatility Cycles
These phases tend to occur in alternation, known as volatility cycles, which set the foundation for tradable price structures. This sequence consists of a contractive phase, marked by compression in price movements, followed by an expansive phase, characterized by increased volatility and directional movement. The alternation reflects shifts in underlying buying and selling pressure. This behavior offers a practical approach to interpret market behavior. A more detailed explanation of the concept could be explored in a future post.
Conclusion
While the idea of profitability through technical trading is often questioned, it remains a viable approach when based on sound principles. The edges available to the average trader are smaller and less frequent than commonly presumed. The concepts of volatility and the ability to locate areas of imbalance forms the basis for identifying conditions where market behavior becomes less random and more structured. This sets the foundation for developing technical edges.
The content in this post is adapted from the book The Art of Technical Trading for educational purposes.
Trump’s Tariffs & the Silent Setup — Why This Could Be Bigger ?Hello Traders 🐺
I hope you enjoyed yesterday’s Black Monday 😂 because honestly, it was brutal for all investors.
But corrections like this are always necessary — and I want to talk about that in this idea with a bit more detail.
Also, I’ll update you on the current situation of BTC.D, because as I told you in my last update, the market is about to create a bear trap on the BTC.D chart.
I already shared the proof for this prediction before the dump — you can check it here:
So now, let’s talk about the economic reason behind the dump, and then I’ll go over the technical side of the chart.
This idea I’ll explain how we can use macroeconomic data in our trading decisions.
So make sure to read it carefully and see how you can apply it to your strategy ✅
Do deep corrections always mean danger?
Not necessarily.
Let’s go back and remember some of the biggest crashes in financial history —
The COVID dump or even the famous Black Monday.
If you ask yourself now, “What was the smartest move back then?”
You’ll probably say:
Buy. Accumulate. Because that was the bottom — and we never saw those prices again.
And guess what?
The current state of the market is no different.
So why do I believe Trump’s new tariff policy could actually be bullish?
Let me break it down simply for you:
🔥 The Tariff War: Why it started
For years, most countries had easy access to the U.S. consumer market — the largest in the world — with little or no tariffs.
But U.S. manufacturers didn’t enjoy the same freedom when exporting abroad — they faced heavy tariffs, while also struggling with intense competition inside their own borders due to lack of import restrictions.
So what happened?
✅ The new tariffs brought two key benefits:
1️⃣ Forced negotiations:
Other countries now have to either remove or reduce their own export tariffs to keep trading with the U.S.,
or else they lose access to a market that’s extremely consumption-driven.
2️⃣ Advantage to U.S. domestic production:
If foreign exporters lose access, U.S. producers finally get room to breathe,
and can grow competitively inside their own market.
💰 What happened after tariff fears hit?
In the past month, markets reacted with fear.
A massive amount of capital flew out of financial markets and inflation-hedged assets,
the dollar strengthened, and recession fears grew.
But here’s the twist...
What if Trump had started printing money before this shakeout?
If liquidity was still high, printing more would’ve:
Crushed the dollar
Destroyed consumer buying power
Sparked inflation again
But right now, after money has already been squeezed out of markets and the dollar is strong,
the Fed has a clean path to restart QE (quantitative easing) without tanking the dollar’s value.
So what's next?
Lower interest rates, stimulus packages, subsidies — all will likely come soon.
This time, Trump can inject liquidity exactly where he wants it to go:
Straight into U.S. industry, not into meme coins and junk assets.
With fewer export tariffs, American factories will be more competitive,
U.S. exports could rise, and the country will rely less on foreign production.
And what does this mean for the markets?
Simple.
Once the Fed pivots back to easing, markets will react violently to the upside.
So, as I always say:
Don’t waste this opportunity. Use these prices wisely.
now let's come back into the chart :
As I told you before , BTC.D now is testing the blue monthly resistance line and also hit the rising wedge upward resistance line and in my opinion there is a big chance to see a massive bull market incoming...
I hope you find this idea valuable and as always remember :
🐺 Discipline is rarely enjoyable , but almost always profitable 🐺
🐺 KIU_COIN 🐺

Tutorial on how I use stoch few other tricksVideo on how I use stoch 15 Min daily weekly
few other TA tricks hope u enjoy

What’s the Most Valuable Token in the Crypto World?Hello and greetings to all the crypto enthusiasts,✌
Spend 3 minutes ⏰ reading this educational material. The main points are summarized in 3 clear lines at the end 📋 This will help you level up your understanding of the market 📊 and Bitcoin💰.
🎯 Analytical Insight on Bitcoin: A Personal Perspective:
Regarding the movement of the Bitcoin market, I'll briefly mention that the price is currently near a very strong monthly support, which I’ve marked on the chart for you. I believe now is not the time to break this support, and the price will likely retest it. I foresee at least a 10% increase from here, with a short-term target of $83,000. 📈
Now, let's dive into the educational section, which builds upon last week's lesson (linked in the tags of this analysis). Many of you have been eagerly waiting for this, as I have received multiple messages about it on Telegram.
What’s the Most Valuable Token in the Crypto World?
If we were to simplify things, one could argue that the most important token in the world of crypto is... the Gold Token.
Yes — a digital representation of gold itself. 🪙✨
Why Gold, and Why Now?
With the return of Donald Trump to the presidency of the United States, global markets are likely to face renewed uncertainty and directional shifts. Historically, political shake-ups like this have had a profound effect on financial systems, commodity prices, and investor sentiment.
In times of unpredictability, gold has always been a safe haven. It's trusted, time-tested, and globally valued. That’s why it makes sense for investors to allocate a portion of their capital to gold — especially now.
But what if you didn’t have to deal with storing physical gold? What if you could hold it digitally, within the same crypto ecosystem you’re already familiar with? That’s where gold-backed tokens come into play.
What Are Gold Tokens? 🌐
Gold tokens are digital assets built on blockchain networks (typically Ethereum) and backed by real, physical gold held in secure vaults. These tokens offer a modern bridge between traditional wealth preservation and decentralized finance.
They’re designed to let users enjoy the benefits of gold investment — without the inconvenience of owning, storing, or securing physical bars.
Key Features of Gold-Backed Tokens:
🔹 Real Asset Backing: Each token typically represents a fixed amount of gold (like 1 gram or 1 troy ounce).
🔹 Transparency & Security: Since they're built on blockchain, transactions are traceable, secure, and publicly verifiable.
🔹 Redeemability: Some platforms allow users to exchange their tokens for physical gold if identity verification conditions are met.
🔹 Liquidity: Unlike physical gold, these tokens can be traded instantly on major crypto exchanges.
🔹 Divisibility: You can own fractions of an ounce — making gold more accessible than ever.
Leading Gold Tokens to Know About:
Here are three of the most recognized gold-backed tokens in the crypto market:
PAX Gold (PAXG) : 1 token = 1 ounce of London Good Delivery gold
Tether Gold (XAUT) : Issued by the same company behind USDT, backed by Swiss vault gold
AurusGOLD (AWG) : A decentralized token fully backed by gold, built on Ethereum
Let’s focus on the two most dominant players: PAXG and XAUT.
1. PAX Gold (PAXG) 🏛
Issuer: Paxos Trust Company, regulated by the New York Department of Financial Services
Backing: Each token equals 1 troy ounce (≈31.1g) of high-purity gold stored in secure London vaults
✅ Users can redeem for physical gold
✅ Supports micro-investments — ideal for beginners
✅ Full transparency: Regular audits and proof of reserves
✅ Traded on top-tier exchanges like Binance, Kraken, and Coinbase
Why people trust PAXG:
Its regulatory status and institutional backing make it one of the most secure ways to gain gold exposure in the crypto world.
2. Tether Gold (XAUT) 🇨🇭
Issuer: Tether, the company behind the widely used USDT stablecoin
Backing: 1 token equals 1 ounce of physical gold held in Swiss vaults
🔐 Focuses heavily on privacy and robust asset protection
🔁 Tokens are redeemable for physical gold by verified users
📉 Less transparent than PAXG in terms of regulation and audit trails
💹 Listed on popular platforms like Bitfinex
Worth noting:
Despite Tether’s past controversies around asset disclosures, XAUT remains popular due to its ease of use and the strong brand behind it.
Which One Should You Choose?
If regulation and transparency matter most to you, PAXG may be the better fit. It’s trusted by institutions, backed by U.S. regulators, and offers detailed audits of gold reserves.
If you value brand recognition and a more flexible approach, XAUT offers a credible alternative — just be aware of the differences in oversight.
Final Thoughts 💼🪙
Gold-backed tokens combine the timeless value of gold with the flexibility and innovation of blockchain. They're an excellent way to hedge against economic uncertainty without stepping outside the crypto ecosystem.
If you’re building a diversified portfolio, allocating a portion of your investment to digital gold could be a smart move — both for stability and long-term value.
Let your crypto holdings shine with a touch of gold. 🌟
However , this analysis should be seen as a personal viewpoint, not as financial advice ⚠️. The crypto market carries high risks 📉, so always conduct your own research before making investment decisions. That being said, please take note of the disclaimer section at the bottom of each post for further details 📜✅.
🧨 Our team's main opinion is: 🧨
Gold-backed tokens, like PAXG and XAUT, let you invest in gold digitally without the hassle of storing physical gold. They’re built on blockchain, offering transparency, security, and easy trading. PAXG is more regulated, making it ideal for cautious investors, while XAUT offers privacy and is backed by Tether, a big name in crypto. These tokens represent real gold and can be redeemed for it. If you're looking to diversify and hedge against economic uncertainty, they’re a solid option in your portfolio.
Give me some energy !!
✨We invest countless hours researching opportunities and crafting valuable ideas. Your support means the world to us! If you have any questions, feel free to drop them in the comment box.
Cheers, Mad Whale. 🐋

Candlestick Pattern Trading: Reading the Market in ColorHello, traders!
Let’s face it — price charts can feel overwhelming at first. Red. Green. Wicks. Shadows. Bodies. It’s like abstract art for traders. But once you understand candlestick pattern trading, you’ll start to see structure in the chaos—and maybe even profit from it.
Candlestick patterns are one of the most popular tools in technical analysis. They don’t just show price data; they tell a story about market sentiment. Whether you’re a beginner or an experienced trader, knowing your candlestick pattern chart basics is essential. So, grab your coffee (or matcha, we don't judge), and let’s break this down.
What Is a Candlestick Pattern?
A candlestick pattern is a visual formation that appears on a price chart and helps traders predict future market movement based on past price behavior. Each candle represents the open, high, low, and close price for a specific time frame.
When grouped, candlestick chart patterns help traders spot potential reversals, continuations, and areas of indecision. These formations work across all time frames and are used in stocks, crypto, and forex – you name it.
Candles don’t just represent price; they reflect emotion. Greed. Fear. FOMO. Panic selling. It’s all there in the pattern candlestick formations. Learning to read them is like learning a new language—except this one helps you protect your capital.
Whether you're a scalper or a swing trader, the best part of candlestick pattern trading is that it gives you context. It shows who’s in control — buyers or sellers— and offers clues on what might come next.
Candlestick Patterns Cheat Sheet for Cryptomarkets
To help you better navigate, here's a handy visual reference that breaks down key candlestick chart patterns by category: bullish, bearish, and neutral. Whether you're spotting a potential reversal or riding a continuation, this cheat sheet covers some of the most reliable formations used in candlestick pattern trading.
🔵 Bullish Patterns (Reversal & Continuation)
These patterns typically appear at the bottom of a downtrend and signal potential upside momentum.
Key Bullish Patterns Shown Include:
Hammer and Inverted Hammer – Reversal patterns that signal buyer strength.
Bullish Engulfing, Morning Star, and Tweezer Bottom – These are Strong indications of a trend reversal.
Rising Three Methods, Bullish Three Line Strike, and Bullish Mat Hold – Continuation patterns that suggest a bullish trend is likely to resume.
🔴 Bearish Patterns (Reversal & Continuation)
Found at the top of uptrends, these patterns often warn of downward pressure:
Hanging Man and Shooting Star – Classic bearish reversals.
Bearish Engulfing, Evening Star, and Tweezer Top – Indicate a shift from bullish to bearish control.
Falling Three Methods, Bearish Three Line Strike, and Bearish Mat Hold – Patterns that imply the downtrend is resuming after a pause.
🟠 Neutral Patterns
These patterns signal indecision in the market and require confirmation:
Doji – A candle where the open and close are nearly the same, reflecting balance.
Gravestone Doji and Dragonfly – Unique forms of the Doji that lean toward reversals depending on their position.
This cheat sheet is a great visual companion for understanding candlestick pattern charts at a glance — especially useful in fast-moving markets like crypto.
Final Thoughts: Learn the Language of the Market
Candlestick pattern trading is like learning to read between the lines—but in chart form. Once you recognize the key candlestick chart patterns, you’ll stop guessing and start interpreting what the market is really trying to say.
So, next time you open a chart, don’t just stare at it. Ask questions:
❓ Is that a bullish candlestick pattern forming?
❓ Is this a breakout or a trap?
❓ Is the candlestick flag pattern just pausing, or is momentum dying?
When you start seeing candles not as just red and green bars but as signals of crowd behavior… well, that’s when the magic begins.
Have a favorite candlestick pattern chart setup you swear by? Drop it in the comments, and let’s compare notes. 🔥

RSI + BB strategy - the strong duo you will ever need to win Hello traders!
This article shares with you a strategy employing two famous indicators that have stood the test of time and used by professionals and amateurs alike. A solid trading plan needs at least one solid strategy which will be your bread and butter. You can always add more strategies or game plans to your repertoire but you need to master one. Trading can be as complicated or simple as you make it. To make sense of it all, you should always try to be realistic and stick to a trading plan which is "simple and stupid" so that you free your mind from overthinking and focus on the market movements instead. A good strategy, along with constant market trend analysis, good risk management, news awareness and emotion control can ultimately transition you to being a consistent profitable trader. Indeed, there are times where the odds will not be in your favour and you will have losing trades. However, the key to success is to think of trading as a game of probability and developing a winning edge that ensures you are profiting more than losing. A 1:2 RRR is the least you have to accept when entering a trade, else sit tight and wait for the next opportunity. As Jesse Livermore quoted, "It never was my thinking that made the big money for me. It always was my sitting. Got that? My sitting tight!".
RSI
Developed by J. Welles Wilder Jr. In 1978, the relative strength index is a momentum indicator that measures the speed and magnitude of price changes. At 70+, RSI is considered overbought and a retracement in price may occur. At 30-, RSI is considered oversold and price may go up. The middle line is the mean of recent prices, usually during a 14 days period.
BB
Developed by John Bollinger much later in the 1980s, BB is a volatility indicator which measures the speed and extent of price changes. A wider band signals high volatility and a narrow band signals low volatility. When price reaches the upper band, the asset is considered overbought and price may retract. When price reaches the lower band, the asset is considered oversold, meaning there are less and less sellers in the market and price may go up. The middle line is usually a simple moving average, showing the mean price across a time period.
RSI + BB strategy
The combination relies, and truthfully so, on the fact that the price of an asset usually hovers around its mean. Unless there are significant macroeconomic changes and news are strong (ultimately forming a new trend), price does not deviate much from its mean. It continues and builds its existing trend and moves up and down the moving average. By meauring both the momentum and volatility of the price, while keeping an eye on the direction of the trend, a trader can place small trades with a minimum 1:2 RRR as the asset moves in a range, an uptrend or a downtrend. The indicators give you insight on where to buy and place your SL and TP.
Trading set ups
- RSI 70+, BB touching upper band, no news, BB horizontal (showing a ranging market), price at major resistance zone - sell because price is likely to move through the moving average towards to lower band
- RSI 30-, BB touching lower band, no news, BB horizontal (showing a ranging market), price at major support zone- buy because price is likely to move through the moving average towards to upper band
- RSI 70+, BB touching upper band (price climbing up the BB ladder), BB moving upwards (uptrend), strong good news - buy because price is in uptrend and trend is likely to continue
- RSI 30-, BB touching lower band (price falling off the BB cliff), strong bad news - sell because price is in downtrend and trend is likely to continue
Sitting tight
-Playing on a 1hr timeframe, there won't be many instances when all these stars align. That is when you sit tight and wait.
- When price is hovering in between the RSI grid and BB band - sit tight and wait because the odds are not in your favour and it is impossible to predict which way price will move. Let the market do its thing, protect your capital and wait for the market to show you what to do next.
Note
- When the conditions are met, always enter the trade as soon as you get confirmation. If you are late in entry, skip the trade and wait
- Place your SL just above the upper BB if selling or just below the lower BB if buying
- TP is essential so you can lock in profits, especially in ranging markets where price quickly touches the BB band and bounces back. If you are in a trade and not able to monitor it, a TP ensures you have closed your trade at your desired and predicted price. TP is placed close to the lower band if selling or close to the upper band if buying
-Ensure that all your other criteria such as news, RRR and emotion control are met to enter a trade. If one is not met, this trade is not for you.
- Familiarise yourself using alerts. You have to be able to be present when the opportunity presents itself. Tradingview's lowest paid plan gives you 20 alerts, which is more than sufficient if you are focusing on 4-5 assets only. Alerts add to your winning edge and enable you to be trading the best set ups when they form.
Please do not hesitate to share your thoughts if you do use RSI and/or BB and have had positive outcomes. :)
GL to all!

$MSTR Model Book Example - 2024 - Continuation Set-upGreat example of continuation set-up on MSTR in 2024. Capturing the second leg following a shorter consolidation after digesting the first leg.

How to Use the TradingView Search Bar Efficiently 01. Introduction to the TradingView Search Bar
The TradingView Search Bar is one of the most essential tools in your charting journey. Located at the top-left corner of the interface, this feature allows you to instantly switch between stocks, indices, crypto assets, forex pairs, futures, and more — without leaving your current chart tab.
Whether you're a day trader looking for high-volume movers or an investor monitoring global indices, the search bar makes it effortless to pull up symbols with lightning speed.
One of the best parts? You don’t even need to click anything — just start typing on your keyboard while a chart is open, and the search bar automatically activates.
Pro Tip: The TradingView Search Bar supports symbol auto-suggestions with exchange suffixes (like .NS for NSE stocks), making it ultra-fast for Indian markets too.
02. How to Open the Symbol Search Bar
Opening the symbol search bar in TradingView is incredibly intuitive — and can be done in multiple ways depending on how fast you want to move.
Here are the top 3 ways to launch the search bar:
• 🔘 Click the Symbol: Go to the top-left corner of your chart and click the current symbol (e.g., NIFTY or BTCUSD) to open the search panel.
• ⌨️ Start Typing: When your chart is focused, just begin typing any symbol directly — the search window pops up instantly.
• 📚 Use the Watchlist: Open a saved symbol from your Watchlist using a simple click, and it automatically replaces the current chart.
Shortcut Key:
Just press your keyboard and type RELIANCE or NIFTY without clicking anywhere — TradingView immediately opens the search popup.
Works on both Windows and Mac.
03. Extended: Exploring the Search Interface (Tab-by-Tab Breakdown)
The TradingView Symbol Search Interface is more than just a place to look up stock names. It’s a powerful filtering system designed to help traders and investors access any instrument—globally and across asset classes—in just a few clicks. Let’s break down each tab and filter in detail:
🔍 1. Asset Type Tabs
Located at the top of the search panel, these tabs let you narrow down by instrument type:
• All – View all available instruments.
• Stocks – Equity shares from global exchanges (e.g., NSE, NASDAQ, BSE, etc.).
• Funds – Includes ETFs, mutual funds, and index funds.
• Futures – Derivative contracts across commodities, indices, etc.
• Forex – Currency pairs like USDINR, EURUSD, GBPJPY, etc.
• Crypto – Popular cryptocurrencies like BTC, ETH, and exchange pairs.
• Indices – Market indices like NIFTY50, S&P 500, NASDAQ100.
• Bonds – Government and corporate bond listings.
• Economy – Macro-economic indicators like GDP, unemployment, CPI.
• Options – Derivative instruments based on options chain availability.
💡 Pro Tip: Use these tabs before typing a symbol to narrow down your focus instantly.
🌍 2. All Countries Filter
You can choose to see instruments only from specific countries. Selecting this opens a country-wise list showing all supported exchanges under each country.
• USA: NASDAQ, NYSE, CBOE, OTC
• India: NSE, BSE
• UK: LSE
• Germany: XETRA, FWB
🔎 Use Case: If you only want Indian stocks, choose India to limit the results to NSE/BSE only.
🧾 3. All Types Filter (Only under Stocks Tab)
This filter lets you refine your equity instrument type, such as:
• Common Stock
• Preferred Stock
• Depository Receipt (like ADR/GDR)
• Warrant
🔍 Use Case: Great for global investors looking specifically for ADRs or warrants.
🧭 4. All Sectors Filter (Only under Stocks Tab)
This is one of the most powerful tools for equity screening. You can filter stocks based on their sector like:
• Finance
• Technology Services
• Health Technology
• Consumer Durables
• Electronic Technology
• ... and 20+ more industry segments
💼 Use Case: Perfect for sector-based trading or thematic investing.
⚙️ Power Feature: All filters can be used in combination. Example: You can search only Technology sector stocks from India, of Common Stock type — all in seconds.
05: Using the Flag to Add Symbols to Watchlist
The 🚩 flag icon in TradingView allows you to tag symbols with color-coded labels for easy watchlist management. You can organize your stocks by strategy, sector, volatility, or timeframe using these flags.
🎯 What Does the Flag Icon Do?
• Click the 🚩 icon next to any symbol in the search panel.
• Choose from 7 different colors to group stocks by theme.
• Flagged stocks immediately appear under that color in your Watchlist.
You can create multiple groups — like F&O, Crypto, Sectors, Swing Picks — all visually organized.
🔍 06: Smart Search Tricks (Symbol Syntax, Exchanges, Shortcuts)
The TradingView Symbol Search bar supports intelligent filters, shortcuts, and exchange-based syntax to save time and improve accuracy. Mastering these tricks will allow you to switch charts and find instruments faster than ever.
🧠 1. Use Exchange Prefixes
You can directly use exchange prefixes to narrow your search:
NSE: – National Stock Exchange of India
BSE: – Bombay Stock Exchange
NASDAQ: – U.S. Nasdaq-listed stocks
NYSE: – New York Stock Exchange
👉 Example: NSE:RELIANCE shows Reliance on NSE instantly.
💡 2. Partial Name Works Too
You can type partial symbols after the exchange code and TradingView will auto-suggest:
🔎 Example: Typing NSE:REL shows Reliance Industries and others.
⚡ 3. Avoid Full Company Names
Typing full company names like “Reliance Industries Ltd” might not show accurate results quickly. Instead, use ticker codes or shortcuts with exchange prefixes for better precision.
🎯 4. Type Directly to Open Search
No need to click the 🔍 icon! Just start typing on the chart:
Windows/Mac: Type any symbol (e.g. INFY)
Use Arrows: ⬆️ ⬇️ to move between results
Press Enter: to select symbol instantly
🌐 5. Use Filter Tabs Above Search
TradingView lets you filter across:
Markets: All / India / US / Global
Types: Stocks / Crypto / Forex / Futures
Sectors: Banks / Tech / Pharma / Energy
💡 Pro Tip: Combine NSE: + partial ticker + filters to drill down fast without leaving the chart screen

Blueprint for Becoming a Successful Forex Trader in 2025🚀 Blueprint to Becoming a Successful Forex Trader in 2025: Leveraging ICT, Automation, and Prop Funding
Here’s a detailed, actionable blueprint designed to position you for success by carefully navigating broker selection, adopting advanced trading strategies, obtaining prop funding, and integrating automation and AI technologies into your trading.
🏦 Broker Selection (Actionable Steps)
🔍 Choose brokers with true ECN/STP execution
⚡ Ensure brokers offer low spreads (0.0-0.2 pip average) and fast execution to maximize ICT precision entries.
🛡️ Prioritize brokers regulated by ASIC, FCA, or FSCA with verified Myfxbook execution reports.
📊 Confirm broker compatibility with MetaTrader 4 (MT4) to seamlessly integrate Expert Advisors (EAs).
💳 Check for flexible withdrawal/deposit methods and swift payouts (Crypto, Wise, Revolut).
🎯 Trading Strategy (ICT Concepts & Supply-Demand Zones)
🧠 Master ICT Concepts: Liquidity sweeps, Order Blocks (OB), Fair Value Gaps (FVG), Market Structure Breaks (MSB).
📍 Combine ICT with Supply-Demand: Identify institutional supply-demand zones aligning with ICT Order Blocks & liquidity areas.
📐 Execute High-Probability Setups: Trade only after liquidity grabs at key daily/weekly ICT points, avoiding retail traps.
📈 Time & Price Theory: Trade London Kill Zones and New York Open exclusively, exploiting predictable ICT volatility.
📆 Weekly Preparation: Annotate D1/H4 charts on weekends marking liquidity points, order blocks, and premium/discount zones clearly.
💰 Getting Prop Funding (Actionable Approach)
🥇 Target reputable prop firms (FTMO, MyForexFunds, The Funded Trader, 8cap, etc) with clear and attainable evaluation objectives.
📑 Use ICT trading style for evaluation: lower-frequency, high-probability trades with clearly defined risks.
🎯 Implement strict risk management rules: never exceed 1% risk per trade, aiming for steady account growth (5-10% monthly target).
📊 Monitor performance closely using provided analytics dashboards (e.g., FTMO Metrics App) and adapt accordingly.
📚 Diversify funded accounts across multiple firms, compounding total available trading capital while reducing firm-specific risk.
⚙️ Automating & Executing Trades (MT4 EA & Bots)
🛠️ Hire experienced MQL4 developers to code custom ICT-based MT4 Expert Advisors
🤖 Develop EAs specifically around ICT logic (Order Block detection, liquidity grabs, market structure shifts) and or supply/demand logic
🤖 use advanced algo based breakout EAs for automation
📌 Automate trade management: EAs should handle entry precision, partial exits, break-even stops, and trail stops.
📡 Set EAs on VPS Hosting (NY4, LD4) for optimal latency and consistent execution (ForexVPS, AccuWeb Hosting).
📈 Regularly perform forward-testing and optimization of EAs on demo accounts before live deployment (at least quarterly optimization).
📲 Integrating Advanced Bots and Technology in 2025
📊 Combine your MT4 EAs with third-party analytics platforms for detailed trade performance insights.
🔮 Incorporate AI-based forecasting tools to refine ICT setups and trade signals.
🔔 Use automated bots for real-time alerts on ICT-based setups via Telegram or Discord channels.
🧑💻 Maintain manual oversight for discretionary ICT decisions—use automation for entry efficiency, not blind reliance.
🔄 Continuously retrain and update your bot’s logic monthly using the most recent trade data, ensuring adaptive execution.
🗓️ Daily Routine for Success
🌅 Pre-session (30 mins): Review annotated charts, ICT concepts (liquidity, OB, FVG), and supply-demand levels.
💻 During trading session: Monitor EA execution, manually adjust positions based on real-time ICT setups.
📝 Post-session (15 mins): Journal trades meticulously in detail, noting ICT reasoning behind wins and losses.
📆 Weekly review: Assess overall ICT & EA performance—adjust EA parameters as needed to match evolving market conditions.
📚 Continuous learning: Keep updated on advanced ICT framework,
supply demand zone trading.
📌 Final Actionable Advice for 2025
🔍 Specialize intensely on ICT & supply-demand concepts rather than multiple strategies—depth over breadth.
🚩 Always adapt and evolve your trading algorithms to ICT methodology—market dynamics continually change.
🧘 Maintain emotional discipline and patience, relying on high-probability setups to steadily compound your account.
💡 Stay ahead by embracing technology: automation, AI-driven forecasting, and custom ICT tools will provide a significant edge in 2025.

Mastering Market Trends: Your Guide to Clearer Trading DecisionsTrends shape every decision you make in the markets, even if you’re unaware of it. Understanding how to identify and adapt to these market phases is your foundational skill - one that separates successful traders from the rest.
Today, let’s simplify and clarify the three essential types of market trends. By mastering this, you’ll approach trading decisions with more confidence and clarity.
⸻
📈 1. Uptrend – Riding the Bull
• What is it?
An uptrend is like climbing stairs upward. Each step (low) is higher than the previous one, and every leap (high) sets a new peak.
• What drives it?
Buyers dominate, optimism rules, and demand pushes prices upward.
• Trading tip:
Identify support levels and look for retracements as potential entry points. Be cautious about chasing prices that have moved too far without a pullback.
⸻
📉 2. Downtrend – Navigating the Bearish Territory
• What is it?
Visualize going down a staircase. Each step down (low) surpasses the previous one, and every upward bounce (high) falls short of the prior peak.
• What drives it?
Sellers control the market, bearish sentiment takes over, and supply outweighs demand.
• Trading tip:
Look for resistance areas to identify potential short entries or wait patiently for signs of a reversal if you’re bullish.
⸻
➡️ 3. Sideways Market – The Calm Before the Storm
• What is it?
Imagine a tug-of-war with evenly matched teams. The price moves back and forth in a narrow range without breaking decisively higher or lower.
• What drives it?
Uncertainty, indecision, or equilibrium between buyers and sellers.
• Trading tip:
Stay patient! Either look to trade range extremes (buying support and selling resistance) or wait for clear breakout signals to catch the next big move.
⸻
🔍 Pro Tip for Trend Analysis:
• Multi-timeframe analysis is key: Always check higher timeframes (weekly, daily, or hourly) to confirm the primary trend. Don’t let short-term noise mislead your trading decisions.
⸻
🚀 Why It Matters:
Aligning your strategies with the correct market trend significantly improves your odds. It’s like sailing with the wind at your back instead of battling against it.
Now, tell us in the comments: Which trend type do you find most challenging to trade?
Trade smarter. Trade clearer.

Clear DayTrading strategy video. The "Inside Bar"🔉Sound on!🔉
📣Make sure to watch fullscreen!📣
Thank you as always for watching my videos. I hope that you learned something very educational! Please feel free to like, share, and comment on this post. Remember only risk what you are willing to lose. Trading is very risky but it can change your life!

DCA Buy Alert Script for Long-Term InvestorsHello, TradingView traders!
I'm sharing a simple Pine Script for cautious DCA (Dollar-Cost Averaging) entries.
This script helps accumulate only on weakness — no buying blindly. (Use only on high volatility altcoins!)
🔍 Strategy logic:
• RSI < 40 → market is oversold
• Price below EMA 21 → short-term trend is down
• Price below SMA 200 → long-term trend is weak
Only when ALL three conditions are met, the script triggers a BUY alert.
✅ How to use:
1. Add the script to your chart
2. Create an alert: choose “Cautious DCA Buy Signal”
3. You’ll get notified when the market dips into a DCA zone
//@version=6
indicator("Cautious DCA on Dips", overlay=true)
rsi = ta.rsi(close, 14)
sma = ta.sma(close, 200)
ema = ta.ema(close, 21)
buySignal = rsi < 40 and close < sma and close < ema
plotshape(buySignal, title="Buy Signal", location=location.belowbar, style=shape.labelup, size=size.normal, color=color.green, text="Buy", textcolor=color.white)
plot(sma, title="SMA 200", color=color.orange)
plot(ema, title="EMA 21", color=color.blue)
alertcondition(buySignal, title="Buy Alert", message="DCA Buy Signal: RSI is low and price is below EMA and SMA")
🔔 This script reduces noise and waits patiently for real dips.
Useful for long-term investors who want to buy with discipline.
Let me know how it works for your strategy!
#DCA #LongTerm

Understanding the ICT Venom ModelIn this video I break down the ICT Venom Model as recently described by the man himself on his YouTube channel. I am sure he has more details on the model he has not released, but I basically attempt to give my two cents on NQ and the model itself.
I hope you find the video useful in your endeavours regarding learning ICT concepts as well as trading in general.
- R2F Trading

Using Fibonacci/Measured Moves To Understand Price TargetThis video is really an answer to a question from a subscriber.
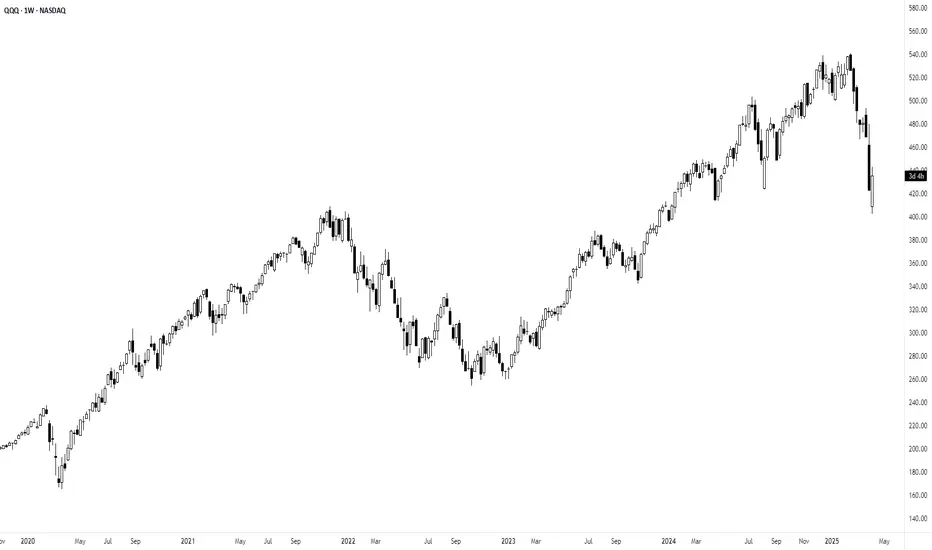
Can the SPY/QQQ move downward to touch COVID levels (pre-COVID High or COVID Low).
The answer is YES, it could move down far enough to touch the pre-COVID highs or COVID lows, but that would represent a very big BREAKDOWN of Fibonacci/ElliotWave price structure.
In other words, a breakdown of that magnitude would mean the markets have moved into a decidedly BEARISH trend and have broken the opportunity to potentially move substantially higher in 2025-2026 and beyond (at least for a while).
Price structure if very important to understand.
Measured moves happen all the time. They are part of Fibonacci Price Theory, Elliot Wave, and many of my proprietary price patterns.
Think of Measured Moves like waves on a beach. There are bigger waves, middle waves, smaller waves, and minute waves. They are all waves. But their size, magnitude, strength vary.
That is kind of what we are trying to measure using Fibonacci and Measured Move structures.
Watch this video. Tell me if you can see how these Measured Moves work and how to apply Fibonacci structure to them.
This is really the BASICS of price structure.
Get Some.
#trading #research #investing #tradingalgos #tradingsignals #cycles #fibonacci #elliotwave #modelingsystems #stocks #bitcoin #btcusd #cryptos #spy #gold #nq #investing #trading #spytrading #spymarket #tradingmarket #stockmarket #silver

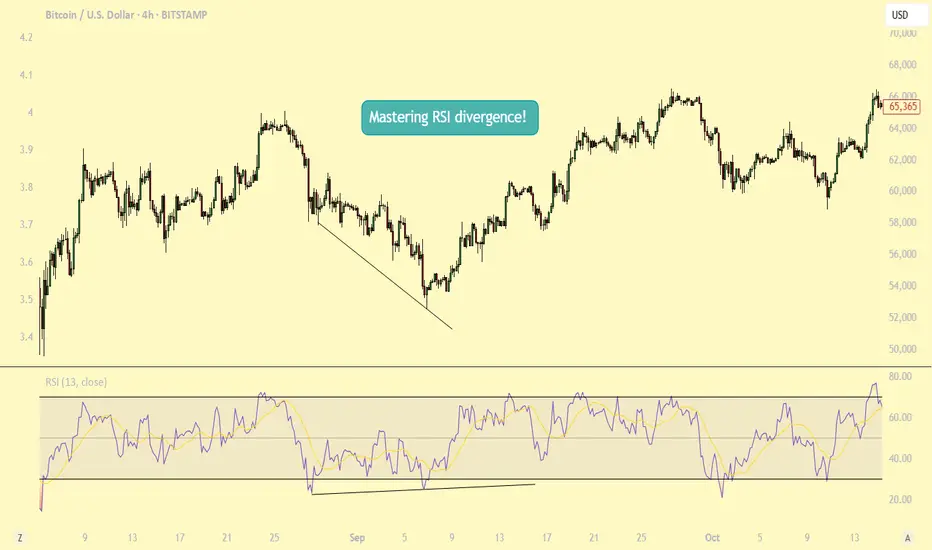
Mastering RSI Divergence: A Complete Guide to Trend ReversalsWhat Are Divergences?
In this guide, we will explore the concept of divergence and how it can be effectively utilized alongside the Relative Strength Index (RSI), one of the most popular momentum indicators in technical analysis. Divergence occurs when the price of an asset moves in the opposite direction of an indicator, such as the RSI. Understanding RSI divergence can be a powerful tool for identifying potential trend reversals or continuations. In this guide, we'll delve into the various types of divergence that can occur with the RSI and how to incorporate them into your trading strategy.
Types of Divergences?
There are three primary types of divergence: bullish, bearish, and hidden divergence. Each signals a distinct market condition and potential outcome, and understanding these nuances is key to using divergence effectively in your trading.
1. Bullish Divergence Bullish divergence happens when the price of an asset makes a lower low, while the RSI forms a higher low. This indicates that although the price is declining, momentum is weakening. The failure of the RSI to confirm the new low in price suggests that selling pressure is diminishing, potentially signaling that a reversal to the upside could occur. Essentially, the market is losing its downward momentum, setting the stage for a potential bullish move.
2. Bearish Divergence Bearish divergence occurs when the price forms a higher high, but the RSI forms a lower high. This indicates that although the price is rising, momentum is weakening. It suggests that the uptrend may be losing steam, signaling that a potential reversal to the downside could be on the horizon. As the price continues higher, but the RSI fails to confirm the new highs, it may indicate that the market is becoming overextended and ready for a correction.
3. Hidden Divergence Hidden divergence differs from regular divergence in that it signals a continuation of the existing trend, rather than a reversal. It typically occurs during pullbacks or retracements in a strong trend. Hidden divergence can appear in both uptrends and downtrends, providing traders with an indication that the prevailing trend is likely to continue after the short-term retracement is over. This type of divergence serves as a confirmation of trend strength and helps traders stay in profitable positions during market pullbacks.
Why Are RSI Divergences a Powerful Tool?
RSI divergence is a powerful tool in trading because it offers early insights into potential trend reversals or shifts in momentum before these changes are fully reflected in price movements. By recognizing divergence, traders can anticipate shifts in market sentiment and make timely decisions. One of the main reasons RSI divergence is so effective is that it serves as an early warning system. It signals when the momentum behind a price trend, whether up or down, is starting to weaken.
For example, in a strong uptrend, if prices continue to make new highs, but the RSI fails to reach new highs, this could signal that the buying momentum is losing strength, even though the price is still rising. This divergence indicates that a reversal or pullback might be imminent, allowing traders to exit their positions or prepare for a potential shift in market direction. Understanding this early warning can provide traders with an edge, helping them avoid being caught in the late stages of a trend and positioning themselves ahead of a change.
How to Trade RSI Divergences?
When the price makes a higher high but the RSI fails to confirm with a higher high, this is known as bearish divergence. While this situation suggests weakening momentum, it doesn’t necessarily mean a correction is imminent. The price may continue to rise for some time, and eventually, the RSI could catch up and make a higher high in line with the price action. Essentially, the market could remain in an uptrend, and the RSI could still align with the price over time.
This highlights the importance of not jumping to conclusions solely based on RSI divergence. Divergence can act as a useful warning, but it should not be relied upon as a definitive signal of a trend reversal. To increase the reliability of the signal, traders should wait for additional confirmation, such as a candlestick pattern indicating a potential trend reversal. Candlestick patterns like engulfing patterns, doji candles, or shooting stars at key support or resistance levels can provide stronger evidence that the trend may be about to change.
Therefore, it’s wise to wait for a more comprehensive confirmation from price action before making a move, rather than acting on divergence alone. Combining RSI divergence with other technical tools, such as candlestick patterns or chart patterns, can help increase the accuracy of your trade decisions.
Conclusion:
Divergence is a powerful tool that provides valuable insights into potential trend reversals or continuations. By understanding the different types of divergence and knowing how to identify them, traders can make more informed decisions. However, divergence should always be used in conjunction with other technical analysis tools to enhance the accuracy of your strategy. With practice, patience, and proper risk management, divergence trading can become a profitable strategy for identifying key market turning points. Whether you are seeking trend reversals or confirming ongoing trends, RSI divergence can be an essential component of your trading toolkit.
Thanks for your support.
- Make sure to follow me so you don't miss out on the next analysis!
- Drop a like and leave a comment!
FXAN & Heikin Ashi TradeOANDA:AUDCHF
In this video, I’ll be sharing my analysis of AUDCHF, using FXAN's proprietary algo indicators with my unique Heikin Ashi strategy. I’ll walk you through the reasoning behind my trade setup and highlight key areas where I’m anticipating potential opportunities.
I’m always happy to receive any feedback.
Like, share and comment! ❤️
Thank you for watching my videos! 🙏

Triangle Chart Patterns: How to Identify and Trade ThemTriangle Chart Patterns: How to Identify and Trade Them
Triangle chart patterns are essential tools in technical analysis, helping traders identify potential trend continuations. These formations build as the price consolidates between converging trendlines, signalling an upcoming move in the market. In this article, we’ll explore the three types of triangle patterns—symmetrical, ascending, and descending—and how traders use them to analyse price movements.
What Are Triangle Chart Patterns?
Triangle chart patterns are a common tool used to understand price movements in the market. These patterns form when the price of an asset moves within two converging trendlines, creating a triangle shape on a chart. The lines represent support and resistance levels, and as they get closer together, it signals a potential breakout in one direction.
Symmetrical, ascending, and descending are three types of triangle patterns. Each of these patterns reflects a different market sentiment, with symmetrical triangles showing indecision, ascending triangles suggesting a bullish bias, and descending triangles hinting at bearish momentum. These formations are useful because they help traders spot potential breakouts, where the price might move sharply up or down after a period of consolidation.
It’s important to note that triangles and wedge patterns are similar but not the same. Both patterns involve converging trendlines, but wedges tend to slope upward or downward. Triangles, on the other hand, either feature one horizontal trendline and a sloping trendline or two sloping trendlines at roughly the same angle.
Below, we’ll cover the three triangle types. If you’d like to follow along, head over to FXOpen and TradingView to get started with real-time charts.
Symmetrical Triangle
The symmetrical triangle is a popular chart pattern that shows up when the price of an asset starts consolidating within a tighter range. Unlike other triangle patterns, it doesn’t lean heavily in either direction—bullish or bearish—making it a neutral signal. It forms when buyers and sellers are in a bit of a standoff, with no clear trend in sight. However, this period of indecision often leads to a significant move once the price breaks out of the pattern.
What Does It Look Like?
- Two converging trendlines;
- One sloping down from the highs (resistance);
- One sloping up from the lows (support);
- The price oscillates between these two lines, forming lower highs and higher lows;
- The formation narrows as the lines get closer together, creating a point of breakout.
What Does It Indicate?
A symmetrical triangle pattern indicates a period of indecision in the market. Buyers and sellers are evenly matched, causing the price to move within a narrowing range. As it gets smaller, the pressure builds, and the price is likely to break out either up or down. Since the formation is neutral, the breakout could occur in either direction, and traders wait for this moment to see where the market is heading.
How Do Traders Use It?
Traders typically watch for a breakout from the symmetrical triangle to signal the next significant price movement. They often look for an increase in trading volume alongside the breakout, as this can confirm the strength of the move. In most cases, it’s used as a signal for potential price continuation. However, some traders see it as a reversal indicator, depending on what the preceding trend looks like.
Ascending Triangle
An ascending triangle is a bullish triangle pattern that’s often looked for when analysing potential price breakouts. It usually forms during an uptrend but may also appear in a downtrend. It suggests that buyers are becoming more aggressive, while sellers are struggling to push the price lower, creating a situation where the market might break upwards.
What Does It Look Like?
- A horizontal resistance line at the top (price struggles to break above this level);
A rising trendline at the bottom, connecting higher lows (buyers are stepping in earlier each time);
- The price moves between these two lines, creating a triangle shape;
- The formation narrows over time, putting pressure on the resistance level.
What Does It Indicate?
An ascending triangle pattern signals that buyers are gaining control. While the price keeps hitting a ceiling (resistance), the higher lows show that the market’s buying pressure is increasing. This often leads to a breakout above the resistance level, where the price can make a significant upward move. Traders usually see this formation as a sign that the market is primed for a continuation of the current uptrend. However, sometimes it can appear in a downtrend and signal a trend reversal.
How Do Traders Use It?
Traders typically use the ascending triangle to spot potential breakouts above the resistance level. When the price finally moves and closes above this line, it’s seen as confirmation that the upward trend is continuing. Many also pay close attention to the trading volume during this breakout—rising volume can confirm that the breakout is genuine.
In some cases, the price may break through the resistance quickly, while in others, it could take time before the upward move happens. There may also be false breakouts before the true bullish move occurs, with the price typically closing below resistance.
Descending Triangle
A descending triangle is a bearish chart pattern that signals potential downward movement in the market. It typically forms during a downtrend but can also appear in an uptrend. It shows that sellers are becoming more dominant, while buyers are struggling to push the price higher, which could lead to a breakdown below a key support level.
What Does It Look Like?
- A horizontal support line at the bottom (price struggles to break below this level);
- A descending trendline at the top, connecting lower highs (sellers are pushing the price down);
- The price moves between these two lines, creating a triangle shape;
- The formation narrows over time, with the pressure building on the support level.
What Does It Indicate?
A descending triangle chart pattern suggests that sellers are in control. While the price holds at the support level, the series of lower highs shows that selling pressure is increasing. This often leads to a breakdown below the support line, where the price might experience a sharp decline. Traders see the formation as a bearish signal, indicating that the market could continue its downward trend.
How Do Traders Use It?
Traders typically use the descending triangle to identify potential breakdowns below the support level. When the price falls and closes below this line, it’s considered confirmation that the sellers have taken over and that further downside movement could follow.
Similar to other triangle patterns, it’s common to watch for a rise in trading volume during the breakdown, as it can confirm the strength of the move. It’s also possible to see false breakouts below the support level when the price closes back inside the pattern almost immediately.
How Traders Use Triangle Patterns in Technical Analysis
These patterns are just one piece of the puzzle in technical analysis, but they can offer us valuable insights when used correctly.
Triangle Pattern Trading: Entry, Stop-Loss, and Profit Targets
Entry Points
Traders typically wait for a confirmed breakout from the triangle formation’s boundaries before entering a trade. For ascending triangles, this means watching for the price to break above the upper trendline (resistance), while for descending triangles, they look for a breakdown below the lower trendline (support). In a symmetrical triangle, the breakout may be in either direction, usually informed by the broader market trend.
The entry is often confirmed by a closing candle above or below these key levels to reduce the risk of false breakouts.
Stop-Loss Placement
Stop-loss orders are crucial here. For ascending triangles, stop losses might be placed just below the last swing low, while for descending triangles, they might be set just above the recent swing high. In the case of symmetrical triangles, traders often place the stop-loss just outside the formation’s apex.
Profit Targets
To set profit targets, traders typically use the triangle's height (the distance between the highest and lowest points). This height is then projected from the breakout point, offering a realistic target for the trade. For example, if a triangle stock pattern’s height is $10 and the breakout occurs at $50, the target would be $60 for a bullish move.
Combining with Market Context
Triangles may become more reliable when considered in the context of the broader market environment. Traders don’t just look at the pattern in isolation—they analyse the prevailing trend, market sentiment, and even macroeconomic factors to gauge whether a breakout aligns with the larger market movement. For instance, an ascending formation in a strong uptrend adds confidence to the idea of a bullish breakout.
Using Other Indicators for Confirmation
While triangles provide a useful framework, they’re usually combined with other technical indicators for confirmation. Traders often align triangles with volumes, moving averages, or momentum indicators to assess whether the breakout has strong support behind it. For instance, a breakout confirmed by high volume or a moving average crossover might add confluence to the trade.
Limitations and Considerations of Triangle Patterns
Triangles are useful tools in technical analysis, but they come with limitations and important considerations. While they can signal potential breakouts, it’s essential to approach them cautiously.
- False Breakouts: Triangles often experience false breakouts, where the price briefly moves beyond the trendline but quickly reverses. This may trap traders in unfavourable positions.
- Subjectivity: These formations are open to interpretation. Different people may draw trendlines slightly differently, leading to varying conclusions about where the breakout occurs.
- Need for Confirmation: Relying solely on patterns can be risky. They may work better when combined with other indicators, such as volume or moving averages, to confirm the trend direction.
- Market Conditions: In volatile or news-driven markets, chart patterns may not behave as expected, reducing their reliability. They may provide false signals or lose significance in these situations.
The Bottom Line
Triangle chart patterns are popular tools among those looking to analyse market movements and potential breakouts. Whether it’s a symmetrical, ascending, or descending triangle, these patterns provide valuable insights into price consolidation and future trends. While no pattern guarantees a winning trade, combining triangles with other indicators may improve market analysis.
Ready to apply your knowledge? Open an FXOpen account to explore chart patterns in more than 700 live markets and take advantage of our low-cost, high-speed trading environment backed by advanced trading platforms.
FAQ
What Is a Triangle Chart Pattern?
A triangle chart is a pattern in technical analysis that forms when the price of an asset moves between converging trendlines, creating a triangle shape on a price chart. They typically signal a period of consolidation before a strong potential breakout in price.
What Are the Patterns of Triangles?
There are three main types of triangles in chart patterns: symmetrical, ascending, and descending. Symmetrical triangles indicate indecision in the market while ascending triangles are often bullish, and descending triangles tend to be bearish.
How to Trade a Triangle?
Traders typically wait for a confirmed breakout from the triangle’s trendlines. According to theory, entry points are based on a breakout above resistance or below support, with stop-loss orders placed just outside the triangle. Profit targets are often set based on the height (the distance between the highest and lowest points) of the pattern.
What Is the Triangle Pattern Strategy?
The triangle pattern strategy involves waiting for a breakout and using the formation’s height to set profit targets. It’s combined with tools like volume, moving averages, and momentum indicators to confirm the move and avoid false breakouts.
Is the Triangle Pattern Bullish or Bearish?
They can be both bullish and bearish. Ascending triangles are generally seen before a bullish movement, descending triangles are bearish, and symmetrical triangles can be either.
This article represents the opinion of the Companies operating under the FXOpen brand only. It is not to be construed as an offer, solicitation, or recommendation with respect to products and services provided by the Companies operating under the FXOpen brand, nor is it to be considered financial advice.
