Trading is execution - USD/JPY Live trading exampleThis is a short mentoring/educational session.
The USD/JPY is the pair we are trading this evening, I analyse this based on the mtf wave structure.
I explained the importance of the secondary trend, as a determinant tool or information for what may happen in the future.
I also shared one of my waves of success strategy using the DMI and the VMP for trade execution.
Finally, after taking the trade, I explained late Mark Douglas probabilistic principles which acts as a solid foundation of our behaviour and interaction with the market.
Wave Analysis

📍Part #1, Elliott Waves: "Introduction. Classification".Hello!
Dear colleagues, because I am constantly analyzing the markets with the help of wave analysis. Many colleagues ask me about it and I decided to make some tutorial posts to help you in this difficult task.
I want to present this information to you in a simple and straightforward manner.
Well, enough unnecessary text, let's get started!
A bit of history from Wikipedia.
Ralph Nelson Elliott (1871-1948), an American accountant, developed a model for the underlying social principles of financial markets by studying their price movements, and developed a set of analytical tools in the 1930s. He proposed that market prices unfold in specific patterns, which practitioners today call Elliott waves, or simply waves.
Elliott stated that "because man is subject to rhythmical procedure, calculations having to do with his activities can be projected far into the future with a justification and certainty heretofore unattainable."
In simple words, human behavior is quite predictable. And since it is mostly people who trade on the markets, we can predict its movement with some probability.
Well. Let's explore what these waves are.
Let's start by categorizing them.
The movements are mostly carried out by a five-wave structure.
📍 Modes: Motive & Corrective
Waves unfold in two distinct forms: motive and corrective. Motive waves exhibit a five-wave structure, featuring both a five-wave model and its co-directional components—waves 1, 3, and 5. The term "motive" is attributed to this structure due to its inherent ability to energize and set the market in motion. On the other hand, corrective waves, prevalent in countertrend movements, follow a three-wave structure or its variations. The name "corrective" stems from their nature as responses to preceding motive waves, executing partial retracements or "corrections" of the prior progress. Hence, these two wave types stand apart not only in their roles but also in their fundamental construction.
Motive
📍 Styles: Impulse & Diagonal.
There are two types of motive waves: impulse and diagonal. As a rule, they alternate in the position of waves 1-5 impulses and waves A-C of the zigzag.
📍 Patterns: Impulse, Leading Diagonal & Ending Diagonal
Five-wave action model. Creates forward progress.Motive waves are limited to three patterns: Impulse, Leading and Ending Diagonals.
Corrective
📍 Groups: Simple & Combined
The corrective mode has two groups, simple and combined. Combined corrections are subdivided into simple corrective structures.
The group of simple corrections includes: flat, triangle and single zigzag. Combined group — multiple zigzag and combination.
📍 Styles: Sharp & Sideways
There are two styles of corrective processes: sharp and sideways. If wave two of an impulse is a sharp correction, expect wave four to be a sideways correction, and vice versa.
📍 Patterns: Flat, Triangle, Single Zigzag, Multiple Zigzag and Combination 📍
Three-wave or five-wave (which have characteristics of both fives and threes) or their combination model of counteraction. Always produces a net retracement from the previous wave.
Corrective patterns include: single and multiple zigzags, triangle, flat, combination.
Variations
📍Divergences in Elliott Wave patterns manifest in two conditional categories: variations in form and variations in the quantity of simple structures. Impulses, diagonals, flats, triangles, and single zigzags are distinguished by the proportional length of their sub-waves, shaping the model uniquely. On the other hand, combined corrections, incorporating multiple zigzags and combinations, maintain a consistent shape, and their identification is based on the count of simple corrective structures they encompass.
This was an introductory lesson on Elliott waves. Further we will examine each type and subspecies of waves in detail in a separate lesson!
🔔 Click on the links below this lesson! 🔔

📍Part # 8, Combination - Corrective Waves.👩🏻💻 Hello !
This time we're going to look at combinations.
It may seem too complicated, but don't worry. In fact, any combination simply consists of two corrective patterns that you and I already know, only between these two patterns there is a connecting wave.
Let's go straight to the rules and everything will become clear to you at once!
✅ Rules ✅
📍A “double three” combination comprises two corrective patterns separated by one corrective pattern in the opposite direction, labeled 'X'. The first corrective pattern is labeled 'W', the second 'Y'.
📍A "double three" combination comprises (in order) a zigzag and a flat, a flat and a zigzag, a flat and a flat, a zigzag and a triangle or a flat and a triangle.
📍Wave 'X' appears as a zigzag or flat.
📍Wave 'X' always retraces at least 90 percent of wave 'W'.
📍Combinations have a sideways look. With respect to waves 'W' and 'Y' in a double three, only one of those waves in each type of combination appears as a single zigzag.
📍Combinations can occur in the same wave positions as flats and triangles (except for the triangle subwave) but cannot occur in waves 'W' and 'Y'.
✅ Guidelines ✅
📍Wave 'X' is often 123.6-138.2% the 'W' wavelength, less often wave 'X' retraces 161.8% or more. Don't expect wave 'X' to be more than 261.8% of wave 'W'.
📍Wave 'X' is usually a single or multiple zigzag.
📍When a zigzag or flat appears too small to be the entire wave with respect to the preceding wave (or, if it is to be wave '4', the preceding wave '2'), a combination is likely.
Thank you for your attention! There will be another lecture next week! Don't miss it!
🔔 Links to other lessons in related ideas. 🔔

The ultimate guide on Elliott waves in crypto tradingMost of you have probably heard about Elliott waves and we are sure that you don’t use it in cryptocurrency trading strategy because it’s very complicated and subjective approach. Crypto trading for beginners is very challenging and stressful even without Elliott waves. To be honest when we first time tried to implement it to my crypto trading strategies it was a complete disappointment. We were sure that it does not suit for both trading bot and manual trades. Elliott waves were thrown into a garbage bin for almost two years and we developed our crypto trading algorithm using only linear programming approaches.
While we have been trying to invent the best automated trading bot using only indicators and support and resistance levels, best crypto traders have been successfully using Elliott waves in their analysis. Finally we make a decision to have a deep dive in this popular crypto trading tool and studied in details all available literature. As a result we found that Elliott waves will ruin your trading if you use it without special indicators for confirmation. Now we have 2 years of experience in trading with waves and almost one year ago we implemented them into our algorithmic trading bot. Today we prepared the best ultimate guide ever on Elliott waves using best practices and our unique experience how to use them in developing your own profitable crypto trading strategies. Let’s go!
Why it’s vital to use Elliott waves?
Before answer this question, let me ask another one! Why is important to use map to reach the final destination? I think here is the obvious answer! Talking about Elliott waves it’s almost the same reason. This is the only one approach which gives you a map for a price chart. I think you agree that technical indicators or support and resistance levels will not give you the answer which direction the price will choose. When you have, for example Stochastic Oscillator crossover or RSI oversold area hit you just open long because this is the most common strategy. You buy asset like a blind kitten. We are not criticize this approach, because using proper risk and money management you will earn with almost every strategy, but understanding the Elliott waves concept will dramatically increase your profit even if you combine them with your ordinary strategy. Why it’s happening? The answer is easy, because Elliott waves in the underlying structure of the market. You will be aware when you shall use your signals and when it’s better to skip trade. Now let’s dive into the Elliott waves to understand how to find them on the price chart. In the first part we will give you all needed theory and after that we will show in the real charts how it works.
Elliott waves
In general, Elliott waves concept is pretty easy. All markets are globally moving up with the five waves formations and then show the pullback with at the reactive waves. On the Bitcoin price chart above you can see the most common picture for Elliott waves. We had the bull run which consists of five waves and then was the bear market represented with the ABC correction.
Waves can be divided into two groups: impulsive and reactive. On the bullish phase waves 1, 3 and 5 are impulsive, 2 and 4 reactive. Impulsive waves consists also with five sub waves, while reactive have usually three waves (exception the triangle correction, will be covered later). On the bearish phase we have the opposite situation: waves A and C are impulsive, while wave B is reactive. Now let’s discuss each wave in details.
What will stop every wave in 90% of cases?
Before we will observe the wave it’s very important to understand what are the early signs that current wave is about to be finished. This is really crucial concept because without it almost impossible to use Elliott waves for profitable trading. We need four tools to make sure that our counting is correct. In this article we will not spend to much time for these indicators, we just show you in practice how to use them. These tools are: Awesome Oscillator, Market Facilitation Index (MFI), Fibonacci retracement and extension and Fractals. These four indicators produce five wave’s end conditions.
Divergence with Awesome Oscillator. If you found five sub waves inside any wave and you can see that price set the higher high (or lower low for bearish case), while AO set lower high (or higher low) it’s divergence between wave 3 and 5. This is the most powerful signal that trend is over.
Fractal at the top or bottom. When you see the divergence it’s just the first sign of trend weakness, we need confirmation with the fractal forming at the top or bottom. You can easily find this indicator in TradingView, it will show you all fractals.
MFI squat bar. We will cover MFI in one of the next educational articles, now you just need to know that it has squat state - the last battle between bulls and bears. One of the three top bars will be the squat in 80% of waves end. You can also find this indicator in TradingView.
AO momentum change. Another one confirmation that trend is over is when AO histogram changes color. It’s better to wait three consecutive columns of the other color or when AO will cross back the signal line, 5 period MA of the AO.
Target area. Using Fibonacci extension and retracement we can find the area where the reversal is the most likely. We will show you this targets when talking about waves.
Now you know the five basic rules and we are ready to discuss every wave using this concept.
Wave 1
When the previous trend is over the impulsive wave 1 begins. We can define the wave 1 start only establishing the previous wave end. It could be wave 5, C or E. It does not matter. You just need to apply our five rules: divergence, momentum change, target area, squat bar and fractal. On the chart you can see how in theory wave 1 can be looks like.
Wave 1 always consists of five waves. That’s why we can wait for the same five rules to complete between wave 3 and 5 inside the wave 1. When you anticipate the wave 1 finish you have two options: close trade and re-enter at the wave 2 bottom or hold for the entire cycle.
Wave 2
When wave 1 ends, you will see pull back in wave 2. It’s important to catch wave 2 bottom because wave 3 will bring you a lot of profit. Wave 2 can be classical ABC zigzag, flat or irregular correction. 70% probability it will be ended inside 0.38 and 0.62 Fibonacci retracement range of wave 1, in rare cases it can ends higher or lower. That’s why it’s better t count waves inside wave 2 and do not miss when all five trend killing conditions are met in wave C inside 2.
Wave 3
The most impulsive wave in the entire cycle is obligatory for trading. Here you can have the less risky and the most easy trading. Wave 3 has the great fundamental factors as a price drivers. For example, Bitcoin spot ETF triggered a huge pump recently. Let’s imagine you correctly entered at the wave 2 end. Now we have to define wave 3 targets. The target area using fibonacci extension can be found between 1 and 1.61. This is the most likely case. In crypto it’s very often when waves 3 are extended.
To have the most precise target it’s highly recommended to count waves inside wave 3. Found five waves? Check our favorite trend killing rules to exit a trade at the top. We know it sounds fantastic, but we managed to buy the exact bottom and sell at the top many times, but to be honest, we have never caught the top of the extended wave 3. Need more experience for that.
Wave 4
Wave 4 can be the most complicated because it has a lot of different variants: zigzag, flat, irregular or even triangle. But at the same time in wave 4 we can have the easiest setup. When you predicted wave 3 top, it’s time to setup the target for the wave 4. The most reliable one is between 0.38 and 0.5. This wave is not so rapid as wave 2 and takes much more time (up to 70% of all cycle).
The very important tip here is to look at the price where wave 4 inside wave 3 has been ended. If this level coincides with the 0.38-0.5 zone it can give you much more confidence. We have never made a mistake using this technique. As usual you have to look for the five trend killing rules in wave C inside wave 4 as well.
Another one thing we want to point out. You know the axiom, that wave 4 has not overlap wave 1 top. This rule can be slightly violated and we will show you the case. Don’t pay attention that much to this rule.
Wave 5
Finally we are in wave 5. This is really vital to define it’s top because bear market will follow this wave and can destroy your deposits. The target area for the wave 5 is defined as the distance between wave 1 bottom and wave 3 top, measured from wave 4 bottom. Area between 0.61 of this distance and 1 Fibonacci level is our target. There you have to find trend killing rules as usual but this time for all cycle, not subwaves.
Corrections
The most dangerous place for trading is the correction. From our experience only wave C in zigzag is tradable. You would better to skip corrections and try to catch it’s end. We have four types of corrections, but the most important knowledges is that wave C and E are always consists of five waves. It means you can use the rules how to catch wave 5 end inside these waves.
Zigzag ABC. If wave A consists of 5 waves the most like we will see zigzag. Wait when wave B reach 0.5-0.61 Fibonacci of wave A and be ready to trade in wave C.
Flat. Wave A has 5 waves inside. Waves A, B and C are almost equal to each other.
Irregular. Wave B top is higher that the previous impulsive wave. Wave A consists of 3 waves.
Triangle. Consists of A, B, C, D and E waves. Wave E consists of five waves. Usually occurs inside waves 4 and B of higher degree.
Now you have a theoretical description. It’s time to trade!

📍Part #7, Multiple Zigzag - Corrective Waves - Combined.👩🏻💻Hello!
Dear colleagues, this is the 7th lesson on wave analysis and today we are going to look at Multiple Zigzag. We already know what a Zigzag is, so we will not look at this pattern for a long time, but just to clarify that Multiple Zigzag consists of several Zigzags.
Let's get to the rules and guidelines!
✅ Rules ✅
📍A Multiple Zigzag comprise two (or three) single zigzags separated by one (or two) corrective pattern(s) in the opposite direction, labeled "X". In the first case, it is called «double zigzag», in the second - «triple zigzag» (The first single zigzag is labeled "W", the second "Y", and the third, if there is one, "Z".)
📍Waves "W", "Y" and "Z" are always single zigzags.
📍Wave "X" never goes beyond the beginning of waves "W" and "Y".
📍Wave "Y" always ends past the end of the "W", and wave "Z", if any, always ends past the end of the "Y".
📍The first "X" wave always ends on the territory of the "W" wave, the second "X", if any, on the territory of the "Y" wave.
📍In a triple zigzag, the first "X" wave is always a zigzag, flat or combination. The second "X" wave is always a zigzag, flat, triangle or combination.
📍In a double zigzag, wave "X" is always a zigzag, flat, triangle, or combination.
📍Double and triple zigzags replace single zigzags, but cannot appear as "W", "Y", or "Z" waves.
✅ Guidelines ✅
📍In a double zigzag, wave "Y" can equal wave "W", .618 wave "W", 1.618 wave "W", or terminate at a distance equal to 1.618 wave "W" past wave "W". In a triple zigzag, there can be equality among waves "W", "Y" and "Z", or wave "Z" can equal 1.618 wave "Y", 1.618 wave "Y", or terminate at a distance equal to 1.618 wave "Y", past wave "Y". In a triple zigzag, the Fibonacci relationships between waves "W" and "Y", would be the same as a double zigzag.
📍The Fibonacci relationships between waves "W" and "X" in a double zigzag, and waves "Y" and "XX" in a triple zigzag are analogous to the relationships between waves "A" and "B" in a single zigzag.
📍In a double zigzag, as a guideline, wave "b" of wave "Y" should not break the trendline that connects the beginning of wave "W" with the end of wave "X".
📍As a guideline, wave "X" (second wave "X" of the triple zigzag) of a double zigzag should break the trend channel formed by the first zigzag in wave "W" ("Y") and be greater than 80% of subwave "b" of wave "W" ("Y" and "Z").
📍When a zigzag appears too small to be the entire wave with respect to the preceding wave (or, if it is to be wave "4", the preceding wave "2"), the complication of the structure to a multiple zigzag will probably follow.
Thank you for your attention! There will be another lecture next week! Don't miss it!
🔔 Links to other lessons in related ideas. 🔔

1 Setup everyone should know.Trading Structure can be tricky. You can see a Break of Structure (BOS), your trying to get in on retracements and just keep getting Stopped out? This will help.
Trade only after a Liquidity Grab, I'm going to call this a "Grubber". After the Grubber, There must be a STRONG Impulse move which breaks Structure in the Opposite Direction, Then you have to wait for a 3 wave retracement "ABC" The "C" Wave is now your Smaller Time Frame "Grubber" Now wait for the B Wave to be broken (Smaller Time Frame IMPULSE"), This is your smaller Time Frame "BOS" The final Step is to set a Limit order on Imbalance fill.

RISK MANAGEMENT the most important setting?Trading without a structured risk management strategy turns the market into a game of chance—a gamble with unfavorable odds in the long run. Even if you possess the skill to predict more than half of the market's movements accurately, without robust risk management, profitability remains elusive.
Why?
Because no trading system can guarantee a 100% success rate.
Moreover, the human element cannot be disregarded. Over your trading career, maintaining robotic discipline, free from emotional or impulsive decisions, is challenging.
Risk is inherently linked to trading—it represents the potential for financial loss. Continually opening positions without considering risk is a perilous path. If you're inclined to take substantial risks, perhaps the casino is a more fitting arena. In trading, excessive risk doesn't correlate with greater profits. This misconception often leads beginners to risk excessively for minimal gains, jeopardizing their entire account.
While eliminating all risk is impossible, the goal is to mitigate it. Implementing sound risk management practices doesn't guarantee profits but significantly reduces potential losses. Mastering risk control is pivotal to achieving profitability in trading.
A risk management system is a structured framework designed to safeguard trading capital by implementing specific rules. These rules aim to mitigate potential losses resulting from analytical errors or emotional trading decisions. While market predictions can be flawed, the margin for error in risk management should be minimal.
Key Principles of Risk Management:
1. **Implement a Stop Loss:**
- While this might seem elementary, it's often overlooked.
- Many traders, especially when emotions run high, are tempted to remove or adjust their stop loss when the market moves unfavorably.
- Common excuses include anticipating a market reversal or avoiding a "wasted" loss.
- However, this deviation from the original plan often leads to larger losses.
- Remember, adjusting or removing a stop loss is an acknowledgment that your initial trade idea might be flawed. If you remove it once, the likelihood of reinstating it when needed diminishes, clouded by emotional biases.
- Stick to your predetermined stop loss and accept losses as part of the trading process, void of emotional influence.
2. **Set Stop Loss Based on Analysis:**
- Never initiate a trade without a predetermined stop loss level.
- Placing a stop loss arbitrarily increases the risk of activation.
- Each trade should be based on a specific setup, and each setup should define its stop loss zone. If there's no clear setup, refrain from trading.
3. **Adopt Moderate Risk Per Trade:**
- For novice traders, a recommended risk per trade is around 1% of the trading capital.
- This means that if your stop loss is hit, the loss should be limited to 1% of your total account balance.
- Note: A 1% risk doesn't translate to opening a trade for 1% of your account balance. Position sizing should be determined individually for each trade based on the stop loss level and total trading capital.
By adhering to these risk management principles, traders can build a solid foundation for long-term success in the markets, safeguarding their capital while allowing for growth opportunities.
In the scenario of a losing streak—let's say five consecutive losses—with a conservative risk of 1% per trade, the cumulative loss would amount to slightly less than 5% of your trading capital. (The calculation of 1% is based on the remaining balance after each loss.) However, if your risk per trade is set at 10%, enduring five consecutive losses would result in losing nearly half of your trading capital.
Recovering from such losses, especially with a high-risk approach, presents a significant challenge. The table below illustrates this challenge: if you lose 5% of your capital (approximately five losing trades), you would need to generate a mere 5.3% profit to break even—equivalent to just one or two successful trades. However, if you overextend your risk and suffer, for instance, a 50% loss, you would need to double your remaining capital to restore your original deposit.
4. Utilize a Fixed Percentage of Risk, Not a Fixed Amount for Position Sizing
Position sizing should be dynamic, tailored to both your predetermined risk percentage and the distance to your stop-loss level. This approach ensures that each trade is individually assessed and sized according to its unique risk profile. In the following section, we will delve into the methodology for calculating position size for each trade.
5. Maintain Consistent Risk Across All Positions
While different trading styles like scalping, intraday, and swing trading may warrant varying risk levels, it's crucial to cap your risk at a reasonable threshold. A general guideline is to not exceed a 5% risk per trade. For those in the early stages of trading or during periods of uncertainty, a risk of 1% or less is advisable.
The table below offers an illustrative example of the outcomes achievable by adhering to risk percentages tailored to individual trades. Regardless of your confidence level in the potential profitability of a trade, maintaining consistent risk per trade is paramount.
6. Avoid Duplicating Trades Based on the Same Setup
Opening identical trades based on a single setup doubles your exposure to risk. This principle is especially pertinent when dealing with correlated assets. If you identify a favorable combination of factors across multiple trading pairs, opt to execute the trade on the pair where the setup is perceived to have a higher probability of success.
7. Aim for a Risk-to-Reward Ratio of at Least 1:3
The Risk-to-Reward (RR) ratio measures the potential profit of a trade relative to its inherent risk. A RR ratio of 1:3 signifies that for every 1% risked through a stop-loss activation, a trader stands to gain 3% of their deposit upon a successful trade.
With a 1:3 RR ratio, a trader doesn't need to be correct on every trade. Achieving profitability in just one out of every three trades can result in a net positive outcome. While RR ratios of 1:1 or 1:2 can also be profitable, they typically require a higher win rate to maintain profitability.
For instance, if you're willing to risk 1% to gain 1%, you'd need at least 6 out of 10 trades to be profitable to yield a positive return. It's worth noting that a high RR ratio doesn't guarantee profitability. It's possible to have trades with a 1:6 or greater RR ratio and still incur losses if the win rate is insufficient.

How to use Williams Alligator Indicator in crypto trading?You have probably heard about Alligator, indicator which is used by top crypto traders. This powerful tool can increase performance of every cryptocurrency trading strategy and help you to make money on the market. Alligator gives us the precise answer if now price is in impulsive or reactive wave. This knowledge is very useful in building your own crypto trading strategies or even in automated trading bot strategies. Even if you use grid bot strategy Alligator can increase your return on investment because it’s vital to set up grid bot in reactive wave and sideways movements. What is the beast Alligator, let’s have a deep dive into this topic today!
What is Alligator?
Alligator is the best indicator for trend detection. It consist of three moving averages which are called jaw, teeth and lips. Moving averages are frequently used in algorithmic trading bots. They can be exponential, smoothed or weighted depending on particular crypto trading algorithm, but we will use smoothed moving averages (SMA).
Jaw (blue line) - 13 period SMA shifted 8 bars is the future. This is the balance lie of the current time frame, for example 1D
Teeth (red line) - 8 period SMA shifted 5 bars in the future. This is balance line of lower degree time frame, for example 4h
Lips (green line) - 5 period SMA shifted 3 bars in the future. This is balance line of two times lower degree time frame, for example 1h
Please, be careful when you use Alligator on different cryptocurrency trading platforms. Check the correct settings and moving average type. On TradingView it’s correct, don’t worry!
Trend detection with Alligator.
The main Alligator’s feature is the detection the trending markets and markets which are about to explode in any side. This powerful tool can enhance your crypto trading algorithm if you use it in the correct way. On the ATOM price chart you can see the example of an Alligator. As you can see it has two conditions: sleeping and hungry.
Sleeping Alligator is when all lines are crossing each other and the price. This period of time can takes up to 80% of time. This is the market cycle stage where you shall avoid any trading and be prepared for the trending market
Hungry Alligator is when after a long period of consolidation price chose the trend direction. It’s an impulsive move. Alligator’s mouth is widely opened and do not crosses the price.
It’s very important to distinguish the trending market because only this type of a market gives you opportunity for the fast and huge profit. Otherwise, in the range bounded market you don’t have enough space for price to make profit for you. Most of stop losses occur while Alligator is sleeping. Another one very useful hint for you. If you use Elliott waves analysis. You don’t need to understand in which wave market is now. You just jump into the impulses and avoid corrections.
How to trade with Alligator
Here is the most interesting part. How to start crypto trading using Alligator? Our basic strategy is to wait when the price will create the first fractal above the Alligator’s mouth and place conditional order to buy one tick above the fractal’s top. We will discuss fractals in details next time. Now you have to understand how to use Alligator.
Another one hint from our experience is to use fractals only when Alligator has been sleeping for a long time, like you see on the BTC chart. After long sleep and fractal breakout Bitcoin showed the greatest bull run in the history.
Let’s notice where we should close trade. Almost at the top! When price started showing weakness we don’t need to be in the market anymore. Using this strategy on 1W time frame you can hold assets during entire bull run and sell then before bear market. Fantastic! Isn’t it?
Conclusion
In this article we discussed how you can implement Alligator indicator in your trading routine. This indicator will help you to avoid boring market when you can only lose money and catch every big move. Moreover you can use even sideways market detection if you use cryptocurrency trading bot which earns money in range bounded market. For sure this in not the only one strategy using Alligator. Next time we enhance our approach with other tools and see in details how Alligator improve their profitability. Moreover, soon we will live stream where practice trading with Alligator. See you next time!
Best regards,
Skyrex Team

📍Part #6, FLAT - Corrective Waves-Simple-Sideways corrections.👩🏻💻Hello!
In this lecture, we will cover one of the options for corrective cycles, namely Flat.
Let's now look at the 'flat' separately as a stand-alone correctional structure. I remind you, 'flat' and 'plane' are essentially the same thing. So, the 'flat' always has a three-wave structure, and it looks like this: 3-3-5. That is, you can identify it by the third wave "C", which always has a five-wave structure. But it can also be a Ending diagonal. And all this will be within the scope of a regular 'flat' or 'plane'. If we draw a line from the base of wave A and the maximum of wave "B", and then also draw a line or level from the end of wave "A" and the end of wave "C", we will get parallel lines, which is exactly what the name Flat hints. And this wave "B" should roll back approximately 90% of wave "A" for everything to look nice. But not always, because there is also an expanded 'flat' and a running 'flat', whichever you prefer.
Well then. Let's look at the main rules and guiding norms for flats.
✅General rules✅
📍A flat always subdivides into three waves.
📍Wave "A" is always a zigzag, flat or combination.
📍Wave "B" is always a zigzag.
📍Wave "C" is always an impulse or a ending diagonal.
✅General guidelines✅
📍Wave "A" is usually a zigzag.
✅Regular Flat✅
Rules
📍Wave "B" never goes beyond beyond the start of wave "A".
📍Wave "B" always retraces at least 90 percent of wave "A".
📍Wave "C" always ends past the end of wave "A".
Guidelines
📍The rarest type of flat correction.
✅Expanded Flat✅
Rules
📍Wave "B" always ends after the start of wave "A".
📍Wave "C" always ends past the end of wave "A".
Guidelines
📍Wave "B" usually retraces 123.6 or 138.2% of wave "A", less often — 161.8%.
📍Wave "C" is often equal to 161.8% of wave "A", less often — 261.8%.
📍The most common type of flat correction.
✅Running Flat✅
Rules
📍Wave "B" always ends after the start of wave "A".
📍Wave "C" never goes beyond the end of wave "A".
Guidelines
📍Within such a flat wave "B" should end well above the origin of wave "A" and that means wave "C" might reflect a 61.8% or even a 100% relationship to wave "A".
📍A running flat indicates that the forces in the direction of the larger trend at next higher degree are powerful.
📍Wave "B" is usually no more than twice the length of wave "A".
Keep in mind that a running flat is rare.
Thank you for your attention! There will be another lecture next week! Don't miss it!
🔔Links to other lessons in related ideas.🔔

Types of liquidityLiquidity:
LQ High/Low
LQ Strong High/Low => Swing High/Low
LQ trendline
LQ Equal High/Low
Liquidity => Strong High/Low => Break => Swing High/Low

Mind the Gap: How to Trade Price GapsThe Power and Beauty of Price Gaps
Price gaps represent a clear imbalance in supply and demand, making them one of the purest representations of momentum in financial markets. These gaps occur when there is a significant disparity between the closing price of one period and the opening price of the next, indicating a sudden surge in buying or selling pressure.
How to Trade Price Gaps: 3 Different Strategies
1. Gap & Go:
Description: This strategy involves trading in the direction of the gap, anticipating that the momentum will continue.
Execution: Enter trades as soon as the market opens, aiming to capture the initial momentum surge.
Timeframe: Typically applied on shorter timeframes, such as intraday charts.
Risk Management: The gap can be used for stop less shelter, hence stops can be placed above (below) the gap.
Example: Tesla (TSLA) 5min Candle Chart
In this example, Tesla gaps lower at the open – breaking below a key level of support and signalling the breakdown of a sideways range. The gap follows through to the downside during the remainder of the trading session.
Past performance is not a reliable indicator of future results
2. Gap Fill:
Description: In contrast to the Gap and Go strategy, this approach involves fading the initial price movement and trading in the opposite direction of the gap.
Execution: Wait for price to retrace back to pre-gap levels before entering trades, anticipating that the gap will eventually be filled.
Timeframe: Can be applied on various timeframes, depending on the magnitude of the gap and market conditions.
Risk Management: Implement stop-loss orders to manage risk, as price may continue to move against the trade.
Example: Barclays (BARC) Hourly Candle Chart
Barclays gap above key resistance on the hourly candle chart. The gap is filled and broken resistance turns to support prior to the uptrend resuming.
Past performance is not a reliable indicator of future results
3. First Pullback:
Description: This strategy combines elements of both Gap and Go and Gap Fill, focusing on entering trades after the initial momentum surge but waiting for a pullback or consolidation before entry.
Execution: Wait for the first pullback or consolidation after the gap before entering trades in the direction of the prevailing momentum.
Timeframe: Suitable for both shorter and longer timeframes, depending on the magnitude of the gap and market dynamics.
Risk Management: Utilise stop-loss orders to protect against adverse price movements and adjust position sizing based on volatility.
Example: Arm Holdings (ARM) Hourly Candle Chart
Arm’s share price puts in a large price gap which breaks decisively above a key level of resistance on the hourly candle chart. Given the size of the gap, optimal entry requires waiting for the market pullback.
Past performance is not a reliable indicator of future results
Additional Factors to Consider
Catalyst Behind the Gap:
Look for stock-specific news events that recalibrate market expectations, such as earnings surprises or changes in outlook.
Mechanical events like dividends or corporate actions are less likely to sustain momentum.
Size of the Gap:
Larger gaps indicate stronger momentum but also carry a higher risk of mean reversion.
Assess the magnitude of the gap relative to historical price action and volatility.
Levels Broken:
Consider the significance of key support and resistance levels broken by the gap, as they may influence the strength and direction of the price movement.
Prevailing Trend:
Analyse the prevailing trend before the gap and assess whether the gap aligns with the overall market direction.
By incorporating these factors into your analysis and selecting the most suitable strategy based on market conditions, you can effectively trade price gaps and capitalise on momentum opportunities in the financial markets. Remember to exercise proper risk management and adapt your approach as market conditions evolve.
Disclaimer: This is for information and learning purposes only. The information provided does not constitute investment advice nor take into account the individual financial circumstances or objectives of any investor. Any information that may be provided relating to past performance is not a reliable indicator of future results or performance. Social media channels are not relevant for UK residents.
Spread bets and CFDs are complex instruments and come with a high risk of losing money rapidly due to leverage. 84.01% of retail investor accounts lose money when trading spread bets and CFDs with this provider. You should consider whether you understand how spread bets and CFDs work and whether you can afford to take the high risk of losing your money.

Sweep flips1. Flip creates + sweeps high
2. Flip creates + sweeps equal highs
3. Flip sweeps high in prior leg
4. Initial Flip reaction gets swept

LiquidityType of liquidity
High / Low
Strong High / Low
Trendline
We assume there is resting LQ behind
any high or low in the market that price
has not yet traded past.

Swing Mapping Part 3: Trade Management StrategiesWelcome to Swing Mapping Part 3, where we delve into three different approaches to trade management using swing mapping methods.
Trade management always represents a trade-off between taking profits early and letting winning trades run. There is no perfect solution, but by understanding different approaches, traders can tailor their strategies to their risk tolerance and market conditions.
1. Aggressive Approach: Exit on Failure at Swing High (Low)
The aggressive approach involves exiting a trade when the market fails to hold above a swing high (swing low if short).
Method: Once you’ve entered the trade (long), continue to map the swings highs as defined in Swing Mapping Part 1. Should the market fail to break and hold above the swing high, a trader using this strategy may close their trade.
This strategy aims for quick profits without giving back gains, capitalising on short-term market movements. Traders employing this strategy often prioritise locking in profits swiftly, especially in volatile or uncertain market conditions. However, by exiting at the first sign of resistance, traders may miss out on potential larger gains if the market continues to move in their favour.
Positives and Negatives:
Positive: Quick profits may allow for rapid capitalisation on short-term price movements.
Positive: Avoids giving back gains by exiting at the earliest indication of a potential reversal.
Negative: Potential for leaving profits on the table if the market continues to trend favourably after the exit signal.
Example: EUR/USD 1hr: Exit on Failure at Swing High
This example on the hourly candle chart illustrates the active approach of taking small profits following failures at a swing high. The first entry takes a retest of support and exits as the market fails to break above prior swing resistance. The second entry then takes a breakout above the swing highs and the aggressive exit approach works well as the market fakes out at swing highs.
Past performance is not a reliable indicator of future results
2. Passive Approach: Exit on a Break Below Swing Low
Contrary to its name, the passive approach still requires active monitoring of the market. This strategy involves exiting a trade when the market breaks below a swing low, indicating a potential reversal or loss of momentum.
Method: Once you’ve entered the trade (long), continue to map the swing lows as defined in Swing Mapping Part 1. Should the market break and close below a swing low, a trader using this strategy may close their trade.
While this approach provides a more conservative exit compared to the aggressive approach, it may result in giving back some profits gained during the trade. Traders employing this strategy often prioritise running winning trades over taking quick profits – pairing well with trend following entry techniques.
Positives and Negatives:
Positive: Gives winning trades more time to run and allows for pullbacks.
Positive: Provides a conservative exit strategy, minimising the risk of significant drawdowns.
Negative: By definition this strategy will result in giving back profits as the market retraces.
Example: S&P 500 5min: Exit on a Break Below Swing Low
This example is an intra-day trend continuation trade on the S&P 500 5min candle chart. The entry setup was a simple breakout above a cluster of swing highs in-line with the prevailing trend. We can see that whilst we had several stalls at swing highs, taking a more passive approach and using mapped swing lows worked well when managing this trade. The trade was closed when the market broke and closed below a mapped swing low.
Past performance is not a reliable indicator of future results
3. Predictive Approach: Place a Limit Order at Key Swing Resistance (Support)
We mentioned in Swing Mapping Part 1 that not all swings are equal. The more bars either side of the swing high or low, the larger the peak or trough in the market – the more significant the turning point. These more significant swings can be used as profit targets.
Method: Prior to entering your trade, identify a key swing on your chart – one that has not been broken for a large number of bars. A trader using this strategy would place a limit order to take profits at the highest close prior to the key swing.
This strategy allows traders to set a predefined target for profit-taking, reducing the need for continuous monitoring of the market. By setting a fixed order, traders can automate their exit strategy and focus on other aspects of their trading plan.
However, the challenge lies in accurately predicting price targets, as objectives may not always align with market movements. With this in mind, this approach can work in tandem with either the aggressive or passive swing exit methods outlined above.
Positives and Negatives:
Positive: Fixed order placement enables traders to "set and forget" their exit strategy, reducing emotional decision-making.
Positive: Allows you to define your risk/reward prior to entering a trade.
Negative: Objectives may not always align with market movements, leading to missed opportunities or premature exits if the target is not reached.
Example: Tesla Daily: Place a Limit Order at Key Swing Support
Here’s an example of the key swing limit order approach to managing trades. Each entry is a short fakeout entry setup that we discuss in depth in Swing Mapping Part 2. We identify the nearest key swing level that we believe the trade could reach. A limit order is then placed at the lowest close nearest the key swing level.
Past performance is not a reliable indicator of future results
Summary
Swing mapping can help you gain a deep understanding of price action and reduces reliance on lagging indicators. It allows you to quickly analyse the strengths of different markets, pinpoint precise entry levels and manage trades in a dynamic way that quickly adapts to changing market conditions.
Now you’ve reached the end of this mini-series on swing mapping, we hope you will feel confident enough to put some of the techniques into practice. Happy swing mapping!
Disclaimer: This is for information and learning purposes only. The information provided does not constitute investment advice nor take into account the individual financial circumstances or objectives of any investor. Any information that may be provided relating to past performance is not a reliable indicator of future results or performance. Social media channels are not relevant for UK residents.
Spread bets and CFDs are complex instruments and come with a high risk of losing money rapidly due to leverage. 84.01% of retail investor accounts lose money when trading spread bets and CFDs with this provider. You should consider whether you understand how spread bets and CFDs work and whether you can afford to take the high risk of losing your money.

Strategy: The 1.61 Head Fake Strategy. The 1.61 head fake strategy is intended to give early signals of where a high/low might be and be an early tell on the potential turn of the trend.
This strategy can be used for both pullbacks and reversals.
When traded as a correction, this strategy usually is successful in the forecasting and trading of the end of Elliot wave 5 heading into the ABC.
Absolute highs and lows can also be made with this 1.61 head fake.
Breaking of the 2.20 fib triggers failure of this strategy.

Strategy: 76 Correction Trend Continuation. The 76 correction strategy aims to pick up optimal continuation trades into large retracements.
It's a trend following strategy that aims to enter into strong counter trend moves to a 76% retracement of the previous trend leg.
This strategy usually performs best when combined with Elliot wave. Waiting for there to be a full impulsive leg in 5 waves followed by a big ABC correction.
The strategy aims to pick up trades into the "C" point in such a correction.
With a default minimum risk:reward of 1:3 the strategy is expected to breakeven on win rates of 35% or higher.

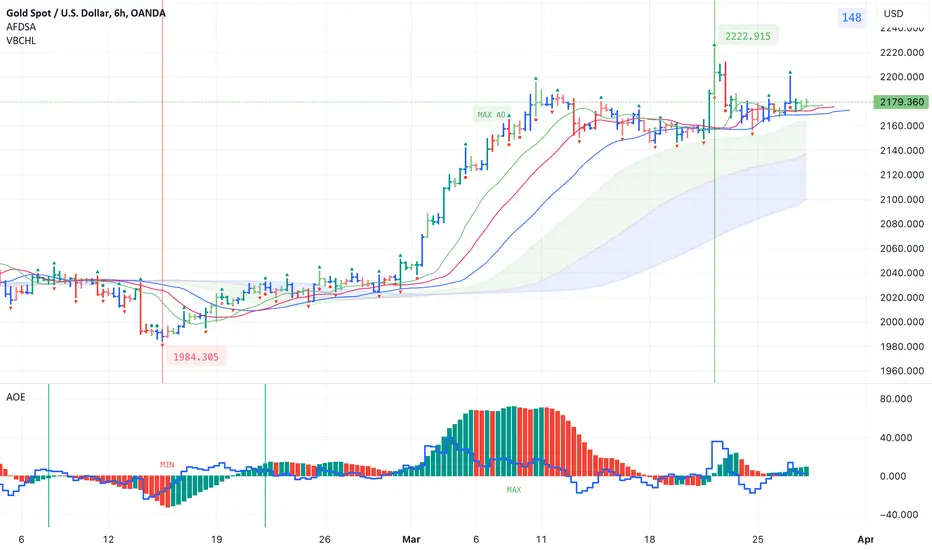
Indicators for trading using Bill Williams' Profitunity strategyI published 3 indicators for trading using Bill Williams' Profitunity strategy. For each indicator, I have added a visual and detailed description in English and Russian. In this post I will briefly describe these indicators and how I use them together.
AFDSA indicator (Alligator + Fractals + Divergent & Squat Bars + Signal Alerts)
Includes Williams Alligator, Williams Fractals, Divergent Bars, Market Facilitation Index, Highest and Lowest Bars, maximum or minimum peak of the Awesome Oscillator, and signal alerts based on Bill Williams' Profitunity strategy:
Bullish and Bearish Divergent Bar Signal + Squat Bar + Green Bar + Fake Bar + Awesome Oscillator Color Change + AO Divergence.
Crossing the green line (Lips) of an open Alligator.
Formation of a fractal.
Signal about the breakdown of the last upper or lower fractal.
Signal about the appearance of a new maximum or minimum peak of AO in the interval of 140 bars from the last bar.
I also added an Alligator display for the higher timeframe, for example, if the chart timeframe is 1 hour, then the higher timeframe will automatically be 4 hours, if the chart timeframe is 4 hours, then the higher timeframe will be 1 day, etc.
AOE Oscillator (Awesome Oscillator + Bars count lines + EMA Line)
Includes the Awesome Oscillator with two vertical lines at a distance of 100 and 140 bars from the last bar to determine the third Elliott wave by the maximum peak of AO in the interval from 100 to 140 bars according to Bill Williams' Profitunity strategy. Additionally, a faster EMA line is displayed.
I also added display of the AO line for the lower timeframe instead of the EMA line if the Moving Average Line values (method, length and source) are equal to the Awesome Oscillator values in the indicator settings. For example, if the chart timeframe is 1 day, then the lower timeframe will automatically be 4 hours, if the chart timeframe is 4 hours, then the lower timeframe will be 1 hour, etc.
VBCHL indicator (Visible bars count on chart + highest/lowest bars, max/min AO)
The indicator displays the number of visible bars on the screen, including the prices of the highest and lowest bars, the maximum or minimum value of the Awesome Oscillator. The values change dynamically when scrolling or changing the scale of the chart, but with a delay of several seconds, so this feature is included in a separate indicator so as not to slow down the work of other indicators.
Indicator settings
In the AFDSA indicator I use the following settings:
By default, the Squat Bar is colored blue, and all other bars are colored to match the Awesome Oscillator color, except for the Fake bars, which are colored with a lighter AO color. But I also enable the display of "Green" Divergent bars in the "Green Bars > Show" field.
I enable the display of Alligator for higher timeframes in the "Alligator for higher timeframe > Enable" field.
In the indicator style settings, I disable the display of the highest and lowest bars, maximum and minimum AO peak labels, because these labels are also displayed by the VBCHL indicator depending on the number of visible bars in the chart window.
Only after opening a position, I enable all additional alerts in the “Enable all additional alerts” field (after changing this field, you need to re-create the alert for the current chart): crossing the green line of an open Alligator, formation of a fractal, appearance of a new maximum or minimum AO peak.
In the settings of the AOE oscillator, I enable the display of the AO line for the lower timeframe instead of the EMA line, setting the same values in the fields for the Moving Average Line (method, length and source) and Awesome Oscillator.
In the VBCHL indicator settings, I only enable the simple display text style for labels in the "Simple display text style for labels" field.
As a result, when analyzing the current chart, I immediately see all the signals on the chart, the location of the bars relative to the Alligator on the higher timeframe and changes in the Awesome Oscillator on the lower timeframe. And thanks to the VBCHL indicator, I quickly select the desired timeframe for analyzing the 5-wave Elliott impulse, focusing on the interval of 140 bars, and immediately see whether there is divergence between the maximum AO peak and the following lower AO peak in this interval.
Truncations in leading diagonals?According to the rules leading diagonals 5th wave cant truncate.
Doesn't matter if they are contracting or expanding variations.
Here are examples where contracting diagonals can truncate.
If they are in the 5th of the 5th of an impulse.

📍Part 5: Corrective Waves - Simple - Triangle.Hello!
➡️In this lecture, we will cover one of the most common or popular correction options - triangles. I remind you that we are now considering various correction structures that are encountered both separately and can be part of more complex structures.
➡️Triangles are probably the most popular pattern for all beginners, yes, and not only beginners. It is quite often seen on the chart and most likely everyone tried to trade it according to classical recommendations, for example from books or a course, when essentially everything comes down to breaking dynamic resistance on one of the sides where you buy or sell.
➡️In history, everything looks pretty harmonious as usual, but in real-time, it turns out to be not that simple, and here maybe just the rules from wave analysis will help to avoid a certain number of errors.
➡️So let's take a look at the main rules and guiding norms for triangles!
✅ General Rules ✅
📍A triangle always subdivides into five waves.
📍At least four waves among waves "a", "b", "c", "d" and "e" are subdivided into a single zigzag.
📍In a triangle, only one subwave can be a multiple zigzag or triangle.
✅ General guidelines ✅
📍Usually, wave "c" or wave "d" subdivides into a "multiple zigzag" that is longer lasting and contains deeper percentage retracements than each of the other subwaves.
📍Alternating waves of a triangle may be in Fibonacci proportion to each other by a ratio of 0.618 for contracting triangles and 1.618 for expanding triangles. For example, in a contracting triangle, look for wave "c" to equal 0.618 of wave "a".
📍A triangle can be correction wave "4" in the impuls, wave "b" of a zigzag, wave "x" of a double or second wave of an "x" of a triple zigzag, sub-wave "c", "d" or "e" of a triangle and the last structure of a combination.
✅ Contracting Triangle ✅
Rules
📍Wave "c" never moves beyond the end of wave "a", wave "d" never moves beyond the end of wave "b", and wave "e" never moves beyond the end of wave "c". The result is that going forward in time, a line connecting the ends of waves "b" and "d" converges with a line connecting the ends of waves "a" and "c".
📍Waves "a" and "b" never subdivide into a triangle.
📍In a running contracting triangle, wave "b" should be no more than twice as long as wave "a".
Guidelines
📍Sometimes one of the waves, usually wave "c", "d" or "e", subdivides into a contracting or barrier triangle. Often the effect is as if the entire triangle consisted of nine zigzags.
📍About 60% of the time, wave "b" goes beyond the beyond the start of wave "a". When this happens, the triangle is called a running contracting triangle.
✅ Barrier Triangle ✅
Rules
📍Wave "c" never moves beyond the end of wave "a", wave "d" never moves beyond the end of wave "b", and wave "e" never moves beyond the end of wave "c". The result is that going forward in time, a line connecting the ends of waves "b" and "d" converges with a line connecting the ends of waves "a" and "c".
📍Waves "b" and "d" end at essentially the same level.
📍In a running barrier triangle, wave "b" should be no more than twice as long as wave "a".
Guidelines
📍About 60% of the time, wave "b" goes beyond the start of wave "a". When this happens, the triangle is called a running barrier triangle.
📍When wave "5" follows a barrier triangle, it is typically either a brief, rapid movement or an exceptionally long extension.
✅ Expanding Triangle ✅
Rules
📍Wave "c", "d" and "e" each moves beyond the end of the preceding same-directional subwave. (The result is that going forward in time, a line connecting the ends of waves "b" and "d" diverges from a line connecting the ends of waves "a" and "c.")
📍Subwaves "b", "c" and "d" each retrace at least 100 percent but no more than 150 percent of the preceding subwave.
Guidelines
📍Subwaves "b", "c" and "d" usually retrace 105 to 125 percent of the preceding subwave.

Swing Mapping Part 2: Trade Entry TechniquesWelcome to part 2 of our 3-part series on swing mapping – a highly underestimated technique that can be applied to any market on any timeframe.
In Swing Mapping Part 1 we outlined the key principles of swing mapping which involved identifying potential swings, monitoring them, and drawing conclusions about market structure as swings levels are held or broken.
Today, we will take this a step further and look at how swing mapping can be used to identify trade entry setups without the need for any additional indicators. We will showcase four simple entry setups that have the potential to unlock a plethora of trading opportunities.
Swing Mapping Entry Setups: Breakouts and Reversals
Swing mapping entry setups fall into two broad categories: breakouts and reversals.
Breakouts involve entering with momentum as the market breaks above a swing that you have identified.
Reversals on the other hand, involve entering against the prevailing momentum on a certain type of reversal that occurs at a swing level.
The breakout and reversal swing mapping entry techniques that we will outline below can be applied to any market on any timeframe.
Breakout Entry Setups
1. Break & Retest
The break & retest setup can occur in a trending market structure or in a range bound market structure.
Entry Trigger:
Break and close above (below) a key level of swing resistance (support). This should be followed by a retest of the broken resistance (support) level. The entry trigger occurs when the market forms a small swing low (high) at the broken resistance (support) level.
Stop Placement:
Below (above) nearest swing low.
Example: S&P 500 5min Candle Chart
In this example the market breaks above a key level of swing resistance. This is followed by a retest of the broken resistance level during which the market formed a cluster of small swing lows – indicating that broken resistance had become support.
Past performance is not a reliable indicator of future results
2. Cluster Breakout
The cluster breakout setup should only be taken when a clear trend has developed. During pullbacks in trends, a market tends to form clusters of small swings. The cluster breakout setup looks to enter on a breakout above (below) a cluster of swing highs (lows). The breakout should occur in the direction of the prevailing trend.
Entry Trigger:
Breakout above two or more small swing highs (lows) that have formed during a pullback in an established uptrend (downtrend).
Stop Placement:
Below (above) nearest swing low.
Example: S&P 500 5min Candle Chart
Sticking with the same example, shortly after the break & retest entry setup occurred a strong uptrend developed during which the market formed a cluster of swing highs as the trend consolidated. When the market broke through the small cluster of swing highs, our entry setup was triggered.
Past performance is not a reliable indicator of future results
Reversal Entry Setups
1. Fakeout
A fakeout occurs when the market breaks above a swing level only to reverse within the same or following two candles – trapping those traders who had anticipated a breakout.
Entry Trigger:
Break above (below) swing resistance (support) level followed by a close back below (above) the swing resistance (support) level within the same or following two candles.
Stop Placement:
Below (above) fakeout low (high)
Example: Tesla Daily Candle Chart
This example from Tesla’s daily candle chart highlights the plethora of trading opportunities the fakeout entry setup can offer. We see multiple instances of long and short opportunities when the market threatens to break above (below) a swing level only to fakeout.
Past performance is not a reliable indicator of future results
2. Hot Touch: Double Top/Bottom
The ‘hot touch’ is a specific variation of the classic double top/bottom. The market must touch and reverse from a swing level within the same candle like a cat that’s just touched a hot tin roof!
Entry Trigger:
An exact double top/bottom forms from a single candle.
Stop Placement:
Below (above) the double bottom (top).
Example: EUR/USD 5min Candle Chart
In the below example a hot touch double top forms in a range bound market – causing prices to reverse sharply and retest the bottom of the range. It is also worth noting the two fakeout patterns that also occurred.
Past performance is not a reliable indicator of future results
Disclaimer: This is for information and learning purposes only. The information provided does not constitute investment advice nor take into account the individual financial circumstances or objectives of any investor. Any information that may be provided relating to past performance is not a reliable indicator of future results or performance. Social media channels are not relevant for UK residents.
Spread bets and CFDs are complex instruments and come with a high risk of losing money rapidly due to leverage. 84.01% of retail investor accounts lose money when trading spread bets and CFDs with this provider. You should consider whether you understand how spread bets and CFDs work and whether you can afford to take the high risk of losing your money.

Smart Money Concepts Detailed Learning Plan. 5 Essential Topics
If you want to learn Smart Money concepts, but you don't know what to start with, this article with help.
I will share with you 5-steps Smart Money Concepts learning plan . 5 important topics to study in SMC.
Topic 1:
Market Structure - the analysis of a behavior of a price on a chart.
In the contest of Smart Money Concepts you should learn:
-SMC structure mapping
-Market trend identification
-Trend change
-Trend reversal
-SMC important events: BoS, CHoCH
Learn Trend Analysis
Leach ChoCH
Topic 2:
Liquidity Zones - learn to identify the areas on a price chart where liquidity concentrates.
Learn How to Identify Liquidity Zones
Topic 3:
Imbalance - one of the most accurate signals of the presence of big players / smart money on the market.
Learn How to Identify Imbalance with Candlestick
Topic 4:
Order Block - the specific areas on a price chart where institutional traders / smart money are placing significant number of trading orders.
Top 5:
Top-Down Analysis - structured and consistent analysis of multiple time frames.
After you study Topic 1, 2, 3, 4, you should learn to apply these knowledge and techniques on multiple time frames, to make informed decisions, following long-term, mid-term, short-term analysis.
Learn Top - Down Analysis
The 5 topics that we discussed are essential for your success as a smart money trader.
Study these topics with care, and I guarantee you that you will achieve exceptional results.
❤️Please, support my work with like, thank you!❤️

📍 Part 4. Corrective Waves- Simple Zigzags - Sharp Corrections.👩🏻💻 Welcome to the 4th lecture on Elliott Waves!
➡️In this lecture, we will start discussing the variations for corrective movements. Let's begin with the simplest one - it's zigzags.
➡️By correction, we mean the construction "ABC" after an impulse. This reminds us of a zigzag, hence the name. Also, we can encounter it in each corrective wave, that is, "2" and "4" - it's the simplest and most common form of correction.
➡️As you recall from previous lectures, for waves "A" and "C," there are variations in the form of Leading and Ending Diagonals, and the same applies to "B," namely flat, zigzag, triangle, or even a combination, i.e., any three-wave pattern. Here it's worth remembering that wave structure is fractal, and there's no need to be afraid, just like with variations for impulses, namely leading and ending diagonals.
➡️Zigzags can often be embedded into a parallel channel. We've dealt with a simple zigzag. Most likely, your main questions are about variations for "B": flat, zigzag, triangle, or combination. On the cover of the learning materials, you will find the main variations of simple zigzags. Keep and use them!
📍 Let's look at the main rules and guidelines! 📍
📍 Guidelines: 📍
📍In a zigzag, wavelength "C" can be equal to wavelength "A".
📍Wave "B" is usually corrected at 38.2% - 78.6% of the length of wave "A".
📍If wave "B" is a triangle, is usually corrected at 38,2% - 50% of the length of wave "A".
📍If wave "B" is a zigzag, is usually corrected at 50% - 78.6% percent of wave "A".
📍In a zigzag, if wave "A" is a leading diagonal, then we would not expect to see an ending diagonal for wave "C".
📍A line connecting the ends of waves "A" and "C" is often parallel to a line connecting the end of wave "B" and the start of wave "A". (Forecasting guideline: Wave "C" often ends upon reaching a line drawn from the end of wave "A" that is parallel to a line connecting the start of wave "A" and the end of wave "B".)
📍Waves "A" and "C" within the zigzag often appear in the form of impulses, but more often alternate according to the type of motive waves: if wave "A" is an impulse, expect wave "C" in the form of a diagonal, and vice versa. It is much less common to find waves "A" and "C" in the form of diagonals.
Thank you for your attention! There will be another lecture next week! Don't miss it!
🔔 Links to other lessons in related ideas. 🔔

Education chart - SIMPLE ZIGZAGS in WXY DOUBLE ZIGZAGI started to assemble own ibrary of ElliottWave patterns and rules.
Here simple zigzags occured in: wave W and wave Y of WXY double zigzag
Zigzag 1 - wave W
Wave A - leading diagonal
Wave B - double zigzag
Wave C - ending expanding diagonal ending at the top line of the parrallel channel
Zigzag 2 - wave Y
Wave A - impulse
Wave B - double zigzag
Wave C - ending expanding diagonal ending at the middle of the parrallel channel
-----------------------------------------
## Rules for Simple ZigZag
- Subdivide into three waves.
- Wave A is always an impulse or leading diagonal (expanding or contracting)
- Wave C is always an impulse or ending diagonal (expanding or contracting).
- Wave B is any corrective pattern.
- Wave B never moves beyond Wave A start
- Wave B always ends in Wave A territory
- Wave A and C cannot be both diagonals of the same type (contracting/contracting or expanding/expanding), other combinations are possible
## Norms
- Waves A and C are frequently impulse waves but even more often they alternate between impulse and diagonal modes. Waves A and C may occasionally alternate between contracting and expanding diagonals
- Waves A and C cannot be diagonals of the same type
- Wave C must travel past Wave A's top. In Elliott Wave Theory, failure to do so is referred to as truncation
- Wave C should not go below 90% of Wave A
## Guidelines
- Wave C is typically equal to 0.618 (occasionally 1.618 or 2.618) of wave A
- Wave B typically retraces 38-79% of Wave A
- in case B is a triangle it retraces **38-50%** of Wave A
- in case B is a running triangle, the retracement can be **10-40%**
- in case B is zigzag, the expected retracement is **50-79%**
- The parallel channel that connects Wave A's start and Wave B's finish may provide a hint of where Wave C might conclude by extrapolating the other line from Wave A's end
- If waves A and C are both strong, wave C will reverse at the channel's top line
- If wave C appears weaker than wave A, it may reverse at the channel's middle
- If Wave C performs stronger than A, a double channel will be used as a target of the reversal point.
## Occurs in
Wave 2
Wave 4 (unless happened in wave 2)
Wave W, Y of WXY double zigzag
Wave W or Y of a combination
Wave B of ABC flat
Waves 1, 2, 3, 4, 5 in contracting diagonal
Wave B of ABC zigzag
Wave X of WXY double zigzag
