Trading phycology Elliot Wave 12345If you are interested in charting elliotwave where many thinks its a holy grail of making profit in the market like me I have here to share the knowledge.
Wave Analysis

Order Blocks live Discuss with Bangla Order blocks really amazing for day trading - we are sharing order blocks system setup ..

Weak BullsBulls lost pressure. To many Buyers in wait but it could be another day for any signs of champion

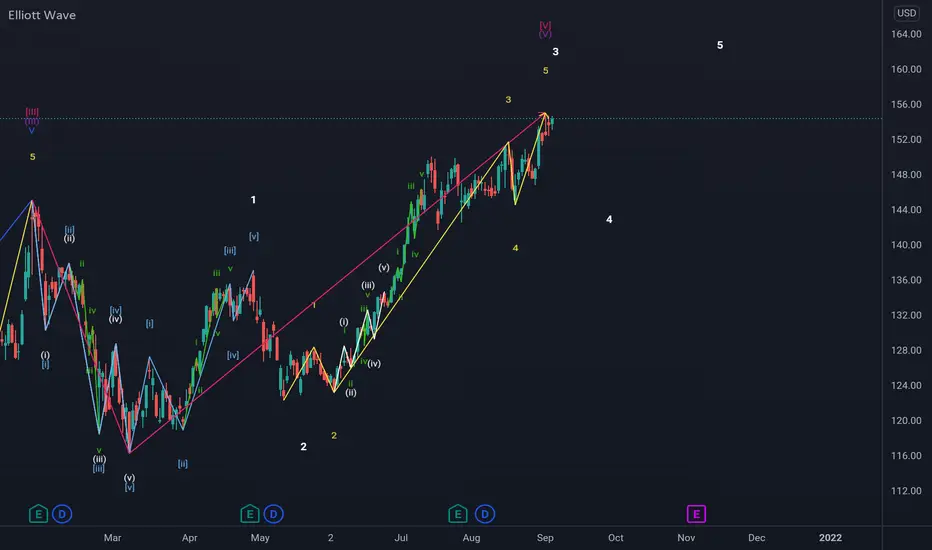
Elliot wave with Diagonal Ending Elliott Wave Count in Bitcoin Daily Chart
In most cases, if wave 5 is formed as a diagonal triangle, it will cause severe falls after the end of the process.
So after recognizing these diagonal triangles in wave 5 - you can close your long trades at the right point and make good profits from short trading in corrections waves.
Please like our tutorial and follow us
------------------------------------------------------------------------------------------------------------------------------------------
You can see our analysis and signals in the following links :

How to Target wave 3 and wave 5 of Elliott waveElliott wave target is quite accurate target zone help you a lot in trading
As this chart and thumbnail chart I expecting price come down wave 4 or continue go to yellow target then make wave 4
So how can we target, firstly to target wave 5 we have to identify which wave is extension
• If wave 1 is extension
We use Fibonacci extension 012
With 0.618(major), 1, 1.618 level
In this chart price had reached 0.618 next target is 1
• If wave 3 is extension
We use Fibonacci extension 014
With 0.618, 1(major), 1.618 level
• If wave 5 is extension
We use Fibonacci extension 034
At this point we draw we don't know it is ext 5 or not but if price keep going we need to watch this level
With 0.618, 1, 1.618(major) level
To Target wave 3 first We use Fibonacci extension 012
With 1, 1.618, 1.786, 2.618
Video - Relationships Between Corrective WavesEducational video on how to anticipate the end of corrective waves so you can rejoin the trend.

Learning Parallel Channel TrapsSometimes we can get so caught up in the fear of missing out on the breakout that we forget it could be a trap.
It is always crucial to listen to your intuition when you see these easy setups because more often than not they are more complex than they seem.
In this example, a breakout occurred and buyers put stops below the last structure, a few days later this structure got raided for liquidity.
Once the liquidity was gathered we began to see the true move to the upside.
Do you see this often in the markets?

The importance of the STOPLOSS protective orderThe importance of the STOPLOSS protective order
Our protective stops are vital to managing our risk, and just a single position you open without a stop can lead to the suicide of your trading account.
The uniqueness of stop orders lies in the fact that they, being pending orders, await their execution at a predetermined price. When stop orders are triggered, their important function is that they add momentum to the market and at the same time use the liquidity present in the market.
1)
Many have probably heard such information as: "When entering a trade, place a protective stop just below the high / low of the price." The reason is that this level has been identified as an important support level .
What else is posted in the support area? Limit orders of traders to buy, who have identified the support area and are waiting for the time to open a position when retesting the level.
Is there a large number of stops under each level? It depends on the size of the timeframe and how quickly the price leaves the given zone at the time of purchase.
2)
When the price gets to this level, traders are still interested in long positions, but this time the price does not bounce off that level as one would expect. It does not break it, does not make lower lows, but displays lower highs.
If you were interested in going long right now, what would you do? The average trader who bounces off the support level would enter a long position with a stop just below the support level . If you had a limit order that hadn't been filled yet, I would have postponed the order.
Candlesticks / Bars displays lower highs; The price does not rise as fast as one might expect; You know that just below the support area there are a lot of stop orders.
3)
What happens next? The price moves downward under pressure and breaks the stops of traders who have long positions, and, as we remember, when buy stops are triggered, these are market sell orders, and they force the price to move further down.
And traders, who are waiting for the opening of short positions, open them because the price breaks the support level , but then the market takes them out, “eats” them, because the price goes higher.
4) Those traders who were initially set for long positions and who were thrown out of the market by broken stops help push the price up. Now the graph looks like this:
New stops are placed below the new level, in front of us is Groundhog Day. And everything that has just been played will be played over and over again ... only at different price levels.
STOPLOSS is a way to limit losses when managing an open trading position or portfolio of positions. In fact, a stop loss is an order to close a position in the event of an unfavorable price movement.
The trader sets a stop loss to limit his own losses and trade within his own money management rules.
Find me on:

Identifying Impulses and correctionsHerein is a simple way of identifying motive/impulse moves. The motive moves are where the price is moving sharply in the direction of the trend. Price thereafter starts struggling on the opposite direction and then continues in the direction of the motive move.
Looking at the MACD indicator we expect the price to correct from the current point until it comes close to the trendline.

Fibonacci projection possibilities for wave 3Graphical representation for possible wave 3 projections under ideal conditions.
100% of wave 1 is the minimum projection limit for wave 3 with no limitation for its further projection

Wave 2 retracement possibilitiesPossible Wave 2 retracement probabilities in graphical representation..

How to use Fibonacci to determine a trend change or a correctionFibonacci is a great tool that I have learned to use in different trading situations. One of the great features of the Fibonacci ratios is the ability to reveal market information.
In this video, I demonstrated how you can use the Fibonacci to confirm a trend change or a retracement.
Enjoy!

HOW TO COUNT WAVES IF WE'VE BEEN ON THE BULLISH TREND.I thought we've been bearish since 2075 but I sort of noticed that I've been wrong since 1676.
When I make a mistake in counting, I look back at previous waves to find some tips and I got something.
Here is just one idea.
If we've been on the bullish trend, previous waves can be thought of as below.
01...1677 - 1795 (impulse)
12...1795 - 1774 (zigzag 3 wave correction)
23...1774 - 1809 (impulse)
34...1809 - 1780 (simple 1 wave correction)
45... Above 1809 (impulse)
12 was a zigzag correction, so it makes sense that the last 3 days' strong drop,34, is a simple 1 wave.
If my counting is correct, the strong bullish wave would come to break 1809.
I'm not sure yet if it's really bullish or not though because 1797 was broken yesterday, I'm getting bullish.
We'll see after either 1809 or 1774 is broken.
Erasing all TLs and other stuff, we can see the price moves very clearly.
💡The absolute principle for trading💡
BUY - as low as possible
SELL - as high as possible
PLEASE DO NOT FORGET TO SMASH LIKE👍🏻 AND FOLLOW ME❤ IT MOTIVATES ME TO THE NEXT IDEA! THANK YOU 🎉

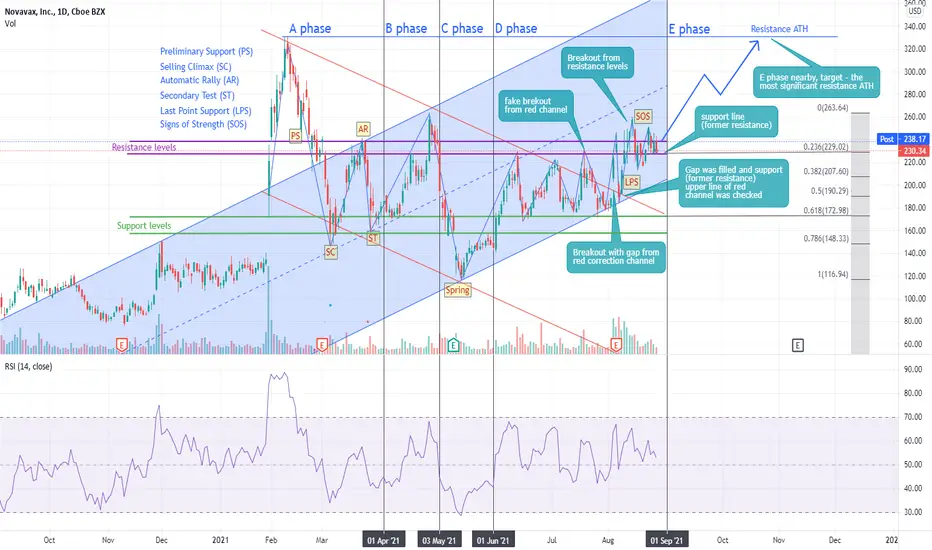
Novavax - Wyckoff MethodYou can read a good article about the Wyckoff method in the link below
academy.binance.com
How To Count Waves Patterns - AUDUSD Feel Free to like this video and comment down below if you have your thoughts and wish to learn more i have a lot of more videos planned out . Your Comments motivates me to make more helpful content for you - so basically in this video i break down how i analyse the chart i try to go step by step to give sort of like the idea or the feel

Today’s Notable Sentiment ShiftsHigh-Beta – AUD, CAD and NZD benefited from rising commodity prices on Tuesday, as markets set aside concerns about the spread of the Delta coronavirus variant. The notable outperformer in the commodities complex was oil prices, with WTI approaching $68 per barrel, up almost $2.50/+3% on the day.
Indeed, following today’s strong performance in WTI, TD Securities noted that: “With the impact on demand fueling chatter that OPEC+’s next monthly output hike could be delayed, and China’s “Zero-Covid” strategy appearing to have quickly contained the outbreak, crude oil could once again have a solid footing to challenge the $70s.”

📈📉How Market Cycles Work | Bull & Bear Market 🐿
All the financial markets are cyclical :
after a sharp and strong bullish trend always comes a severe bearish rally.
After panic & massive selloffs, the market tends to recover and awakens optimism closing a vicious circle.
Watching carefully how the price acts during these cycles, an observer can identify the recurring stages .
#1 Accumulation
The accumulation stage starts once the market finds its bottom.
Bearish pressure weakens and the market starts trading in sideways.
While the crowd remains cautious, smart money like banks and hedge funds start buying the asset considering that to be undervalued.
It leads to occasional moderate spikes of a price.
Being the best time to buy the market, the accumulation stage is the hardest to spot correctly. Global pessimism and disbelief make the investor scared to buy the asset.
#2 - 3 Public Participation & Excess Stage
The accumulation stage and the actions of smart money make the crowd buy the asset steadily. Pushing the market to new highs and generating sufficient profits, the crowd brings more and more liquidity into the market.
Bullish trend is universally confirmed.
The optimism steadily transforms into euphoria and the asset quickly becomes overvalued. Greed starts to dominate the crowd. Record highs are reached and no one doubts further growth.
#4 Distribution
At some moment the market stops growing. Even though everyone is very confident in a bullish continuation, the market naturally refuses to grow.
Moreover, the market starts to slow down and volatility drops steadily.
The market starts ranging and trade in sideways.
Smart money starts selling their positions steadily to a greedy crowd.
#5 Bearish Trend
With an absence of growth, more and more market participants start selling the asset. Optimism steadily vanishes and pessimism comes into play.
Contemplating negative figures, the crowd starts to panic, making the market fall sharply.
The outlook is dark and no one believes in recovery.
Then the market suddenly starts slowing down and the cycle repeats.
Watch how the price acts, learn the price action & master the market cycles to benefit from any of them.
❤️ Please, if you enjoyed this article, like it and share your feedback in a comment section. Thank you! ❤️

AUDUSD - How To Trade This Channel! 😍 📚AUDUSD is in a really nice channel where price is respecting both the limits of the channel. We saw a nice bounce off the channel support and looks like we'll be heading towards the channel resistance very soon.
The basic rules of trading within a channel are the following:
- Buy on bounce off channel support
- Sell on rejection off channel resistance
- Stoploss outside of the channel
- Targets should be the outer limit of the channel
** For descending channels, the move down will always be bigger than the move up
** For ascending channels, the move up will always be bigger than the move down
Do your best to identify channels in your trading - easy trades!
Goodluck and as always trade safe!

FCPO Trading SchematicThere is 3 type of price reaction towards SnR
i) Rejection
ii) Breakout
iii) False breakout
How to trade (i) rejection @ M15?
1. Price close with reversal CS - long wick
2. M5 has engulfed at least 60%
3. Set Limit order near the neck of close M15 CS.
How to trade (ii) breakout @ M15?
1. Price close outside the SnR
2. 2nd CS also close outside SnR
3. Entry after rejection @ M5
How to trade (iii) false breakout @ M15?
1. Price close outside SnR
2. 2nd CS close inside SnR
3. Immediate entry after 2nd CS close.
4. Usually the aftermath range is the biggest after price consolidation.
Another addition entry is Rejection-continuation :
1. Always happen in strong trend as a pullback
2. CS rejection @ M15
3. CS engulf @ M5
4. Immediate entry after rejection CS close

BankniftyHey viewers! Banknifty trying to sustain above 35000 level we should long with small SL giving levels.. For this week

NVDA, Continuation of correction or making new ATH ?Is NVDA on the way to make a new ATH or correction still continues? We have to follow.
NVDA is a beautiful example of different scenarios possibility! If we look at the chart (right side) we simply may consider that correction is completed at 0.382 Retracement of last rally with clear abc form of correction but, is this the only possible scenario? Of course NOT
Flat corrections may mislead many traders. Being aware about flat corrections and its characteristics is necessary but not enough at all.
Being realistic is a key. We have to consider all possible scenarios and control our emotions. Traders who are long from the last low may not want to see the other possible scenario. They certainly wish to see new ATH but it may takes some more time than they expect!.
On the left side of the chart we can see the flat correction. In a flat correction wave (a) is a 3 leg wave. wave (b) typically goes above 0.618 Retracement and touches 0.786 and even goes higher to 0.88 Retracement . Then, when every one expect a new high it suddenly goes for a 5 leg down wave (c).
Which scenario is going to happen? No one knows. We have to use some risk management tools to manage our risk . Of course opening a position at such conditions is gambling not trading.
We always trade objectively and try to see all possible scenarios. Don't we?

NIFTYChart clearing is necessary for understanding the market structure for trader community... Its 15 min candle 🕯 📊 chart
