Analysis way - Buyers Vs Sellers ShiftsAnalyzing buyers vs sellers .
Very simple way of analyzing and trading supply demand in its purest form.
Identify where buyers has stepped in and showed interest in price and where is potential that they can step in again.
Identify where sellerss has stepped in and showed interest in price and where is potential that they can step in again.
Drop timeframe lower and -
1. see that for example Buyers are defending that level. and there is interest of buying.
2. identify shift of buyers vs sellers. see that the buyers have won battle against the sellers.
Price target: In uptrend price keeps breaking highs consistently. Once this stops and market keeps breaking lows trend changes. This highs and lows act as price target that If trend would continue price should hit and break higher.
Shifts: Shift where buyers won the battle against sellers and via versa.
Wave Analysis

Accumulation scheme We got different phases within this accumulation zone ranked from A to E. It starts with phase A is all about the end of the downtrend with often high volume and a big sell off. phase B serves the function of “building a cause” for a new uptrend. The main sign of this phase is an accumulation of positions by institutions. Phase C is the zone where we see a lot of testing and the zone where you want to look for opening positions long. You can see a lot of fake-outs in this phase where the weak hands will get stopped out. In phase D we looking for signs of strengths were prices are breaking out of its previous levels and then retests. In phase E of Wyckoff accumulation, the market leaves the TR, demand is in full control, and the markup is obvious to everyone

How an "Ending Diagonal" really forms and what it meansI've written most of the tutorial on the chart. Some will just call this a different form of a triangle. But I find this to be my favourite pattern of all and when they are clear, there is no doubt on the reversal They happen most often at the top of wave 3, because they form as a battle between Bulls and Bears. (or vise versa). I remember when I spotted my first one about 14 years ago and the incredible powerful turn that ensued. I thought it was magical.

Wyckoff theory and Volume tradingHere is a breakdown on LTC because some have complained about my call to short LTC. I have not changed my bias. I want to give an example of the phases as I see it now and what I am looking for before I go LONG. This will be interesting for breakout traders since they usually don't realize that the break and retest trade is contained within phase C and may or may not contain a spring. But when it does it is a type 1 schematic and we see it pinpointed with a volume pattern we call the stop hunt pattern. Currently we are in Phase B.

What constitute a trend... While going through the popular ideas in trading view, I come across MATIC and I felt I should share my wave count on this coin. While the publisher uses conventional technical analysis it is worth mentioning that it come with a lot of shortcomings which the wave principles did indeed provide. For example, the region highlighted in green does does constitute a valide trend and as such we dont expect to see trending price action in coming days. I will recommend you look for lower price action and possibly correlate it with BTC that way you increase your chances of success.

Are You a Swing Trader or Investor? You Need to Watch ThisHi Everyone! This video is not necessarily regarding crypto investing. This video is EDUCATIONAL for ALL TYPES of asset classes. Meaning, this also goes for the FOREX trader, Tech Stock Trader, Industrial Stock Trader, Commodities Trader, FUTURES Trader, INDEX Trader, etc... This WILL be "worth" your VALUABLE TIME... Trust me...
Happy Trading and Stay Awesome!
David

📚#e02 : A Journey Of Inversion ♋ Bond Masters💰Of Us All ⚖️💫An Education
Series Continuation
Episode One Found
In Content Below
Starblazers 🌠
Dreamscapers 🧙🏼♂️
Rebellion 🧗🏻♀️
Join Me On A Journey Of Mastery
Utilising The Instruments
Symbolising Our Servitude
Slaves Will Topple Masters
Behold.. The
Ultra Bond Future 🗽
US 30 Year Yields📊
📚#e01 :
CBOT:UB1!
TVC:US30Y

My current hourly strategy.This is the strategy I've been using lately to trade FTM and ONE on the hourly chart.
1. Price is below 200 EMA.
2. ATR down trend.
3. Bollinger Band squeezed.
4. Price crossed below EMA ribbon.
5. WaveTrend Reversed down.
Over the past 50 trades, this strategy has won 33 times and lost 17 times.
I usually use 1:1.5 RRR but for this particular trade and others with the same congruence and strength I would go up to 1:2.
You may even consider taking 50% at 1:1.5 and 50% at 1:2.


SPX500 - Complex correction should give way to new lowsThis move up is most likely a complex correction. (multiple zigzags). As such, when the lower line is broken it should lead to lower lows. The question is just how low and will that lead to a break of the greater trendline or a bounce and return to the uptrend. We will probably know in a day or so.
The alternate scenario is that this is a leading diagonal and prices will just go higher without much retrace drop. But this view is not my favoured view right now.
More fireworks coming tomorrow folks!

SIMPLE FLAG FORMATIONThe MTN Group is forming a simple correction pattern that is the FLAG.
I expect the flag to break anytime and the upward impulse to continue.
Targets remain at Rands 20K.
Good luck

US Markets not quite ready to crash... Elliott Count?Well... maybe and maybe not.
If you have seen my previous posts I have been speculating that the drop is not so clear just yet and this may be a complex correction as is common in wave 4.
Right now it's a double ZigZag and could be forming into a triple one.
All this to say that the current price is once again in no-man's land. I'm watching mostly for a ZigZag down to the bottom of the channel. BUT I won't be surprised by a move up. We may yet get that Santa Claus Rally.
Up or down from here is a bit of a roll of the dice.

Trader's behavior towards price All traders' behavior is embedded and reflected in the movements of market prices, as a trader you must always endeavor to take a step back and try to separate yourself from the noise. This is best achieved by considering the history of price and current live price action to try to measure where the next prices are most likely to be heading. This is why PRICE DATA OF USDCHF JUNE 1994 to OCTOBER 1995 was Double zigzags making a correction deeper. Then price moves with 5 impulsive from NOVEMBER 1995 to SEPTEMBER 1997.
Learn the following ratio of Fibonacci Level you need to determine the point of Entry and Exit.
1.Wave 2 should end at 50%, 61.8%,76.4%, 78.6% or 85.4% of Wave1
2.Wave 3 use to be 161.8% of Wave 1-2 but it can also be 200%, 261.8%,323.6% of Wave 1-2.
3. Wave 4 should end at any of this level of Fib 14.6%, 23.6%, 38.2%, or 50% of Wave 3 but not more than 50%.
4. Wave 5= Wave 1 length or 61.8% of Wave 1-3 or 123.6%, 161.8% of Wave 4.

TAKE THAT NEXT TRADEHi Friends,
This post is for Educational Purpose only!!
Time Frames : 5 mins, 10 mins, 15 mins
Instruments : All Forex and Crypto Pairs
Market Session : All Sessions
Strategy Considered : Price Action Shift (PAS)
TAKE THAT NEXT TRADE
From my personal research i have seen that for a trending market, break of structure or shift in price action often leads to a big price movement moments later. Before i go into a trade, i normally ask myself a couple of questions;
1. How much is my balance?
2. How much do i want to risk?
3. Does the setup have a high winning probability?
4. Am i following my checklist? if yes, have i checked at least 4/6 of the items on the list?
5. What are my exit plans if i should take the trade?
If i am able to respond to Q3-Q5, then i will not miss that trades.
PAS Strategy Explained - Citing CADCHF (15m)
Price did not break first swing low, attempted to break the second one but failed. It eventually broke the third swing low then headed back to retest the order block that pushed price to that break. It makes sense to go in right at this point since 6/6 of my checklist have been ticked + Q3,Q4,& Q5 response is yes.
PAS Strategy give investors/ traders the opportunity to expose their capitals to low risks but highly profitable trade (in this case RRR of 1:8).
Take some time off to look at my checklist and the confluences which i have listed on the chart.
DO NOT FORGET TO LIKE, COMMENT AND FOLLOW ME.

Psychology of the market circle Hello traders!
Euphoria and Anxiety, Fear and Greed
Psychology of the market cycle
Any trader finds himself under the influence of changing market cycles. At favorable moments, investors feel joy and are overwhelmed with self-confidence. On dark days, the investor falls into despair and feels anxiety attacks.
The only way not to succumb to such an emotional influence is to follow the clear rules of a properly compiled system. Unfortunately, most traders have no plan and no strategy. In order not to become a victim of emotions, a trader must have an idea of the emotional stages of the market cycle.
Psychological stages of trading
An uptrend is a trader's emotions.
Optimism
When the market is growing, the trader sees an opportunity to earn and invests money. The economy is growing, the price is rising, profits are growing. At such a moment, the trader feels confident, begins to open new positions after each pullback, which eventually turns into a kind of instinct. At this stage, the trader begins to forget about the risks.
Enthusiasm and Abundance
The market is starting to accelerate. Traders experience pleasant feelings of joy and enthusiasm. The trader begins to lose his head, confidence overwhelms him.
Euphoria
After that, the last stage of the upward trend comes - Euphoria. Money comes very easily, the trader is overwhelmed with confidence in his actions and decides to open positions using leverage. At some point, the trader begins to think that he is a professional analyst, and it is not he who is following the market, but the market is following him. This stage in the market helps large investors to discount their shares to self-confident traders who buy everything in a row, believing in the continuation of the upward trend. In fact, this phase is the most risky, after which the trend is reversed.
Emotional stages of a Downtrend in the market
Anxiety
The price is starting to slow down, there are fewer and fewer sellers, bears are gaining momentum. For a trader blinded by luck, this phase looks like another correction. But the market can no longer create new highs and falls, forming new lows. Such a fall creates anxiety in the trader's soul, easy profits begin to melt.
Denial and Fear
Fear fills the market, traders are afraid to be wrong, because recently they ruled the market. At this stage, the trader denies that he is wrong and tries in every way to justify holding unprofitable positions. Like any beginner, a trader believes that sooner or later the price will not only return, but also go beyond the maximum. Denial brings the trader to a state of helplessness and inaction, from misunderstanding of the situation on the market. The trader gets lost, not knowing what to do and waits without knowing what, without closing unprofitable positions.
Despair and Panic
The price continues to fall, and the trader falls into despair, because the confidence in holding a losing position is already beginning to disappear. This phase is the most painful, because the severity of losses presses too hard to stay calm.
Surrender
The unprofitability of the position is increasing, traders can no longer tolerate this pain. In this phase, traders have to capitulate just to stop these torments. Traders are starting to close positions and it is here that large companies are included, for which this moment gives a new opportunity for large profits. Asset buying begins, because a reversal is possible soon.
Despondency and Confusion
As it often happens, as soon as a trader has closed a position, the market begins to grow. It looks like the law of meanness. This phase drives the trader into despondency, because the position was closed a moment before the rise. It is here that newcomers begin to think about whether it is worth investing further.
Hope
The market is starting to revive. The price shows new highs and the investor has hope. It seems that here it is, a new opportunity. The trader begins to enter the market, forgetting about the past, without drawing conclusions. A trader enters the market when the price has already accelerated, at points where the risk is again close to a critical value, the cycle begins again.
Traders should keep this cycle in mind. Such emotional roller coasters can ruin anyone. A well-designed strategy can help avoid these painful blows.
Remember the risks, remember the cycles, work on the mistakes, and victory will not take long to wait.
Traders, if you liked this idea or if you have your own opinion about it, write in the comments. I will be glad 👩💻

USDJPY - Combination of Three Harmonic Pattern* Gartley Pattern
* Shark Pattern
* Butterfly Patern
The three patterns are inside the inverted symmetrical triangle pattern .
"TA is just a probabilistic analysis- not certainty. Everything is possible. The analysis just points to what is likely probable. TA is not 100% correct." - George Tan

ALGO and Dow Theory Trading Strategy (CRYPTO VERSION)
The accumulation phase is the starting point of a new trend where the smart money is buying into a stock.
Then we start pushing up which attracts the eye of the general public aka the retail traders.
At this stage, everyone starts to pile in before we reach a climax point.
Uninformed investors continue to buy while at the same time smart money sells their stocks which forms the distribution phase.
Ok.look at the Algorand chart. Are we in the second part of the story?

How to Track Liquidity and Trade Them? | Sell_Side Buy_Side |Ever thought a price moves because it's on support level or below a resistance level? Or because your favourite indicators show a buy/sell signal and you want the price to see the same and move in you favourite direction? A Big No, dear. That simply won't happen...
The main gyrator of the market is "Liquidity"
What is liquidity?
Liquidity, in very simple terms, is where stops are. And that's (mainly) below relative equal lows or above relative equal highs... So you're now maybe thinking, "well, that's why I get stopped out just before the price moves violently in my previous direction.."
Exactly, that's it... Learn how to see where liquidity is resting and how to to become engaged in a good trade...
That's exactly what I want you to do...
And here is one lesson of many that I will post.. in addition to live calls when I see high-probability setups... I will turn your eyes to it...
Ther are a lot more to come, so don't forget to ▶️ LIKE ▶️ FOLLOW to keep updated with everything I post..
Let me know in the comments what you wanna be the second lesson on..
Good Luck&Be Safe

EW Projection for Bull Rally: You sure you want to short this?!Be really careful about placing bets against this monster. The end phase of bull markets are always characterized by explosive panic rallies.
Been rising for 12 years. Fed gonna raise rates >1% next year, probably gonna get a 50 basis pip pop in spring or summer, inflation unchecked. Read Friday's NY Times for a very insightful article on when, why and how much interest rates will rise; projecting mortgage rates to rise >1% in 2022.
Most traders now alive have never seen a secular bear market. That's a period when prices just decline for years, or churn aimlessly, no one wins.
Bear markets that last for 3-6 weeks are not real bears, lol. They are mini-bears, bear cubs or just a mild hangover before the buying begins again.
In a real bear, the buying does NOT begin again. Prices decline, and then drift further down; and do not bounce. This is not here YET, but SOON IMO.
BUT, before the Bear, we should expect a last hurrah for the old Bull, and shorting it will be a widowmaker. Do not get killed, please!!
So much for the lecture, here's the Education part of this idea it's about using all the tools you can to make educated guesses about price direction; we have Elliott waves, RSI, MAs, and Fibonacci retracement and projection extensions as possibly useful analysis tools, any and all of which can and will fail us:
Elliot wave theory suggests that we have a completed or near completion 3rd wave, the longest and strongest wave of an impulsive movement.
Beware! EW projection is an arcane art and no one can really 'see' these waves until after they have passed... you do NOT know where you are in the wave when you're in it! Forecasting of EWs is purely speculative guesswork, and totally subjective; "Where do I number my waves, guru?!"
Disclaimer: As you know, Ralph Nelson Elliott was an accountant and math genius whose insight into market behavior led to his uncanny prediction of the bottom of 1935 mini-bear that followed the Crash of '29 (a bear that lasted until 1932...!). His theory is only a theory, and many forecasting services exist pretending to anticipate what the market will do next, but in fact underperform index funds. Still fascinating though!
RSI is overbought, but can get MORE overbought (see prior posts about why we do not enter shorts purely based on indicators!); expect some consolidation and price weakness before moving higher; the Fibonacci 1.272 extension of this rally leads to price 4614, after pullback to a higher low.
Market trades now more than 3SD above the 200 DMA, more than 2SD above the 50DMA; a pullback is very likely in these conditions. the 20DMA may be support.
Disclaimer: As you know, Fibonacci is a dead Italian math genius, these projections based on nothing more than number theory are pure necromancy but sometimes can be coincidentally correct, like a stopped clock that's right twice a day, lol.
IMO 4682 is on the table at the next Fib extension. Expect weakness in the last week of October; and new ATH again in November, barring surprises.
A sharp pullback is likely to follow the ATH, if and when we get it. So uncertain now, just a mad gamble TBVH.
NB: A zig-zag pattern is still possible, some of the fiercest rallies precede the most bearish cascades; or a Cup & Handle may form, if so, the Handle typically will pullback half the height of cup wall, would be ~80-100 pips, so price around 4460-4480 is a likely a buy zone to re-enter. ANY or NONE of these possibilities might emerge, which makes stock speculation so wildly exciting! Be cautious, do not overtrade, use sensible position sizing!
I am not entering a position or making any recommendation to take any position here. Pure WAGuess IMO; this is purely for your amusement, and hopefully enlightenment. GLTA!

Power of Small Consistent EffortsHello Traders, 👋
Today I would love to talk all about the power of putting in small consistent efforts. Furthermore discuss the power of compounding and compound interest.
Putting in small consistent effort is ideal for anyone, regardless of experience.
Whether you are new to trading, trade forex, trade crypto or even want to find a new hobby 🏑🏓🎺🎸
1.00
The first equation is simply the number 1 raised to the power 365.
The power 365 simply means 1 x 1 x 1 x 1 etc... 365 times. Anything multiplied by 1 remains unchanged, so the result is 1.
But what happens if we add 1% to that?
1.01
1% bigger than 1 is 1.01.
So if we take 1.01 and we raise that to the power 365 — so in other words, we multiply 1.01 x 1.01 x 1.01 x 1.01 etc... 365 times. You will be surprised that it equals 37.8 notice that this is almost 37 times bigger than the answer to the first equation above! 🤯
This is the result you’d get if you “did just 1% more than usual”.
The difference in effort is just 1% a day, it’s tiny!
If you can work on your trading 1% more than you are currently doing, every day. You will end up with a considerable amount of impact from that work.
Whereas if you don’t do that little bit extra every day, you will be making zero progress and contain the same knowledge as you did a year ago, maybe less.
Little steps, done consistently time and time again, compound into big, big differences. And not taking those little steps, makes the effect almost disappear.
"Compound Interest is the Eighth wonder of
the world.
He who understands it... Earn it.
He who doesn't... Pays it."
~Albert Einstein
In simple terms compound interest is earning interest on your interest.
For example
If you was trading with $1000 and you made on average 10% per month, you would reinvest your earnings each month to make interest on them. This is called compound interest.
+++++++++++++ Profit/Interest
Month 1 $1100 +$100
Month 2 $1210 +$110
Month 3 $1331 +$121
Month 4 $1464 +$133.1
As you can see each month your profit is increasing. This is because you are making profit on your profit.
The earlier you start compound interest the better. This is something millennials should learn in school!
I know most people want to jump on the million dollar deal and get rich quick.
But if you took a single penny and doubled it everyday, by day 30, you would have $5,368,709.12.
However, it's important to note that it's all about the power of doubling. If you asked the same question, but changed the doubling time to just 27 days, you would only have $671,088.64
If you are struggling on your trading journey, do not give up!
****The first step of every successful Trader : FAILURE****
Do not let a little failure scare you away from being consistent.
Thanks for taking the time to read my post! 💖
Please check out my other trade ideas!
🐱🏍🐱🏍🐱🏍

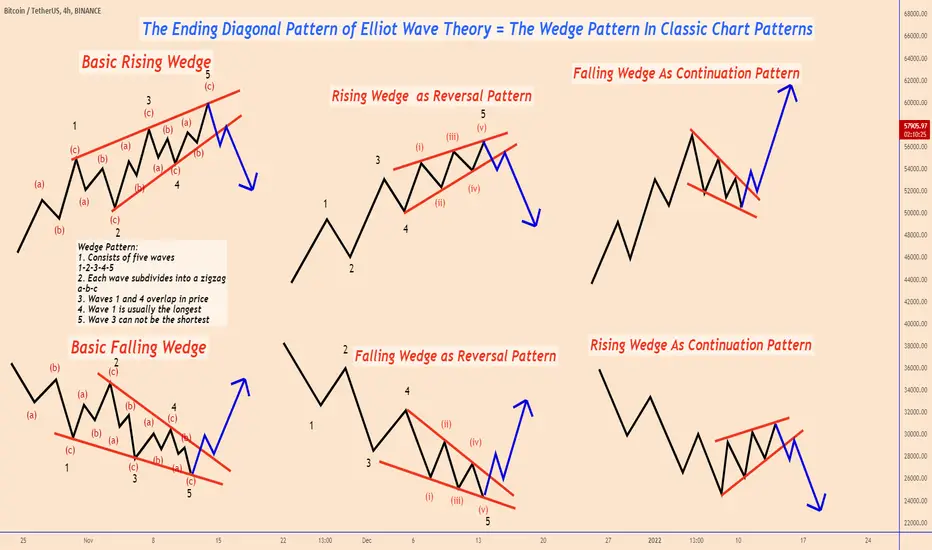
Wedge Pattern: Reversal & Continuation PatternThe Ending Diagonal Pattern of Elliot Wave Theory = The Wedge Pattern In Classic Chart patterns
Basic Rules For The Wedge Pattern:
1. Consists of five waves
1-2-3-4-5
2. Each wave subdivides into a zigzag
a-b-c
3. Waves 1 and 4 overlap in price
4. Wave 1 is usually the longest
5. Wave 3 can not be the shortest
The "Wedge Pattern" can be found as a "Reversal Pattern" or a "Continuation Pattern"
A "Rising Wedge Pattern" created during an uptrend works as a "Reversal Pattern"
A "Rising Wedge Pattern" created during a downtrend works as a "Continuation Pattern"
A "Falling Wedge Pattern" created during a downtrend works as a "Reversal Pattern"
A "Falling Wedge Pattern" created during an uptrend works as a "Continuation Pattern"
"Thumbs Up" If you found this content useful😀
Thank you and Good Luck!
FALSE BREAKOUTS | SPOT/AVOID/TRADE THEM LIKE PRO📈📉
FALSE BREAKOUTS | SPOT/AVOID/TRADE THEM LIKE PRO📈📉
How often have you opened a key level breakout trade, and then the price turned against you? False breakout happens quite often and it is a problem for many traders who buy at highs and sell at lows.
❗️Breakout trading is a fairly popular and viable trading strategy. However, some breakouts often turn out to be false. This can be quite frustrating, not to mention that it can often lead to a losing trade.
However, in many cases, an experienced trader can analyze the market situation and react to it accordingly. False breakouts can make a profit if you know how to trade them correctly.
⚠️A false breakdown is a situation when the price violates an obvious level, but then suddenly changes direction. When the initial breakout of the level occurs, many traders open a trade in the direction of the breakdown. These traders are trapped when the price reverses, which triggers a series of stop losses. New traders are also entering the market, and this puts additional pressure on the price. This often turns the price into a new trend, the opposite of the initial breakout.
A breakout that turns out to be false is a sign of strength in a downtrend or weakness in an uptrend.
As you can see, a false breakout can easily cause significant losses for any trader.
Some traders develop their entire strategy around trading false breakouts, as this can be a very powerful trading approach. Some of the best trades happen when market players fall into a trap and their stops start to work.
✅How to find patterns of false breakouts?
🟢If you do not learn how to correctly identify false breakouts, you will not be able to trade them profitably. For example, there will be situations when the price returns to the breakout point, and only then continues its movement.
🟢One of the ways to detect false breakouts is to monitor the volume. Real breakouts are usually accompanied by strong indications of trading volume at the time of the breakout. When this volume is absent, there is a higher probability that the breakout will not happen.
🟢Thus, if the trading volume is low or it decreases during the breakout, a false breakout is likely to occur. In contrast, if the volume is large or it increases, a real breakdown is likely.
🟢It is also useful to monitor not only the trading volume but also the price movement on the lower timeframe. In many cases, you will see that the price makes a very sharp pullback on the lower timeframe, which is not visible on the higher timeframe.
✅False Breakout Trap
🔴After all, many trading textbooks say that a breakout can be considered confirmed when a candle closes above the resistance level. However, the price moves in your direction for a while and then turns 180 degrees. As a result, you have a stop loss triggered.
🔴The false breakout trap includes several candlesticks, usually 1-4, that go beyond the key support or resistance level. Such breakouts occur after a strong movement, as the market has reached an important level, but the price momentum still retains its strength.
Have you ever been trapped by a false breakout?

Advanced way To Trade A Flat Correction | Elliott Wave TheoryFlats are uncommonly traded correction patterns on the Elliott Waves Traders Communities. I go over The in and outs of the flat correction. Wave A is a correction, wave B is a correction, and wave C is a motive wave.
