Pattern recognition: Ending Diagonal Triangle. The recent price action of the US Dollar Index (DXY) appears to me to be a excellent example of what in EWT is called an Ending Diagonal Triangle. In EWT normally the 5th wave is composed of 5 sub-waves that do not overlap. (Which in this example I have labeled .1,.2,.3,.4,.5). But in this type of ascending triangle formation they do overlap and each sub-wave often has an a-b-c appearance i.e. composed of 3 waves.
For more information see the pattern expert Thomas Bulkoski:
thepatternsite.com
Wave Analysis

Heikin-Ashi system caught the bitcoin move spot on If you were trading my Heikin-ashi system during this bitcoin accumulation zone, this would’ve been a perfect long opportunity.
All signs were directed towards a bull run.
Bullish heikin-ashi doji formed after an impulse leg down, a bullish fractal appeared on the bullish hammer candle that started the move. The stochastic was in an oversold range and started to head up on the heikin-ashi doji.
With a system, always make sure that all signs are ticked before making a trade, in this trade all signs were ticked and therefore this would be a good trade to make at the time. Discipline is key and do not enter trades if something does not feel right about the price action or your system does not fully follow.

💨𝙀𝙒 𝙋𝙖𝙩𝙩𝙚𝙧𝙣: 𝙈𝙪𝙡𝙩𝙞𝙥𝙡𝙚 𝙕𝙞𝙜𝙯𝙖𝙜🌊●●● 𝙈𝙪𝙡𝙩𝙞𝙥𝙡𝙚 𝙕𝙞𝙜𝙯𝙖𝙜 (Mult.Z)
Keep in mind that an triple zigzag is rare
❗❗ 𝙍𝙪𝙡𝙚𝙨
● A Multiple Zigzag comprise two (or three) single zigzags separated by one (or two) corrective pattern(s) in the opposite direction, labeled X . In the first case, it is called «double zigzag», in the second - «triple zigzag» (The first single zigzag is labeled W , the second Y , and the third, if there is one, Z .)
● Waves W , Y and Z are always single zigzags .
● Wave X never goes beyond the beginning of waves W and Y .
● Wave Y always ends past the end of the W , and wave Z , if any, always ends past the end of the Y .
● The first X wave always ends on the territory of the W wave, the second X , if any, on the territory of the Y wave.
● In a triple zigzag, the first X wave is always a zigzag, flat or combination . The second X wave is always a zigzag, flat , triangle or combination .
● In a double zigzag, wave X is always a zigzag, flat , triangle , or combination .
● Double and triple zigzags replace single zigzags , but cannot appear as W , Y , or Z waves.
❗ 𝙂𝙪𝙞𝙙𝙚𝙡𝙞𝙣𝙚𝙨
●In a double zigzag, wave Y can equal wave W , .618 wave W , 1.618 wave W , or .terminate at a distance equal to .618 wave W past wave W . In a triple zigzag, there can be equality among waves W , Y and Z , or wave Z can equal .618 wave Y , 1.618 wave Y , or .terminate at a distance equal to .618 wave Y , past wave Y . In a triple zigzag, the Fibonacci relationships between waves W and Y , would be the same as a double zigzag.
● The Fibonacci relationships between waves W and X in a double zigzag, and waves Y and XX in a triple zigzag are analogous to the relationships between waves A and B in a single zigzag .
● In a double zigzag, as a guideline, wave b of wave Y should not break the trendline that connects the beginning of wave W with the end of wave X .
● As a guideline, wave X (second wave X of the triple zigzag) of a double zigzag should break the trend channel formed by the first zigzag in wave W ( Y ) and be greater than 80% of subwave b of wave W ( Y and Z ).
● When a zigzag appears too small to be the entire wave with respect to the preceding wave (or, if it is to be wave 4 , the preceding wave 2 ), the complication of the structure to a multiple zigzag will probably follow.
Elliott Wave Principal 2005 and Q&A EWI .

BTC- 4 TH WAVE CONSOLIDATION DETAILED STUDYEven though i tried my wave count to convince the BTC bulls, it is not possible for me to deviate from NW rules in time cycles.
Wave 4 has to to take equal time as wave 3 taken, if you apply this rule ,we have more time left to finish wave 4,
So far wave 'A' of wave 4 completed in 5 waves (wxyxz), therefore wave B will resume fastly ,DON'T assume it as 5 th wave
Because after wave 'B', BTC bears will start selling to complete the final wave 'C' until 25th OCT,2021.
Since wave A is 5 segmet(motive) waves,the retracement of B is limited to 61.8%(47895)(2nd AUG)
Wave C must be of 5 wave down after wave B with a minimum target of 25300.
Hence 5 th wave will resume from NOV,21

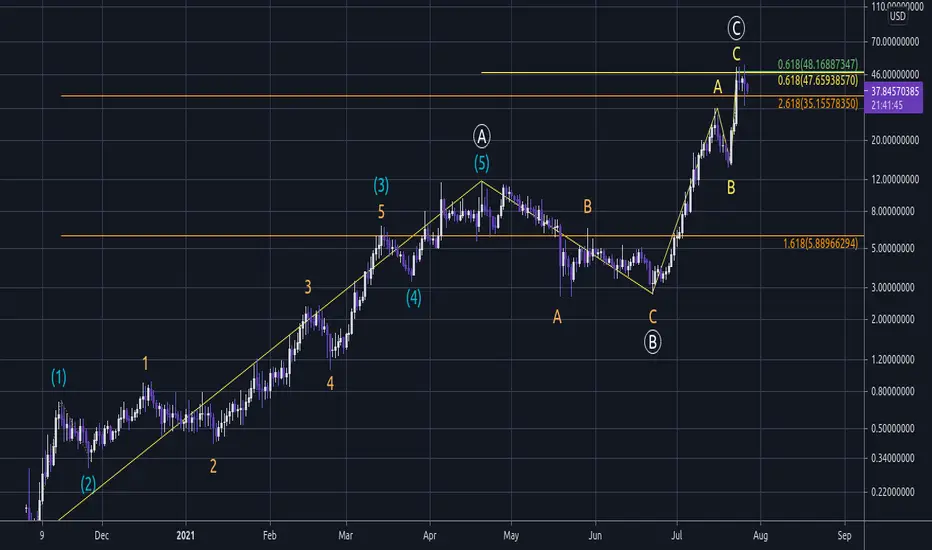
AXS - A Wave Unique To CryptoIn crypto there is wave structure that doesn't exist in standard elliott wave literature and AXS is a chart useful to show this.
Crypto volatility is much higher than markets observed by Ralph Elliott, especially in Altcoins that can be much more volatile than Bitcoin.
Higher volatility encourages different wave structure.
And there is a wave that only exists in the more volatile; Altcoins.
It has 3 sub-waves and is much more impulsive than a conventional 5 wave count.
Because it is a 3 wave I use "ABC".
It often has a ratio of 1:0.618 from A:C where the C wave is a blow off top.
With AXS - the higher degree ABC and the penultimate lower degree ABC both have the 1:0.618 ratio.
On the chart:
The A wave is comprised of two lower degree 5 wave impulses in a pattern called a "1-2,1-2".
The B wave is a standard 3 wave retracement.
The C wave is a surging impulse comprised from a lower degree motive ABC. It is much more volatile than the A wave.
The penultimate lower and higher degree C waves form a giganteum grand-finale $38 impulse.
- A motive 3 wave unique to crypto.
THE TREND IS YOUR FRIEND,BUT HOW TO ACCURATELY DETERMINE THE WINMany of us have been taught that the trend is our friend and we should trade in the direction of the trend.As we have eventually discovered this is easier said than done.I am a Mechanical Engineer by profession so i was inclined to find an excellent way to determine the trend of a market,forex currency pair, cryptocurrency pair or a stock.

EDUCATION - TOP REVERSAL PATTERNS ⚡At the end of a trend, there is a typically a reversal pattern indicating to us that the trend is about to reverse. There are 3 main patterns that you NEED to know.
1. Double Top/Double Bottom
A double top/bottom pattern is a chart pattern that consists of 2 consecutive peaks of similar height indicating that there is not enough buying/selling pressure to surpass the extremes of the price. This leads to a reversal in trend.
Double top is a bullish to bearish trend reversal.
Double bottom is a bearish to bullish trend reversal.
For a safe entry, entry would be after the break of the neck line (the last swing point) which is a confirmation that the it is a valid double top/bottom pattern.
Double Top:
2. Rising Wedge/Falling Wedge
A rising/falling wedge is a chart pattern that occurs when price is making higher highs and higher lows (in an uptrend – rising wedge) and lower lows and lower highs (in a downtrend – falling wedge). As the pattern progresses in the wedge, the range of the price contracts and is confined between 2 lines which get closer. Price eventually breaks out of the wedge and creates a reversal.
Rising wedge is a bullish to bearish trend reversal.
Falling wedge is a bearish to bullish trend reversal.
For a safe entry, wait for a breakout of the wedge to confirm the validity of the wedge pattern.
Rising Wedge:
3. Head & Shoulders/Inverse Head & Shoulders
A head and shoulders pattern is a chart pattern that appears as a baseline with three peaks. The outside two peaks (shoulders) are close in height and the middle is highest.
A normal head and shoulders is a bullish to bearish trend reversal.
An INVERSE head and shoulders is a bearish to bullish trend reversal.
For a safe entry, it is often advised to enter on the break of the neckline as that would be confirmation of the head and shoulder pattern.
Inverse Head & Shoulders:
Do your best to find them in your analysis!

Which High is ACTUALLY HIGHER ? Which Low is ACTUALLY LOWER ?Sometimes a series of HIGHS or LOW have virtually the same PRICE, … So what can a TRADER do ???
First a little back ground, In real simplified terms; The prices printed on the Russel Index (or any Index or stock) represents the Russel’s “intrinsic value” multiplied by the “relative value” of the dollar.
Therefor the background price action of the dollar actually distorts the price action displayed on the Russel index which is derived from stock dollar values.
Most of the time this distortion is negligible but sometime it’s not, .... particularly when the dollar has big swings or the index or stock is trading sideways or near bottoms and tops.
A simple trick to resolve this dilemma is to remove the influence of the dollar from the equation. You can do this in TRADING VIEW by dividing the index or stock by DXY.
This will then print for you a closer wave pattern resembling the real intrinsic value / momentum behavior of the underlying Index of Stock.
For example: Note the subtle changes on the Russel Index chart pattern from LEFT to RIGHT after the influence of the dollars was removed.
Hopes this helps.

💨𝙀𝙒 𝙋𝙖𝙩𝙩𝙚𝙧𝙣: 𝙎𝙞𝙣𝙜𝙡𝙚 𝙕𝙞𝙜𝙯𝙖𝙜🌊●●● 𝙎𝙞𝙣𝙜𝙡𝙚 𝙕𝙞𝙜𝙯𝙖𝙜 (SZ or ZZ)
❗❗ 𝙍𝙪𝙡𝙚𝙨
● A zigzag always subdivides into three waves.
● Wave A always subdivides into an impulse or leading diagonal .
● Wave C always subdivides into an impulse or ending diagonal .
● Wave B always subdivides into a zigzag, flat , triangle or combination thereof .
● Wave B never moves beyond the start of wave A .
● Wave B always ends within the price territory of wave A .
● Wave C almost always ends beyond the end of wave A . (failure to comply with this requirement is called «truncation» *
* Guideline, but should be followed as a rule
❗ 𝙂𝙪𝙞𝙙𝙚𝙡𝙞𝙣𝙚𝙨
● Wave C should not fail to reach the end of wave A by more than 10% of the length of wave A .
● In a zigzag, the length of wave C is usually equal to that of wave A , although it is not uncommonly 1.618 or .618 times the length of wave A (rarely 2.618 )
● Wave B typically retraces 38 to 79 percent of wave A .
● If wave B is a contracting triangle, it will typically retrace 38 to 50 percent of wave A .
● If wave B is a running contracting triangle , it will typically retrace between 10 and 40 percent of wave A .
● If wave B is a zigzag, it will typically retrace 50 to 79 percent of wave A .
● In a zigzag, if wave A is a leading diagonal , then we would not expect to see an ending diagonal for wave C .
● A line connecting the ends of waves A and C is often parallel to a line connecting the end of wave B and the start of wave A . (Forecasting guideline: Wave C often ends upon reaching a line drawn from the end of wave A that is parallel to a line connecting the start of wave A and the end of wave B .)
Elliott Wave Principal 2005 and Q&A EWI.


EOSUSD: A Successful Leveraged Position Guide I was waiting for Doge to reach for 1 USD when I heard that Mark Cuban shorted it! Strange! Right?! There are some important points to be noted here, but I would name it "Probabilistic Mathematical Approach to Trading" as follows (even the Psychologicals of Trading):
1. How Mathematically it was Probable for Doge to grow from 0.77 to 1 USD?
2. Mathematically how much more it could manage to grow - I mean in percentages?
3. We are being told about how risky it is to open leveraged positions. Yes! They are too risky and yet highly profitable.
4. Based on the 90,90,90 Principle 90% of trader lose 90% of their wealth during the 1st 90 days! It is meant to be profitable for professionals who know several things:
4.1. Capital/Money Management
4.1.1. Always save 30% of your available money for things that might happen and you have no idea of. You are going to need that money:
4.1.1.1. Firstly, your prediction on the direction in one certain "TIMEFRAME" might turn to be wrong. Then based on that timeframe you may spot some part of that money.
4.1.1.2. When things go wrong you will not go bankrupt.
4.2. Risk Management
4.2.1. You need to "CALCULATE" Risk/Reward Ratio just before any trade based on you Trading Timeframe. It cannot be more less 1/4. This is very important to consider.
4.2.2. Just consider KEY SUPPORT/RESISTNCE Levels/Clusters - Dynamically & Statically (short near a strong Resistance & vice versa)
4.2.3. With a certain amount of money which has already been dividend into say 3 parts you may Long as follows (see the chart):
* For every position calculate the Risk/Reward Ratio;
- Long at the current Market Price with 3 - 5X : price needs to drop 30 - 20% for you to be liquidated. I longed EOS at 3.29 yesterday. (targeted at 20USD)
- Set a Stop-limit long at a lower price which is overlapping at least 5% of your previous position. I longed EOS at 2.6 as well. (targeted the same)
- Propose the Worst Case Scenario now long it with 3 - 5X. How possible is it to happen? I longed EOS at even 1.34!!! (targeted the same)
This is "Technical trading Mathematics" I am talking about.
4.3. Psychologicals of trading
4.3.1. Psychology of Trading is a SCIENCE. You do need to study about it. Observe the behavior of your specific property.
4.3.2. The market is being Manipulated and has been so ever. There are people whose profit lays in your loss. But, exactly, how powerful are they to impact a specific property?! But the most average & common that has higher turnovers during certain periods of time. Market Cap/Turnover during a certain time interval.
4.3.3. When you are assured that Bitcoin is the most frequently traded one, for example, then you need to know exactly based on the timeframe you have chosen, how much it can be fluctuated?! For instance, in 4H timeframe basis. You need to know the extents of your chosen time frame.
How probable is it to lose all the money?
How probable is it to earn enough to not only compensate probable losses, but also earn much more?
5. Last and not the least, is Reverse Trading Strategy. Earn from long and then earn from shorts when it is the time to do so based on your Tradin Timeframe.
I do believe this way there would be no loss if you know the followings in summary:
1. Mathematically Trading
1.1. Money Management
1.2. Risk Management
1.3. Psychologicals of Trading
1.4. Technicals (the choice of trading time frame; the Elliots; Key Dynamic/Static Support/Resistance Clusters; Volume; Trendlines & Price Movement Channels)
Now, a question comes to mind: If my scenario is going to work for EOS how much loss and/or profit I will have? Provided that out of my calculations applied in sample trading positions mentioned above I win/lose one or two?!
Always remember that you need a predefined Investment/Trading Portfolio Management Plan which requires the followings (PMI PMBOK):
1. Knowledge Areas
2. Processes
3. Tools & Techniques
Some positions are meant to be considered "diamond handed" like a routine business operation, yet some others need to be like BPR Projects and they need to be timely & agile.
(This is a tricky business cause it has its roots in human greed & fear.)

Characteristics of Corrective WavesThis is an educational video covering the characteristics of counter-trend price action.

The 3 Types of Traders. Who Do You Belong To? 🤔
There are thousands of different ways to trade the market.
During the last 100 years, various trading strategies and techniques were invented.
One of the ways to categorize them is to split them by types of traders.
Such a category type will lean on 2 main elements:
trading frequency and time frame selection.
1️⃣ - Scalper
I guess 99% of newbie traders start from scalping.
Trying to catch quick market moves and become rich quick,
newbies are practicing different scalping strategies.
What is funny about scalping is the fact that such a trading style is considered to be the easiest by the majority while remaining one of the hardest in the view of pros.
The main obstacle with scalping is a constant focus and rapid decision-making.
Scalpers usually open dozens of trading positions during the trading session, most of the time being in front of the screen constantly.
Paying huge commissions to the broker and dealing with complete chaos on lower time frames, the majority simply can't survive the pressure and drop, leaving the pie to true gurus.
2️⃣ - Day Trader
Day trading or intraday trading is the most appealing to me.
Staying relatively active, the market gives some time for the trader for reflection & thinking.
Opening and managing on average 1-2 trades per trading session, the intraday trader is granted a certain degree of freedom.
However, with declining volatility, quite ofter intraday traders get a relatively low risk/reward ratio for their trades,
3️⃣ - Swing Trader
Swing trading is the best choice for traders having a full-time job.
Primarily being focused on daily/weekly time frames, swing trading is not demanding for a daily routine and aims at catching mid-term/long-term market moves.
With an average holding period being around 2 weeks and opening 1-2 trading positions per week, swing trading is considered to be the least emotional and involves low risk.
The main problem with swing trading is patience.
Correctly identifying the market trend and opening a trading position,
the majority tends to close their positions preliminary not being patient enough to let the price reach their target.
Which trading type do you prefer?
❤️Please, support this idea with a like and comment!❤️

WHAT HAPPENED LAST WEEK? | GOLD CASE STUDY
Dollar gains on upbeat US Retail Sales data.
Gold Slips from 1 month peak.
Gold case study of last week action using Wyckoff method, Market structure, Liquidity concept and SnD.

EDUCATION - Candlestick Cheat Sheet ⚡⚡One of the most powerful tools in your trading arsenal should be candlestick patterns. Various candlestick patterns can tell us where the market is heading.
These patterns can be found on all timeframes, however the Daily candlestick patterns appear to be the most reliable.
Once you see these patterns, you can ready yourself for the next move and use other tools to enter the market such as flag patterns, MA strategy - which we've covered before (See linked charts).

Elliot Waves Complete Guide | Chapter 4.6 - "ABC Fib Lengths"Hello Traders. Welcome to Chapter 4.6! This is FINAL CHAPTER of my Elliott Waves series that took me 6 months to create starting from chapter 1. Here we will finally conclude with learning about the "Fibonacci Ratio Lengths for Corrective Wave Multiples". In the previous sub-chapter, we learned how to apply Fibonacci lengths for waves 1-5, now we will learn how to apply them to A-B-C corrections. This chapter is related to chapter 3.1 (corrective waves), so it would be best to re-visit or master that chapter first.
📚 Chapter 4 Glossary:
4.1 Alternation
4.2 Channeling
4.3 Psychology
4.4 Fib-Ratio
4.5 Motive Wave Multiples
📖 4.6 Corrective Wave Multiples
-----
Corrective Wave Multiples for an A-B-C Correction Overview
"How to Calculate the wave lengths for waves ABC"
1) In a Zig-Zag correction (go back to chapter 3.1 if you don't know what a zig-zag correction is), the length of wave C is usually the same length and equal to that of wave A, as shown in Diagram ①. But other ratios like the 161.8% (again, commonly referred to as the 1.618 fib) or the 61.8% (.618 fib), also happens within its structure for determining the length of wave C.
2) This specific ratio can also be applied to the first and the second zig-zag in a WXY 'double zig-zag correction' that can be seen in Diagram ②.
3) In diagram ③, we have a flat correction that can also be measured via Waves A,B,C - which are quite equal; however, the extended flat correction from the beginning of Wave B to Wave C has different ratios applied. In this case, wave C often represents the 161.8% (1.618 fib) extension of wave A.
NOTE: the concept of measuring the waves should always be the second part when analyzing the markets. Do not expect to correctly measure a target for a wave, if the overall count is not valid and rules were broken. The fibonacci numbers are complementary applied to the Elliott Wave theory.
THANK YOU! Refer to every chapter below, and happy learning. In future posts, we will be learning how to apply them in a PRACTICAL sense to the real markets! But first, we must memorize these chapters by heart as these chapters are the foundation to the whole Elliott Wave Theory.
Trade Safe.
X Force

XBTUSD The Theory of the Wolfe Wave :
The theory of my Wave structure is based on a law of physics that for every action there is an
equal and opposite reaction.
This action/reaction often shows a definite rhythm with extremely valuable projecting
capabilities to the trained eye. Many times however, little waves mix with larger waves and the
waters become muddied. Sometimes everything is in synch and you will get a rogue wave effect
similar to what occurs in the oceans of the world. These can be extremely profitable in the
futures and stock market.
On the following two pages, you will find the rules and the theoretical, bullish and bearish
Wolfe Wave structures.
Rules for Bullish Wolfe Wave Structure :
Please not the odd sequence in counting, as you will see, it is necessary for the inductive
analysis. By starting with a top we are assured of beginning our count on a new wave. The 2
point is a top. The 3 point is the bottom of the first decline. The 1 point is the bottom prior to
point 2 (top), that 3 has surpassed.
The 4 point is the top of the rally after point 3. The 5 point is the bottom after point 4 and is
likely to exceed the extended trend line of 1 to 3. This is the entry point for a ride to the EPA
line (1 to 4).
Estimated Price at Arrival (EPA) is trend line of 1 to 4 at apex of extended trend line of 1
to 3 and extended trend line of 2 to 4. Estimated Time of Arrival (ETA) is apex of extended
trend line of 1 to 3 and 2 to
4. Trend line of 1 to 3 and trend line of 2 to 4 must converge.

TOTAL 2Days Cycles Hello Traders
As you can see in the chart above, every red circle represents an important area in my opinion. As it is seen candle bodies in 2D chart are somehow important. When price is closed lower than a lower line (blue lines in each area), or above an upper line (yellow lines), it continued its way in that direction, almost sharply.
This point of view may be used in further areas found in 2D TOTAL chart.
------------------------------------------------------------------------
What is your opinion? Comment below.
If you like the idea, please hit the like button and follow me so that you won't miss the updates. The information given is never financial advice. Always do your research too.
Good luck.
