Percentage StopsI reverse engineered the Renko Boxes and found a relative range. Using the Highs, the lagging stop is 2.2%, and same with the Lows. I separated the two, and it seems like a winning strategy: modern too. Also, my undeviated macd, and both derivatives.
Wave Analysis

TRADING ACRONYMS YOU MUST KNOW
Hey traders,
Here is the list of trading acronyms, every trader must know.
TA - technical analysis
FA - fundamental analysis
HOD - high of the day
LOD - low of the day
O/N - over night
52s - new 52 week high
B/O - breakout
BOS - break of structure
E/R - earning report
Pre - pre-market trades
AH - after hours trades
R/R - risk / reward
S/R - support and resistance
TP - take profit
SL - stop loss
YTD - year to date
ATH - all time high
HH - higher high
HL - higher low
LH - lower high
TF - time frame
MS - market structure
HTF - higher time frame
LTF - lower time frame
BE - break even
DD - drawdown
Be - bearish
Bu - bullish
HNS - head and shoulder
These acronyms are frequently applied but the proffessionals.
Do you know all these acronyms?
Please, like this post and subscribe to our tradingview page!👍

bullish and bearish cup and handle pattern hello dear traders,
Here are some educational chart patterns that you must know in 2022 and 2025.
I hope you find this information educational and informative.
We are new here so we ask you to support our views with your likes and comments,
Feel free to ask any questions in the comments, and we'll try to answer them all, folks.
What are the Cup and Handle chart patterns?
A cup and handle pattern is a pattern of price movement on a trading chart that resembles a cup with a handle, from which it derives its name. The cup section of the pattern is formed from a U-shaped price movement, while the handle is a short price channel from the edge of the cup. The handle is actually a pullback after the right Swing of the cup.
As is the case with other chart patterns, the cup and handle pattern shows you how the price has moved in the immediate past, which can help you predict future price movements. The time it takes for pattern formation varies: pattern formation can be as short as seven weeks or as long as 65 weeks or more.
There are two types of patterns: the more popular bullish cup and handle pattern that you can see in bull markets and the inverted cup and handle pattern, also known as the bearish cup and handle pattern, that you can see in bear markets.
In the bullish variant, which occurs in an uptrend, the pattern is formed by a downswing (pullback) that gradually turns into an upswing (in the trend direction) followed by a small pullback (a slight downward drift that creates a handle )
The reversal/bearish type, which appears in a downtrend, is formed by an upswing (pullback) that gradually turns into a downswing to continue the downtrend, but then pulls back (handle) a bit.
Understanding the structure and inversion of the cup and handle pattern
The cup and handle pattern can form in any time frame, but as a swing trader, you should focus on the daily time frame. To identify the cup and handle pattern or reversal type, you need to understand the price movements that form its structure. For example, to be a continuation pattern, there must be a prior trend before a cup and handle pattern can form. Let us look at both patterns one by one.
The bullish Cup and Handle pattern:-
An uptrend: For a bullish cup and handle pattern to form, there must be an established uptrend, but the trend must not be too mature because the more mature the trend, the less likely it is to continue. A trend on the daily time frame that is a few months old is fine.
Cup: The cup is formed from a normal bust that gradually curves upward, creating a "U" shape. It should have a bowl or round bottom and not a sharp "V" shaped bottom. The round bottom ensures that there is a consolidation pattern with valid support at the bottom of the "U" cup. In addition, the pattern on both sides of the cup should be of equal height, but this may not always be the case.
Cup depth: The cup should not be too deep. Generally, the cup depth should be around the 38.2% Fibonacci retracement of the previous advance. However, with overreaction in more volatile markets, retracements can range from 38.3% to 50% Fibonacci. In extreme cases, the retracement can reach 61.8% Fibonacci, which is in line with Dow Theory.
Handle: This is a pullback that forms after the higher forms on the right side of the cup. This is a minor pullback or consolidation that sometimes resembles a downward-sloping flag or pennant. This is just a small, final consolidation/pullback before a bigger breakout, but could lead to a retracement to the 38.2% Fibonacci retracement of the swing high of the cup. The smaller the retracement, the more bullish the formation and the more significant the breakout.
Duration: While the cup can last from 1 to 6 months (or several years on a weekly chart), the handle can take about 1-4 weeks to form.
The bearish/inverse Cup and Handle pattern:-
A downtrend (bear market): There must be an established downtrend for the inverted Cup and Handle pattern to be meaningful. However, the trend should be relatively young as downtrends don’t last that much. On the daily timeframe, the trend should be from a few weeks to a few months.
The dome (inverted cup): The dome of this pattern is formed by a normal price rally in a downtrend (pullback), which gradually turns to a downward swing, thereby forming a dome shape. It should have a rounding top and not a sharp pyramid top. A rounding top ensures that the inverted cup is a consolidation pattern with valid resistance at the top of the structure. Both sides of the dome may or may not have equal lows.
Dome height: The dome should not be too high. Usually, the height should be about 38.2% Fibonacci retracement of the preceding downswing, but the retracement could range from 38.3% to 50% Fibonacci in more volatile markets with over-reactions. In extreme situations, it could be up to 61.8% Fibonacci.
The handle: This is a slight pullback that follows the downswing that forms the right side of the dome. It is a small consolidation that often looks like a bearish flag or pennant that slopes upward. The handle can retrace up to 38.2% Fibonacci of the dome’s swing down, but the smaller the retracement, the more bearish the formation and the more significant the breakout.
Duration: The dome may take about 4 to 6 weeks or more to form, while the handle may take about a week or two.
How to trade the Cup and Handle chart pattern:-
The Cup and Handle pattern and the inverse type are potent trend continuation signals. When you see any of them, you have to trade in the direction of the trend. While you can trade these price action chart patterns on their own, it may be wise to confirm the trend with some tools, like trend lines and moving averages.
Trading the bullish Cup and Handle pattern:-
The bullish Cup and Handle pattern forms an uptrend and gives a bullish breakout signal. You might have to fix an uptrend line or a moving average to confirm the trend. Here is how you trade the pattern:
Entry:-
With this pattern, a buy signal occurs when the price breaks out of the upper trend line of the price channel that forms the handle. There should be a substantial increase in volume on the breakout above the handle’s resistance. Go long at the close of the breakout candlestick. Alternatively, you place a stop-buy order slightly above that upper trend line. Sometimes, it is prudent to wait for a breakout above the resistance line established by the highs of the cup.
Stop loss:-
You need a stop-loss order to get you out of the trade if after buying the breakout, the price drops, instead of rising. Your stop loss should be at a level that invalidates the pattern’s signal, and that level is below the lowest point of the handle.
Profit target:-
There are two potential profit target levels for this pattern. The first profit target is estimated by measuring a distance equivalent to the size of the handle, starting from the breakout point. The second profit target is estimated by measuring a distance equal to the depth of the cup, again, starting from the point of the breakout.
Trading the bearish Cup and Handle pattern:-
The bearish Cup and Handle pattern forms a downtrend and is traded as a bearish breakdown signal. So, you can use it to go short on the market if you want. This is how you trade the pattern:
Entry:-
You have a sell signal when the price breaks below the lower trend line of the price channel that forms the handle. There should be a spike in volume when this breakdown happens. You may go short at the close of the breakdown candlestick, or you place a stop-sell order slightly below that lower trend line. It might be wise to wait for a break below the support line established by the lows of the inverted cup.
Stop loss:-
When you are trading the inverse Cup and Handle pattern, you should place your stop loss order above the highest point of the handle.
Profit target:-
Two potential levels are good for your profit target: the first profit level is estimated by measuring a distance equal to the size of the handle, starting from the breakdown point, while the second profit level is estimated by measuring a distance equal to the height of the dome (inverted cup), starting from the point of the breakdown.
Trade with care
If you like our content, please feel free to support our page with a like, comment
Hit the like button if you like it and share your charts in the comments section.
Thank you

📉📈 ZigZag IndicatorZigZag's primary goal is to focus on significant swings and trends by removing insignificant and misleading price changes.
ZigZag connects the price's highest and lowest points using straight lines while ignoring minor swings.
ZigZag just aims to make sense of the market's previous movements; it makes no attempt to predict the price of an item.
It is only based on hindsight and is not predictive in any way. It is based on the past prices of securities and cannot forecast the next swing highs and swing lows.
🟢Advantages
It eliminates market noise and displays the most significant price fluctuations.
It operates in several timeframes.
When utilized in cooperation with other technical indicators, it gives positive results.
🔴Disadvantages
It will mark the latest high or low of the price with a time lag.
The last stretch of the indicator (the one that involves the current price) may be redrawn.
Not predictive in any way, has to be used in combination of other strategies to be effective.
👤 @AlgoBuddy
📅 Daily Ideas about market update, psychology & indicators
❤️ If you appreciate our work , Please like, comment and follow

NASDAQ: TRADE RESULTS | 3000 POINTS PROFIT FLOATING 💸Trade Results: Went up a decent 3000 Points worth of profits during the bullish run as expected with our analysis.
Analysis: Breakout and pullback on the key level highlighted. Expecting a bullish reversal here to revisit the pinned price levels on the chart.
Thanks for visiting my tradingview profile. Hope the chart update helps you out. If you like the content do hit the thumbs up and follow me for future updates. 🙌🏻😎
📌For more details regarding this chart update, please message me on tradingview chat. Thank you!

💨 Elliott Wave Pattern: Single Zigzag 🌊
❗❗ 𝙍𝙪𝙡𝙚𝙨
● A zigzag always subdivides into three waves.
● Wave Ⓐ always subdivides into an impulse or leading diagonal.
● Wave Ⓒ always subdivides into an impulse or ending diagonal.
● Wave Ⓑ always subdivides into a zigzag, flat, triangle or combination thereof.
● Wave Ⓑ never moves beyond the start of wave Ⓐ .
● Wave Ⓑ always ends within the price territory of wave Ⓐ .
● Wave Ⓒ almost always ends beyond the end of wave Ⓐ . (failure to comply with this requirement is called «truncation»)*
*guideline, but should be followed as a rule
❗ 𝙂𝙪𝙞𝙙𝙚𝙡𝙞𝙣𝙚𝙨
● Wave Ⓒ should not fail to reach the end of wave Ⓐ by more than 10% of the length of wave Ⓐ . (Q&A EWI)
● In a zigzag, the length of wave Ⓒ is usually equal to that of wave Ⓐ , although it is not uncommonly 1.618 or .618 times the length of wave Ⓐ (rarely 2.618).
● Wave Ⓑ typically retraces 38 to 79 percent of wave Ⓐ .
● If wave Ⓑ is a contracting triangle, it will typically retrace 38 to 50 percent of wave Ⓐ .
● If wave Ⓑ is a running contracting triangle, it will typically retrace between 10 and 40 percent of wave Ⓐ .
● If wave Ⓑ is a zigzag, it will typically retrace 50 to 79 percent of wave Ⓐ .
● In a zigzag, if wave Ⓐ is a leading diagonal, then we would not expect to see an ending diagonal for wave Ⓒ .
● A line connecting the ends of waves Ⓐ and Ⓒ is often parallel to a line connecting the end of wave Ⓑ and the start of wave Ⓐ . (Forecasting guideline: Wave Ⓒ often ends upon reaching a line drawn from the end of wave Ⓐ that is parallel to a line connecting the start of wave Ⓐ and the end of wave Ⓑ .)
● Waves Ⓐ and Ⓒ within the zigzag often appear in the form of impulses, but more often alternate according to the type of motive waves: if wave Ⓐ is an impulse, expect wave Ⓒ in the form of a diagonal, and vice versa. It is much less common to find waves Ⓐ and Ⓒ in the form of diagonals, but in this case they will alternate in form: contracting / expanding, and vice versa. (TWEWA)
● If a similar amplitude and duration of waves Ⓐ and Ⓒ within a single zigzag is expected, the line passing through the top of Ⓐ , which is parallel to the line connecting the beginning of wave Ⓐ and the end of wave Ⓑ , often turns out to be the level of completion of wave Ⓒ . In case of a extended wave Ⓐ within a single zigzag, expect the wave Ⓒ to reach the middle line of the channel, and in case of signals in favor of a extended wave Ⓒ , it is worth resorting to the technique of doubling the channel to determine potential support or resistance. (TWEWA)
__________________________
🔗References:
Elliott Wave Principal 2005
Trade Waves / Elliott Waves Analysis (TWEWA)
📚 Elliott Wave Guide & Ellott Wave Archive ⬇️⬇️

Neo Wave Learner doubtWhat is the difference between projection overlapping and "obviously different in price and/or time" in NEO Wave? In Pre-Constructive Rules of Logic, Rule#1, Condition_b, Paraghraph_4, it states "If part of m2's price range is shared by m0 and m3 is longer and more vertical than ml during a time span equal to (or less than) ml and m(-1) is shorter than ml and m0 and m2 are obviously different in price or time or both and m4 (or m4 through m6) returns to the beginning of ml in a time period 50% of that consumed by ml through m3, a 5th Extension Terminal pattern may have completed with m3; add ":c3" to ml's Structure list."
Here, m0 and m2 should share price range, which means projection overlapping, at the same time, it is mentioned, m0 and m2 should be obviously different in price&/time.
Experts please help..
Also, Mr. Neely mentioned, "m1 is longer than m3" in few other places, does the length means, by means of distance between 2 price points or by means of time distance or should i consider a multiple..

Apple. World largest stock looking for new “host?” 4/Jan/23AAPL, apple as world largest market cap stock in the world benefiting from “low rate” for past 40 years. Howard Marks have “ warned” the end of 40...Probably capitalist might take few years ( consolidation in most equities market) looking for “new boss”.?

Wave Auction Theory & WHY it worksSup, this is the 30th & the last post that concludes all the previous ones, and finally reveals the name how I've called all this - wave auction theory. Well, me as a creator of all this (or more like a mixer, a DJ lol) I think about it more as a theorem, but that's for nerds and geeks to work it out, me I just wanna flexx.
If you take a look at all existing market theories their main thing is they all attempt to divide market activity into parts. Patterns, El waves, Wyckoff market states, then what Steidlmayer created (I call it Interval Auction Theory, since he divided market activity in parts by days, weeks, months etc). The main problem with is all these concepts (maybe except the last one) dem are not well defined, and they apply on the fractal market something that the highest resolution of this fractal (raw tick chart) doesn't have.
Wave auction theory ain't superimposing any exogenous structures on the market, such as "crowd behaviors", nah, it doesn't guess and predicts anything, it derives the principles and structures from the sequences of fundamental particles of the market - ticks, and it can be used fully on this fundamental resolution. This is the most fundamental principle how you can divide market activity without any subjectivity: waves and levels. Btw, indirectly, we also gain the interval size information by choosing the right resolutions, while interval auction theory disregards sequence of events (read my post about market & volume profiles).
Why it all works
It's a lil bit recursive kind of thing, you need to read all the statements below multiple times in different order, then your brain will start making the whole picture out of it, and finally things will come together, you'll feel that "snap" in your head. It's the best I can do.
* Market is fractal => all the principles propagate through all the resolutions;
* Market is a feedback loop, market is ALL of us together, that famous "composite operator" that Wyckoff tried to explain to people around him, that composite operator is All of us - the collective;
* Each individual entity in the collective has different voting power = better you operate = better the market = more revenues & capital you have = more voting power you have;
* We all have all the same data => we can gain as much information as there is in the data;
* Data on every resolution has information where it is, it was, or it will be cheap or expensive, every1 gains it with different degree of precision, but essentially every1 gains the same info because it's the same market & same data;
* The only thing that works all the time in all the cases is being an operator (a market maker) aka you buy cheap and sell expensive;
* Market making happens on all the resolutions, be it 1 minute or 1 week chart, on the former it might be one dude with 100 shares, on 1W it might be 100k dudes with 100 shares, the collective is always there, even on yearly charts;
* More data & information you have, the more question of "what's going to happen in the future" transforms into the question of "what IS happening NOW";
* market works on the principle I call "GTC Naive" (good till cancel Naive forecast), meaning that "the stuff's gonna continue the same way UNTIL there's an event/evidence that'll change it";
We all make the future, how can we not know what we're making ourselves if we have the info and exogenous factors are not numerous and secondary at best, and the system itself is quazi-closed? Still gonna try to analyze log returns? xD
Everything is already decided, we've decided all of that ourselves having the same data & same info xdddd
All the prophecies are self fulfilling prophecies by definition lmao, they are consequences of sequences of choices made by every1 through all the timeline. While loosing precision we gain generality => are able to understand what IS happening NOW. Not even contra intuitive aye?
The good side point of all this is that now you can rewatch Matrix movies (all of dem) and finally understand the dialogs between Neo and The Oracle (the parts her telling him the choice is already made).
Coming back to the theme, I share all this because I think that markets are sadly unhealthy, there's ENORMOUS room for liquidity provision for centuries to come on Ks of assets. Better we gonna operate, more clients = more volume will come to the markets => better for all of us.
The last several things I wanna share:
1) You can approach designing an automated agent (a bot) by following principle, smth I call "sMATEs framework";
- s: selection of assets that will end up in your masterlist;
- M: management - choosing between the most potent timeframes & assets within the assets in masterlist;
- A: analytics, seeing what's happening on your chosen data, choosing the signal generation method aka strategy accordingly;
- T: trading, generation the actual signals based on the strategy chosen before;
- E: execution, processing & fine tuning the actual executions based on the signals;
-s: sizing: choosing the quantities based on equity control and what the market can give.
The two small Ss are the only levels where you need to use ML. Reinforced learning for sizing based on order book & equity chart of a given agent. Then you can use ML & AI to form the masterlist, based on what you want. Generally you're interested in action or as I say in MEAT (ain't no vegan bruh sorry).
2) Each market has its own main cycle set: set of properly chosen optimal resolutions & time frames & rolling window lengths (no, there's nothing to optimize there & no need in dynamic lengths). I think you can figure it out reading all the posts & studies I've posted lately.
I can give a hint: if you want to divide smth, you always try to divide it by 5 first. If you can't by 5, then by 4. If you can't by 4, then by 6. If you can't by 6, then by 3. If you even can't by 3, then by 7. And omg if you can't by 7, then in theory it's by 2, but not on our planet with our modern time system. Look at the 2 centuries of S&P chart in this post and see what I see.
3) If you a coward, or an overconfident prick, or a cheater, or a lier, or a snitch, you wont't succeed. You'll succeed if you're real & legit, in this case it's only a matter of time.
From there it seems like my path goes somewhere else, but this is the way, all good TV, was fun.
Remember, there's no noise, only the truth

Higher resolutionHigher resolutions aka lower timeframes have several uses:
HIgh res levels
1) For more precise entries past the positioned levels. You have a level on your current resolution, a level you want to use, let's call it "X". You turn in higher resolutions, and scale in around the levels there, past the X;
2) For precise entries during positioning. You have a level that you expect to be positioned 'that way', let's call it "Y". You turn in higher resolutions, and scale in around the levels there, past the Y. An example on the chart is exactly about that. Suppose we expected a 1M level (red line) to be positioned as support. We've opened 1W chart and scaled in at 1W levels below the level;
3) Overridden levels. Forgot to mention, just as overridden waves, overridden levels do exist. It really concerns an imaginary level called value aka fair price. Usually, when you have an overridden wave -> value level in the middle of this wave, the real levels around value exist only deep in higher resolutions, and are already cleared, long time ago. So, they kinda "reactivate" again inside an overridden wave, near the value;
4) For scaling out. When offloading risk, you don't want to do it at the levels that You, yourself, expect to be cleared xD. And that includes the levels from the high ress.
HIgh res waves
1) To fine tune the location of back levels. Positioning of a level on a given resolution is a so called pattern seen on higher resolutions. I can't say much about the predictive power of dem patterns, but can say for sure that fine tuning the back levels by finding boundaries of these patterns is a good idea;
2) Simply monitoring the action on higher resolutions gives information about what's happening around your levels of interest. Everything explained in "Current resolution" can be applied there.
You may come up with more uses. The main part is to understand what higher resolutions are: less data in greater detail. Now how would you leverage this info?

Lower resolutionMore data on lower resolutions, smth that others call higher timeframes.
Low res waves
While being on a given resolution, the lower resolutions are mostly used to understand the trends within the overall fractal. In general, you want to trade along with the strong low res wave, and don't trade against an exhausted low res wave. While being on given resolution, you're interested in all the lower resolutions, not only in the first adjacent one. So if you operate on 1H charts, you also need to consider 6H, 1D, 1W etc, not only 6H.
For example, imagine being in a strong up trend on 1W chart. It won't go 4 ever. There's no exhaustion in 1M wave. But here we go, and exhaustion on 1Q chart. And "suddenly", the levels on 1W chart start to position as resistances! Before that, the overall trend on 1Q surely showed some weaknesses, but there was no evident evidence. This kind of info could've been only gained from more data.
Low res levels
Now that's really interesting. As I mentioned somewhere before, while being on any resolution, ALL the levels from ALL the lower resolutions should be monitored. That's why people say that it's harder to trade on lower timeframes (higher resolutions), simply because they don't know that simple fact I just mentioned. They see a reversal "in the air", but, as you already know, there's always a level. So, a level from 1Y chart does matter on 1 minute chart. Yes, it does. How?
The action around low res levels are somewhat common with the action around option strikes. In a sense, it's a microstructural phenomena as well. Without further analysis, what you know 4 sure is that low res levels might produce reactions, even if a level is from 1Y chart and you are on 1 sec chart. In general, they allow rapid price moves to come through, and produce reactions when prices approach these levels in normal way.
Why? As you know, it becomes cheap/expensive PAST the level, never before. Now imagine price comes to a level in a usual manner, or even slower. Chances for a deep dive past the levels are low. What you do? You scale in closer to the level. And now imagine price flying fast. It'll make sense to scale in deeper with a bigger size, to get better prices, to reduce risks. Why not if the market activity allows it?
It's a 1H chart on the screen there, and the yellow level is a support from 1W chart. Take a look how the 1H action unfolds around that level.

Forget about chart patterns! Hello, my dear friends and happy New Year!
I wish you to be healthy and reach all your goals in trading and not only! Never give up on this difficult way which we are going to overcome together!
Today we have a very important topic. How to use Elliott waves instead of classical chart patterns. This is the natural exposure why the chart patterns are garbage. I remember my third year at university when we have the trading lessons. Our teacher gave us a lot of useless knowledges about support, resistance and chart patterns. I have not understood why it should working and it was not soo intereting subject for me. That’s why I returned back to trading much later using self-education. Now I have the clear understanding why Elliott waves is the best tool and why it’s working. Most of traders even don’t understand that chart patterns is just the special case of Elliott waves. That’s why today I decided to explain you how you can change the first one to the second one. Let’s go!
Double Top(Bottom)
On the chart above I drew the different types of double tops. Generally we have 3 types of this pattern
Double top with the second top higher than the first one. In this case we can interpret it in two ways. It could be the classical waves 3, 4, 5 and the corrective wave A at the ending stage. In this case we can anticipate waves B and C. Also it could be the irregular correcton ABC inside wave 4 (rarely in wave 2). In this case we should wait for the wave 5 after that. Traders usually execute short position on the neckline breakdown and suffer when the wave 5 smashed their stop-loss. They are wondering why double top does not working.
Double top with the equal highs has the same possible outcomes. The only one difference that correction called flat instead of irregular.
Double top with the second top lower than the first one. Here is the most common variant is the end of the ABC correction. In this case we have the low potential for shorting the market becuase the new impulsive wave to the upside can hit all stop losses.
Head & Shoulders
This is the easiest pattern for analysis. The right sholder usually is the wave 4, the head, obviously is the wave 5 and the right shoulder is the wave B. On the neckline breakdown we have the shorting potential only in the rest part of the wave C. You could correctly count waves and short that the bearish reversal bar of the wave 5 or, as a last resort, at wave B potential top. Shorting at the neckline has sence only if you are sure that the wave B was the the wave 1 of the impulsive wave to the downside if higher degree and now the market is in wave 3. We have to learn how to count waves in a correct way. I would recommend you to read the Trading Chaos book by Bill Williams because it has the best explanation how do waves work.
Triangles and Wedges
This part is common for all types of triangles (ascending, descending, symmetrical) and wedges (falling and rising). This patterns have the similar structure. If we faced with one of these patterns we have 4 possible scenarios.
Triangle in the downtrend after the wave 3. In this case triangle is the wave 4, which is represented as the triangle correction. This correction type consists of 5 waves A, B, C, D and E. When the wave E is finished market will continue it’s move in the direction of a trend, printing the wave 5.
The same, but in the uptrend.
When the market showed us the 5 waves cycle to the upside and the correction is in progress. Triangle can appears in the wave B. In this case the price will continue the corrective move in the wave C after it’s finished.
The same with the downtrend.
Guys, of course there are much more types of chart patterns. For example, tripple tops and bottoms and so on. The purpose of this article is giving you another view of the market structure and to motivate you studying the Elliott waves theory. Believe me, it has much more potential than it seems on the first glimplse.
Best regards, Ivan
________________________________________________________________________________________________
If you like my educational ideas, please smash the boost button to stimulate me make more quality articles!

Number of Sunspots and Inflation CYCLESHi friends
Today im going to explain about the relationship between Sunspot Numbers and Inflation rate from 1960 to now.
so lets start with inventor of this theory : William Stanley Jevons's
In 1875 and 1878 Jevons read two papers before the British Association which expounded his famous "sunspot theory" of the business cycle.
Digging through mountains of statistics of economic and meteorological data,
Jevons argued that there was a connection between the timing of commercial crises and the solar cycle.
it called 5.31-Year Cycle too.
In the stock market and in the economy, there are both natural frequencies and artificial excitation frequencies.
The four-year presidential election cycle is a great example of an excitation frequency, and it has demonstrable effects on stock prices.
The schedule of FOMC meetings 8x per year is another possible example of an artificial excitation frequency.
When a demonstrable cycle period appears that one cannot tie to some manmade excitation frequency,
then the supposition is that it is a "natural" frequency of the economic system.
Something about the economy or the market results in an oscillation on a certain frequency which may not have a good outside explanation.
Perhaps it is in how money flows. Perhaps it is in how human brains make decisions about surplus and scarcity. It is hard to know.
This 5.31-year frequency in the CPIs cycle seems to fall into that category as a natural cycle,
because the 5.31-year period does not match any known excitation frequency related to human activity nor the economic calendar.
So that makes it probably a natural frequency.
In above chart , there does seem to be a relationship between sunspots and the inflation rate.
We see lots of instances when the peak of the sunspot cycle coincided with the peak of the inflation rate.
There have been spikes in the inflation rate not tied to the sunspot cycle, such as the spike during the Arab Oil Embargo of 1973-74.
this examples did, interestingly, come at the halfway point of the sunspot cycle, fitting the half-period harmonic principle(5.31 year cycle).
The current rise in inflation fits both the longstanding 5.31-year cycle and the upswing in the sunspot cycle.
Solar researchers expect the current sunspot cycle rise to end in July 2025, which is 3 years from now.
But the 5.31-year cycle says a top in the inflation rate is expected right now.
That would mean seeing the inflation rate bottoming around 2025 just as the sunspot cycle is peaking.
Sometimes cycles present us with conflicts that are hard to reconcile.
The point of the 5.31-year cycle that we can take away for right now is that the inflation rate should be falling for the next ~2.2 years.
But that does not mean we get to zero percent inflation right away.
The drops take a while to unfold. Inflation is likely with us for a while, and we have to get used to that idea.

HOW-TO: Wolfe Strategy [Trendoscope]Just made this short video to explain the concepts of Wolfe Strategy which I recently published.
Wolfe wave is popular concept among option traders. However, I have made some tweaks in this strategy to standard wolfe pattern trade rules.
Entry price based on breakout
No moving target - using flat target.
Entry is done based on risk reward
Not time bound
Intelligently decides whether to place stop order or limit order
Few possible future improvements
Make bidirectional trades possible
Better filters to chose long and short trades or when to trade
Lot can be improved on Wolfe scanner to identify more patterns
Exit strategy - can introduce optional trailing
Thanks for listening. Hope you enjoyed and learnt something from this :)

Trading with Candlesticks Harmony - Above 80% Win RateIn this video I discuss how to use simple wave-analysis and how to use candlesticks harmony in 5 or 15 minutes time-frames to trade with success. This sterategy even works on 1 minute time-frames for some forms of countable harmonies...
---
Gerald Mann was born Mr. Peiman Ghasemi on February 16, 1988. He got deported from Turkey to Iran where he is exit banned now. Alongside trading, he is also wishing to gain the freedom to leave the country. On the other side the silence of the related governmental departments of the U.S. is obvious. There is no answer.

Wave exhaustionThe main purpose of analyzing waves is to understand when the current wave is exhausted aka overextended aka overbought aka oversold.
What is every1 seem to miss is that exhaustion is not based exclusively on "price gone too far", but also on "too much time passed" and "not much volume was traded" as well. That's one of the main reasons why your comparative analysis, divergences on so called "indicators" do not work properly. It simply can't. These methods do not gain time & volume information from the data.
When you analyze order flow on any resolution, be it 1 minute, 5 years or tick chart, you're interested in 2 waves: current wave and *the very last (previous) wave in the same direction .
* including the imaginary waves
Don't forget to turn in log scale when it's needed!
You compare these 2 as the current wave develops and keep updating the answer to the binary question, "which of these two waves is weaker". Strength of a wave = it's ability to continue. Every wave starts strong and goes weaker and weaker, the factors are:
1) Time. Horizontal size of a wave (in bars), more time (more bars) - weaker ;
2) Range. Vertical size of a wave, higher range - weake r;
3) Volume, or inferred volume. You sum up all the volume within a wave, or sum up all the bar sizes within a wave. Less volume - weaker .*
* in order not to sum up anything within a wave yourself, here you can turn in volume/range bars and simply count em.
And from that moment it's like "Best of 3" comparison.
1) Time. Wave A 10 bars, wave B 5 bars. Wave B is stronger;
2) Range. Wave A 546 points, wave B 890 points. Wave A is stronger;
3) Volume. Wave A 10k, wave wave B 8k. Wave A is stronger;
So at that point, wave A was stronger = wave B was weaker.
This will be giving you a binary answer which wave is weaker. When the current wave becomes weaker than the last wave in the same direction, current wave is considered exhausted.
P.S.: wave start in time (first bar of the wave) is the level origin itself or the first bar that touched a level if we talked about a new wave starting from an already positioned level, or about a wave started after clearing a positioned level.
The more you'll think about the more it'll make sense. An example. Remember seeing fast price jumps? After some, the price reverses very fast and goes back, after others prices continues in the direction of the jump. In most of the cases the current wave (the jump) gets exhausted in terms of price, but not exhausted in terms of time (the jump was very fast). So in terrms of time and price both waves are 50/50. What is different is volume. If the current wave (the jump) had a huge volume, overall it's still not exhausted, hence it continues. Sounds familiar? Sounds logical?
Just the last simple and obvious thing, in most cases you won't need to calculate sum volumes/ranges, usually at the moment of analysis the current wave is already longer and higher than the previous one in the same direction, hence the current wave is already exhausted.
Yessir

Real wavesFrom all the dudes tryna solve it Wyckoff was the closest. He even figured out how levels get positioned as supports/resistances (he called it accumulations, re-accumulations, distributions and re-distributions). The only thing he was missing are the actual levels hehe (all these 4 volume absorption processes never happen "in the air", ain't no Phil Collins in this particular case, there's always a level). Levels & waves, one doesn't exist without another one .
It's all simple: every formation of a new level and every test of existing non-cleared level starts a new wave, either in the opposite or in the same direction.
Check the chart, I've marked some waves and made 2 schemes. Every distinct wave has a different color.
Why? How?
Wave sounds cool, "uninterrupted continuous order flow in the same direction" sounds lame and boring af.
Interrupted? Each level interrupts the order flow, even for a lil sec, there's always a volume absorption process happening when levels get formed and when levels get positioned, also when levels get cleared (consumption of liquidity at the level). So, checking the level-to-level buying and selling waves is a perfect way to measure order flow aka incoming volume.
Remember about fractal nature of the market => propagation of principles? It works on tick charts => it works on 1 minute charts, and on 1Q charts, and on every other possible resolutions.

Imaginary wavesAgain as with the levels, first ima tell how to locate both real & imaginary waves, then I'll explain the principle itself, what are they, why it works etc, why we need em & how to use em. It's really easier this way.
Let's start with imaginary waves.
First, pls read the linked "Imaginary levels: fair price aka value", it has an explanation and another common example & about the imaginary levels.
As with imaginary levels, imaginary waves are, well, imagined xd, when there's nothing else, but a decision has to be made.
Look at the chart as if you're in 2k13 (when ASAP dropped Trap Lord) as in the previous example in the linked study, we have an overridden wave 520-1923.7, we have an imagined fair price level somewhere around 1200.
When we have an overridden wave -> we have the imaginary fair price level somewhere ~ in the middle of this wave -> that fair price level divides the real wave into 2 imaginary waves.
As with imaginary levels, imaginary waves can be used for further processing.

WHAT IS A PIP AND HOW TO MEASURE IT?WHAT IS A PIP?
The pips is the unit with which we measure the price movement of a pair.
Example: If the USD/MXN pair is used. If the dollar is worth 20.7 and rises to 20.8, it is said to rise to 1 cent but in FOREX it is not measured with cents, it is measured with pips.
The price of the USD/MXN chart has 3 extra decimal places 20.8 000 those 3 extra decimal places are what the pips are measured with: the pip is the fourth number after the point . If the price changes from 20.8100 to 20.80101 the price moves 1 pips, if the price moves from 20.80100 to 20.80110 the price moves 10 pips and if the price moves from 20.80100 to 20.80300 the price moves 200 pips.
Pips are calculated differently depending on the pair, pairs with Japanese YEN and pairs WITHOUT Japanese YEN
PAIRS WITH YEN

How to Spot Reversal Of Bullish Or Bearish Trend- Elliott Wave Dear traders,
In this video I want to look at some basics of Elliott Wave analysis and how to spot top/bottom or reversal of a trend. There are specific patterns that can help us define useful set-ups for potential trade idea.
Hope you will enjoy the video.

Simple Strategy with Good R&R (Works bullish or bearish)
1. identify the trend ; whether up (bullish) or down (bearish) .
2. Identify an impulse move to the up or down side.
3. Watch for a correction from the impulse, then wait for a retest and or bounce of the 800-day ema.
4. Wait for a bullish order block (OB) that closes above the 800-day ema. Then enter on the retest of the 800-day ema and go long or short accordingly.
5. stop loss below the corrections lowest low and take profit at the impulses highest high.
This works on all types of assets from AMEX:SPY to FX:EURUSD to BINANCE:BTCUSDT and even CME_MINI:ES1! .

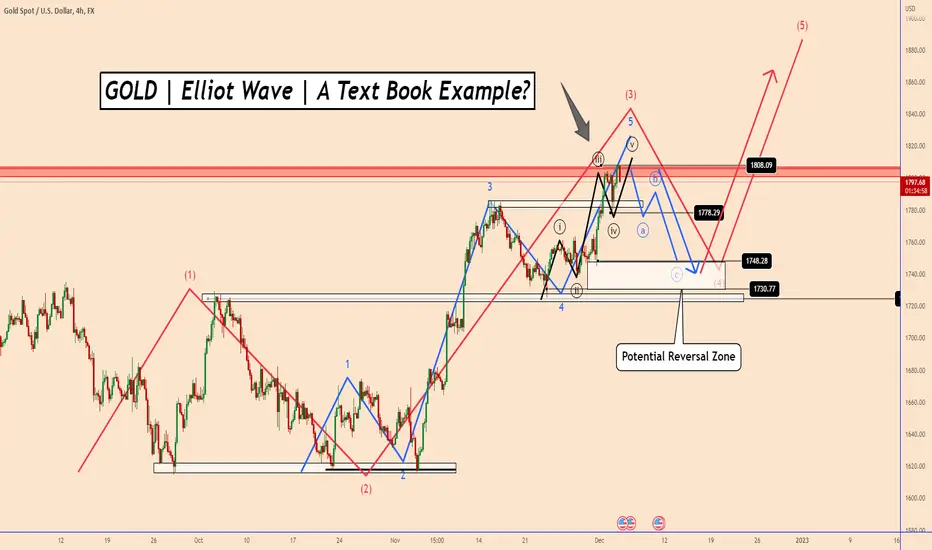
GOLD | Elliot Wave | A Text Book Example?GOLD | Elliot Wave | A Text Book Example?
It is extremely rare that in reality, we find patterns in textbook examples.
Gold is currently presenting such an opportunity which I will explain in detail.
According to Elliot's Wave theory, an impulsive wave is created by 5 waves.
3 of these waves are impulsive (1,3 and 5)
2 waves are corrective (2 and 4)
According to the books, each impulsive wave is composed of 5 waves of the lower degree that can be seen in the lower chart time frames.
In our real-time example, the price has created the 3rd wave of a daily chart (in red). So it should be ready for the 4th wave correction.
If we look at the 4-hour chart, we can see that the 3rd wave can be broken down into 5 other waves (in blue)
And the 5th wave of the third wave (in blue) seems to be completed by 5 other waves (in black)
Maybe this is the moment we can see an ABC correction before the price goes up again for the 5th wave (in red).
The price correction zone is expected to be 1748 - 1730 in order for the price to rise again.
Thank you and Good Luck!
Daily Chart!
4-Hour chart:
Depth of corrective waves. Elliott Wave.Elliott Wave Guidelines:
Depth of Corrective Waves
Understanding Elliott Waves is much more then the basic rules and 3s and 5s. A largely underused aspect of Elliott Waves is the Elliott Wave Guidelines. These go beyond the guidelines for each specific pattern and are meant to assist in determining the most probabilistic wave pattern. This is just the primary guideline of this larger Elliott Wave guideline.
If you have found this inspiring/helpful, please consider a boost and follow! Also, check out the links in my signature to get to know me better! Cheers!
