Elliott Wave Theory - Corrective WavesThe Elliott Wave Principle at its core consists of motive waves, movement in the direction of the larger trend, and corrective waves, any correction against the main trend. Market prices alternate between a motive phase, and a corrective phase on all time scales of trend
Please refer to Elliott-Wave-Theory - Motive-Waves post covering rules and tendencies of motive waves, participants psychology at every stage of an motive wave and how to identify/forcast them using both fibonacci relations as well as channeling technique (price action).
This post is about Corrective waves . Corrective waves have a lot more variety and less clearly identifiable compared to Motive waves and are an important component of the Elliott Wave Theory. Corrective waves needs more attention and to be mastered to become a successfull Elliott wave practitioner
Corrective Waves
Corrective waves, consist of three—or a combination of three—sub-waves that make net movement in the direction opposite to the trend of one larger degree
There are many corrective patterns ranging from simple to complex yet they are just made up of three very simple easy-to-understand formations
Disclaimer: below presented figures displays guidelines that elliott waves may form. Guidelines are tendencies, not set in stone rules
a - ZigZag Corrective Wave (5-3-5)
Consist of three sub-waves against the main trend and labeled as ABC. ZigZag is a 5-3-5 structure internally
b - Flat Corrective Wave (3-3-5)
Consist of three sub-waves against the main trend and labeled as ABC. The labelling is the same as ZigZag, the difference is in internal structure. Flat is a 3-3-5 structure internally and differs from ZigZag in the subdivision of the wave A.
There are three different types of Flats: Regular, Running and Expanded Flats.
c - Triangle Corrective Wave (3-3-3-3-3)
Triangle formations are corrective patterns that are bound by either converging or diverging trend lines. Corrective structure consist of five sub-waves labelled as ABCDE, subdivision of a triangle is 3-3-3-3-3
Triangle corrective waves types can be listed as : Ascending, Descending, Symmetrical, and Expanding Triangles
d - Complex Corrective Waves - Double (3-3-3) and Tripple Three (3-3-3-3-3)
Double three is a sideways combination of two corrective patterns, labelled as WXY
Triple three is a sideways combination of three corrective patterns, labelled as WXYXZ
Please refer to Difference between ABC and WXY , for further details and structures of Complex Corrective waves as well as the differences between Simple corrective structures
The Elliott Wave Theory provides constructive insight that can help technical analysts monitor and understand the movements of financial asset prices over the short and long term.
Please note that these patterns do not provide any kind of certainty about future price movement, but rather, serve in helping to order the probabilities for future market action. They can be used in conjunction with other forms of technical and fundamental analysis, including technical indicators, to identify specific opportunities.
Technical Indicators
Ocsillators to detect divergencies (includes 15 different ocsillator) : OSCs
Elliott Wave Oscillator : EWO
Auto Fibonacci Retrecment/Extentions : Auto Fib Retrecment-Extentions
Volume Profile : Volume-Profile-and-Volume-Indicator
Other indicators that are referred among elliott wave practitioners
Pitchforks ( how to apply ), Pitchfans , FibFans ( how to apply ), FibChannels ( how to apply ), FibTime , Linear-Regression-Channel ( what it is ), Raff Regression Channel ( what it is )
Wave Analysis

How to use different types of Fibonacci in TradingViewWave Relationships and their relation by Fibonacci Ratios are among the most helpful tools for target prediction.
There are different types of Fibonacci and different tools with different names in different software packages. This may make users somehow confused . Here, we try to shed some light on various mostly used Fibonacci types and explain their usage for target prediction. Also we explain their related tool in TradingView and their way of implementations.
As shown on the chart, there are four main types of Fibonacci :
1- Internal Retracement
2. External Retracement (Extension)
3. Expansion
4. Projection
Before going through details, it is worth to mention that knowing wave relationships is a key to implement Fibonacci tools accurately. Different types of wave relationships is beyond the scope of this publication. Here, for simplification, we show most simple type of wave cycle which is ascending complete cycle with one 5 leg up impulse and one abc form of correction . Also, we try to explain more typical Fibonacci Ratios for target prediction and skip less often ones.
1. Internal Retracement:
This is simply for calculation of the amount of correction in the main trend. It means we can predict where a counter trend correction may end.
As shown on the chart, it can be used for target prediction of wave 2 and 4 in an up trend and also wave B in a down trend. It can also be used for calculation of end of wave C which is the end of correction of whole up going wave. Green arrows on the picture show the direction of using this tool which is "Fib Reracement" in TradinView. For example, we put first point at the start of wave 1 and second point at the end of this wave for obtaining possible targets for wave 2 and so on.
Wave 2 can end at 0.382, 0.5, 0.618 and 0.786 Fibonacci Retracement levels of wave 1. Fibonacci levels at which wave 2 ends can send us a signal about the amount of next waves. This is again beyond the scope of this publication.
Wave 4 can typically end at 0.382 or 0.5 Retracement of wave 3. Less and more amount of Retracements are also possible, but those make wave relations more complicated and does not match with our simple shown example.
Wave B typically corrects 0.382 , 0.5 and 0.618 of wave A in a simple zigzag correction. More Retracements signals for more complicated corrections e.g a flat correction.
Wave C Retracement levels are similar to wave 2 in shown wave cycle since it is end of a larger degree wave 2.
2. External Retracement:
This Fibonacci which is also called " Extension" can be used for calculation of end of wave 3 or 5 in an up trend and end of wave C ( which is end of whole correction) in a down trend.
We have same tool as internal retracement in TradingView however ,unlike internal Retracement, an extension should be drawn from a high to a low in an up trend and vice versa as shown by green arrows on the related figure.
Wave 3 Fibonacci Ratios by extension depends on the amount of wave 2 correction. For example, 1.618 or 2.618 extension of wave 2 can be the target for wave 3. Robert. C. Miner has proposed a very useful table for targets using external retracement.
Wave 5 typical targets are 1.272, 1.414 and 1.618 extensions of wave 4. This ratios are also the same for calculation of end of wave C.
3. Expansion:
Based on my experience, Fibo expansion is most useful when we have over extended waves for example over extended wave 3. In this case , 1.618 or even 2.618 Fibo levels can be the typical targets.
Related tool in TradingView is Trend-Based Fib Extension. Please note that this tool in TradingView is a three point Fibonacci while expansion is two point Fibonacci tool. Therefore, Implementing this tool for obtaining Expansion levels is a little tricky. For example, for calculation of wave 3 we should put first point at the start of wave 1 and double click on end of wave 1.
There are also more details in implementing Fibo expansion for example we have different types of Fibo expansion. We can skip details here to keep this publication as simple as possible.
4. Projection:
This is the only 3 points Fibonacci that we have. Some software packages call this Fibonacci as Expansion !!. Its related tool in TradingView is Trend-Based Fibo Extension. It is a very useful tool for calculation of end of wave 3, 5 and C.
Again green arrows show how to use this tool . For example, For wave 3 target calculation we set first point at the start of wave 1, second point at end of wave 1 and third point at the end of wave 2 or start of wave 3.
1.618 and 2.618 Fibo levels are typical for end of an extended wave 3 when using Fibo projection.
100 % Projection of wave 1 from low of wave 4 is a typical one for end of wave 5 target. Also 0.382 or 0.618 projection of wave 1-3 from low of wave 4 is a helpful ratio for wave 5 target calculation.
For a wave C, most common projection is 100 % of wave A from top of wave B.
How to make a Potential Reversal Zone ( PRZ) :
We can make our potential reversal zone stronger by combining all proposed tools . Take another look at the figures. What can we see? yes. We know four tools now for calculation of end of wave C. Suppose how strong a possible buy zone can be when 4 different tools suggest it as potential reversal target !
Hope this to be helpful. Please do not hesitate to ask questions if you feel need to ask.
Good luck every one.

Running triangle and Leading DiagonalsTriangles are corrective patterns and diagonals are motive patterns.
Upon completing a triangular pattern the trend resumes.
Ending diagonal marks the end of a major wave or a trend and signals upcoming trend reversal or major correction.
Leading diagonal marks the start of a major wave or a trend after a major correction or reversal to previous trend. After a leading diagonal, a short correction can be expected before the trend resumes in the direction of leading diagonal.
In the previous post, the comparison is between running triangle and ending diagonals.
This post compares running triangle and leading diagonals.
Chart1: Running triangle and leaning diagonal in uptrend
As mentioned the comparison is in an uptrend. Accordingly upward move is termed as directional move and move to the downside is termed as non-directional.
A running triangle has non-directional momentum ie faster moves to the downside (wave A, C and E) than the upward moves (Waves B and D). These non-directional moves donot retrace the previous move completely.
On the contrary, Leading diagonal has directional momentum ie faster moves to the upside (waves 1, 3 and 5) in the direction of trend and these upward moves completely retrace the previous non-directional corrective moves (wave 2 and 4).
Chart2: Running triangle and leading diagonal in downtrend
As mentioned the comparison is in a downtrend. Accordingly downward move is termed as directional move and move to the upside is termed as non-directional.
A running triangle has non-directional momentum ie faster moves to the upside (wave A, C and E) than the downward moves (Waves B and D). These non-directional moves donot retrace the previous move completely.
On the contrary, Leading diagonal has directional momentum ie faster moves to the downside (waves 1, 3 and 5) in the direction of trend and these downward moves completely retrace the previous non-directional corrective moves (wave 2 and 4).

What is a breakout? #breakout #Candlestick #TA #Tocademy
Hello. This is Tommy.
The lecture material I prepared today is a concept that must be well informed by TA(Technical Analysis) traders, especially in recent market where untraditional patterns, price actions and trends, as we call ‘scam moves’ occur all the time.
I bet you are familiar seeing retail traders or chart analysts shouting “breakout!”. In order to derive market trends and price action/momentum, we find millions of technical variables such as trendline, channel, Fibonacci retracements, pivot levels, and other indicators, etc. Then we seek for behavior of price action by observing whether these variables are kept valid (not broken) or become invalid as soon as they are broken. Understanding and utilizing this behavior, we make trading decisions by deducting optimal zones to enter position(support/resistance), set stoploss/target price(bottom/top), and statistically giving weights on particular scenarios.
In TA world, breakout means that the price has pierced through certain variables. It is commonly known that when the technical factors are broken, additional price momentum is expected towards the direction of the breakout. As the example above, let’s say that we found a falling trendline that are being formed, meaning that at certain point or area, trendline keeps pushing the price down forming LH(Lower High)s. As soon as the price pierce through the trendline, meaning that the trendline failed rejection, we say “trendline is broken above” and can expect more bullish rally. The direction of the trend would be vice versa when trendline under the price is broken below.
So, we buy when PA is broken above and sell when PA is broken below. That sounds so simple huh?
If it was that easy, everyone would be rich right now. I'm sure most of you reading this post are already aware that it's never easy. Why? It’s simple. In this world, there is no such thing as 100% “breakout”. To put it simply, everything we do based on the technical chart is somewhat relative, abstract, and subjective concept. It’s not like breakout has 100% succeeded, or failed but rather is more like breakout has succeeded in 60~70% chance. In other words, there are more than two possible future cases when we search and utilize breakout behavior.
So, we traders need a reliable standard to statistically quantify the ‘degree of breakout’. The most basic way according to the ‘textbook’ is to consider closing price of candlestick firstly crossing the variable. As the price of the candlestick closes above the trendline as case 3, we give a decent weight on breakout scenario.
However, case 2 is the one that confuses us every time. This is when the price did pierce through the trendline but closes below, usually leaving a long tail as a trace which sometimes is interpreted as a whipsaw. As soon as this happens, we have to admit that the chances and reliability is definitely lower than the case 3. It might be regarded as a false breakout or a noise if the trend continues afterwards and it might not actually. It’s a 50:50 call I would say.
When you encounter case 2, to give you a little tip, try waiting a little more to observe next following candles. If the next following candlesticks keep closing prices below, I would raise the probability that the breakout is a false one. In fact, it is best to just not give any meaning on breakout in case 2. It itself is a risk to confirm whether the breakout is successful, not successfully, or false and thus try not take aggressive trades in this very case.
Thank you for reading my posts. Trade Well!
Your likes, comments, and subscriptions are the greatest motivations for me to upload more posts.

KISS Candle Analysis, let's predict next week's candle togetherWe know that not all candles are the same. Statistically, various candle patterns are only as reliable as flipping a coin. I'm stating this, having analyzed candle patterns in the past early in my journey. Many don't talk about looking at each candle for what it is and reading the story that it tells you. Every candle tells us a battle that was fought and which side won. It's still a reflection of the past, but the momentum and energy carry forward, usually ending with a climax where the tides shift.
Similar to how many have enlightened my understanding in this journey, I want to share a bit of my knowledge with you today. I'm calling this the KISS candle analysis (KISS = keep it simple, stupid). The idea is that a few simple things can tell us a lot more than a complicated bunch of indicators, trend lines, fibs, pivots, fractals, etc. All we need to know is in the candle right there in front of us. Let's get right into it!
What we have is the weekly candle chart of BTC. I've highlighted the area showing the 5-week candles (I) in the recent past and the area from the past four weeks. They look somewhat similar, and some might call these even the same. However, reading each candle in detail tells us a different story. Each wick at the top of the past candles shows us a strong bearish force fighting the price down and then winning for a short while. Also, the bullish force that fought it. We can get an idea of that force and compare it to what we have witnessed over the past three weeks. Are they now the same? Which side is winning this battle, and how much further in the direction will the price reach, its top and the bottom? Is there a minimum distance price must travel in either direction?
Share your thoughts in the comments, and if I sparked your curiosity, please like so others might also join this discussion. I'm happy to share more if there is interest.

DXY - Elliott Wave Breakdown ✅Following on from our last post on DXY, we have moved up a considerable amount. In our last post we identified the higher timeframe impulsive move and waited for a catalyst, NFP, to move the market in our direction. See our previous post below:
In Elliott Wave Theory, the impulsive wave can be broken down into the following 5 waves:
Wave 1 - is made up of 5 subwaves (impulse)
Wave 2 - Is a corrective wave made up of 3 waves (ABC correction)
Wave 3 - is another impulse wave made up of 5 subwaves (impulse)
Wave 4 - is a corrective wave made up of 3 waves (ABC correction)
Wave 5 - Can be either an impulse or a correction - But its made up of 5 waves.
In this scenario, the 5th wave is appearing to be an impulsive move. We have a channel which we will be using as a guide to help us identify when the 5th wave will finish.
The way to use DXY is by doing the following: Bullish DXY = USD Strength. Bearish DXY = USD weakness
1. Analyse DXY for reversal zones and identify what the next move is
2. In our last post, we identified a reversal zone and we were waiting for NFP to be the catalyst to get the market moving (FEB 4th)
3. When DXY approaches the reversal zone, we go on to USD pairs and analyse them
4. Find a pair where you think USD will bounce/reject (depending on whether you're trading USD/XXX or XXX/USD)
e.g. in the VIP, we correlated DXY with EURUSD. We identified that we were bullish DXY = Bearish EURUSD. We had a trade setup ready and we were waiting for confirmation.
See below for the the VIP setup we had. Went into 10pip drawdown and hit TP of over 500pips = 1:50 RR.
Hope this post helped a little!
Goodluck and as always, trade safe!

Market Manipulation: Crypto Pump and Dump SchemesIf you look at the price charts for many cryptocurrencies, there is often a very sharp, sudden spike in their earlier days.
Most cryptocurrencies’ charts either have a more or less gradual decline or increase in price, or display a virtually straight horizontal line, indicating not so much a lack of volatility as a lack of trading or interest altogether in the project. You can also sometimes see big waves where the cryptocurrency was gradually manipulated or affected by markets.
But, in many cryptocurrencies, particularly the smaller, lesser-known ones, at one or more times in their history there is a sudden vertical needle in the charts, an almost instantaneous increase in its price by hundreds of percent, and then, shortly, or often even almost instantly, after, just as rapid a decline in its price, back to where it started.
If it didn’t happen so frequently, one might be forgiven for thinking it’s a blip in the charts, a mistake or a problem with the exchange. Except these needles happened all too frequently on charts of many of the smaller cryptocurrencies. These needles – sudden price increases in the hundreds of percent followed by a sharp collapse, were caused by a particular type of very legally grey trade known as the pump and dump.
In the world of crypto pump and dumps, some made money, often a lot, and most lost it all, often within seconds and often without really knowing what had hit them.
Manipulation of markets has gone on since trading began. Unfortunately for those wanting to profit from manipulating stocks and traditional assets, doing so is highly illegal, and tends to result in high fines and jail time.
However, greed, money, and success can be big motivators and there are always some who will keep pushing the grey areas of the law until they either get their way or get caught.
In crypto, there have been a lot of grey areas and the markets were volatile enough for individuals to manipulate to part hundreds of thousands of people, if not more, from their money in a whole series of promotions designed to pump and dump, project after project.
Stock exchanges that don’t take adequate measures to prevent stock manipulations can face heavy legal penalties, so for the most part they play above the law. Unlike traditional stocks where markets are heavily monitored and regulated, cryptocurrency, as we have already seen, has been a bit of a Wild West. Regulation is starting to come, but until then, crypto markets have been treated as a free-for-all adventure ground where anything goes.

5 Important Candle Patterns You Need to Know📚
🟢Candlestick patterns and models in technical analysis can be used to predict future price movement.
⚠️There are many different candle patterns. Not all of them work equally well and often their form is quite subjective. Therefore, it is not necessary to make trading decisions based on patterns alone. It would be best to combine them with support and resistance levels, moving averages or other technical analysis indicators that strengthen signals to enter the market.
❗️Remembering a lot of different candle patterns is not as useful as understanding what is really behind their appearance, and who is currently controlling the situation in the market — bulls or bears.
Let's look at the most popular and easiest to define patterns.
✅Bearish Engulfing
It is formed during the upward momentum of the price at the local highs of the chart. The first small green candle of the pattern indicates that the bulls are already tired and they need a break. The large red candle that appeared next, swallowing the green one with its body, indicates that the bears took advantage of the situation and actively moved into a counteroffensive.
Further movement of quotations downwards leads to the beginning of a downward correction. Confirmation of the beginning of the downward movement will be the price falling below the minimum of the second, large bearish candle pattern.
✅Bullish Engulfing
It is formed during the downward movement at the local minima of the price chart. The first small red candle of the pattern shows that the bears' strength is already running out, after which a large green candle appears, completely absorbing the body of the first one. This suggests that the bulls felt the weakness of the bears and actively went on the offensive.
Further upward movement of the price leads to the beginning of an upward correction. Confirmation of its beginning is the growth of quotations above the maximum of the second, large bullish candle pattern.
✅Doji
In fact, doji can be one of the most important patterns in combination with other technical analysis tools.
It shows indecision in the market and at its breakdown - it is possible to draw conclusions about the further probable price movement.
✅Shooting Star
A clear sign of the dominance of sellers.
After the opening of the candle, prices moved towards growth, but at the closing of the candle, sellers began to dominate buyers and the price closes near or below the opening price.
The tail of this candle shows that it was in it that sellers began to "Crush" buyers.
With such a pattern, there is a possibility of further decline.
✅Pin bar
A clear sign of the dominance of buyers.
After the opening of the candle, prices moved downward, but at the close of the candle, buyers began to dominate sellers and the price closes near or above the opening price.
The tail of this candle shows that it was in it that buyers began to "crush" sellers.
With such a pattern, there is a possibility of further growth.
❤️ Please, support our work with like & comment! ❤️

The analysis of the behavior of major player Part 1I would very much like to share with you my knowledge about the behavior of large players in the market,
how to notice them and how to use it.
It's very interesting and in fact you can talk about it for a very long time,
people have been studying these strategies for years.
I will try to explain the simplest first, this will be the first part.
If you look at the chart that I have shown, you will see the level underlined with a blue line, this is it, the stops of a major player, in the event of a breakdown of this level, a major player will exit by stops, which means a sale, since closing by stops for the exchange is tantamount to sale. Thus, at this moment, the price is guaranteed to go further down.😉
It was a first part.
Best wishes.
I will happy to see you in next parts😊

Wavefront CorrelationI recently rediscovered an indicator I made a while back. If you're familiar with my other indicators, you'll remember they are viewed from the side moving past us. In that view we are looking into a field of waves moving perpendcular to our frame of reference. Here the wave ithe view is if we were standing in front of the wave watching it movING towards us eternally. The red lines are the shorter timeframes, while the higher frequency colors (white, magenta, blue) are the longer timeframes. From this view, it's not only possible to more accurately see what the present wavefield looks like, it is also much easier to see if certain timeframes are correlating.
I sped up 2.5 months of replay data into a short clip and the results are damn interesting!
What do you think? Ever seen an indicator like this? Any thing I should consider?

Will nifty started to uptrend after 3 swings to downWill it nifty started to move uptrend after 3 swing down to 15860 level. In 15 min chart looks like wave 1 as completed and wave 2 ABC structure formed to down side, we can expect wave 2 to downside upto 16950 if crosses below that level wave count are invalid. If nifty started to upside from present level and crosses 17400 than 3 wave starts we can expect nifty to form HH levels.
Disclaimer
Only for educational purposes not recommending anything.

Basket trading for max gains and min losses 🧺 🤑 Many of you probably aren't familiar with a trading strategy called basket trading. I got first introduced to it from my Forex trading days and immediately saw its value. I apply that to Crypto trading to minimize my losses and keep my trades stable and less volatile. It also allows me to harvest profits as targets are reached.
Here are the facts about the market. Market comes across looking random because many cannot quantify the factors that contribute to price movement, and therefore it appears random. We can take that assumption as a fact. Due to various timing factors, the market appears random within a certain time range. We can use this randomness to our benefit. This means if we trade a basket of cryptos that exhibit various timing and trend attributes, then we end up with a single "currency" or asset that tends to move in more of a sinusoidal pattern with a bias towards a direction. Price tends to cross the 0% gain line, often giving us many opportunities to adjust that basket. These adjustments involve taking out profit and breaking even from other coins. If the basket trend is bullish or bearish, that's all you need to make a profit from the basket.
You can use the amazing TradingView feature of combing cryptos quickly to create your basket. More about the feature is here:
Here is a quick tutorial on how to perform this exercise of creating a basket. The more coins you have, the smoother the movement will be, and more often, it will reach the 0% gain level. The advantage here is that this acts as a "stop-loss" without taking a loss, and you can harvest profits with TP limit orders.
Determine the series of coins that you think are bullish or bearish. Stick to only one direction. Let's say for this example; you went with bullish.
Determine the volatility of each coin: meaning, the general % movement of the price that is expected typically.
Use that volatility to determine the % of the investment that should go towards each coin.
Now, create the chart formula based on that percentage, and you got yourself what the basket of currencies looks like.
Here is an example:
BTCUSD, ETHUSD, JASMYUSD, AVAXUSD
BTCUSD->2%, ETHUSD->5%, JASMYUSD->15%, AVAXUSD->9% (not real values)
If I have $1000, I will invest most into BETC and least into JASMYUSD to make my overall basket constant in volatility. This yields about BTCUSDx4, ETHUSDx1.8, JASMYUSDx0.1, AVAXUSDx0.7. If you put $100 in each coin, multiply it by the multiplier, $400 on BTCUSD, $180 on ETH, etc. You can play however you like. You can maximize for higher risk as well.
Now on the TradeView chart, enter the formula for the coin to see the single basket currency made up of your combination: BTCUSD*4+ETHUSD*1.8+JASMYUSD*0.1+AVAXUSD*0.7
I also add each coin, so I see how the coin itself moves relative to the others. You can apply indicators and whatever you like to it and trade it just likes how you would trade anything. All the math that applies to a single chart applies to this basket. I'm yet to see a platform that lets us easily trade complex strategies like this, so I'm making my own for trading purposes. If you know of one, please let me know in the comments so that I can try it out.
If you have any questions, please ask, and I will try my best to answer. If you found this interesting or helpful, please like it! Thank you!
Please keep in mind that this is not a guaranteed way to make profits. There are still risks like the entire crypto market going against you. This happens when there are fundamental changes that affect the market. Please trade at your own risk and play it safe.

Analyst and Trader. What are the differences?👨🎓👩🎓
✅Trading on the market consists of two different, but equally important tasks, namely: market analysis and the ability to trade.
✅Market analysis is a technical or fundamental analysis of price movements in the market, and trading is the ability to competently place orders for the purchase or sale of various market assets in order to make trading as profitable as possible. Most traders do not take into account the difference between market analysis and trading rules. But knowing these differences can significantly increase the profitability of your trading system or, at least, will help to avoid significant mistakes initially.
🟢Analyst or trader?
❗️When making transactions on the stock exchange, traders often consider themselves both an experienced trader and an analyst at the same time, since they perform all the analyses and trading independently. But not every trader can be experienced in both tasks at once. Some stock speculators analyze the market very well, but make mistakes when trading, and vice versa, not strong market analysts successfully make entries and exits from the market.
❗️Therefore, very often, one person can be an excellent market analyst, but his trading system falls apart under the pressure of incorrectly executed transactions (i.e. placement and management of already completed transactions). While another trader may not be strong in market analytics, but has a psychological profile that is ideal for making trades.
⚠️At the same time, both those and others can make a constant profit by following the rules in their trading systems.
🟢Why is this happening?
The thing is that analysis and trading are very different tasks and require different psychological traits. For example, market analysis as a separate task does not bring either profit or loss, since market analysis itself cannot lose capital, so this activity does not carry emotions associated with it (for example, fear or greed). On the other hand, trading, as an isolated task, brings either profit or loss, that is, by making purchases, there is an opportunity to lose partially or completely trading capital. Therefore, those emotions that are not applicable to market analysis are very relevant for trading.
🟢Trade Partnership
❗️One of the solutions to overcome the differences between analysis and trading in the market is to find your opposite and form a potentially very profitable trading partnership. For example, if you are a good market analyst (i.e. you can identify potentially profitable trades), forming a partnership with a trader, i.e. with someone who is not able to perform correct market analysis, but can competently make and manage transactions without succumbing to emotional traps. Such an alliance can be much more beneficial for both.
❤️ Please, support our work with like & comment! ❤️

Gold to go bullish over next two years.Gold beginning to grow again after a lengthy accumulation phase. Expecting better than average volatility.

The Hidden Truth Behind SMCSmart Money Concept or rather 'SMC' is the new retail approach to the market with virtually everyone involved with this method yet people are still loosing money and blowing accounts, the question is why? Click on the video and find out.

#Educational #Educational Post For Learning Purpose. How To Draw Order Block. How to Take a Profitable Trade Thank You, Traders, for Your Support Like and Follow.


What are Moving Averages & how to make money on them?📚
🟢The main rule of using Moving Average is to track the general direction of the moving average: it indicates the dominant trend in the market. It is worth making deals only in the direction of this movement. Such a simple rule makes the moving average method a convenient tool for short-term forecasting.
🟢A universal tool in almost all markets is a simple moving average (SMA) with a 200-day averaging period. A longer-term moving average will allow you to see the global rise or fall of the asset, avoid short-term fluctuations or minor consolidation of the exchange rate. As a rule, short moving averages allow you to react more actively to price movements and are designed to search for short-term trends. When analyzing the price chart on a daily or even shorter interval, many traders use "fast" EMAS with different averaging periods (5, 7, 13, 21, 50).
✅To date, there are many recommendations for the period of the moving average (3, 5, 7, 13, 21, ...), as well as methods of its calculation (SMA, WMA, EMA). The general postulates are as follows:
✅The "faster" the MA (EMA) and the shorter the calculation period (3, 5, 13, ...), the more likely it is to receive false or ambiguous signals;
✅The "slower" the MA (SMA) and the longer the calculation period (50, 100, ...), the more likely the moving average is to lag behind the real state of affairs in the market.
❗️The moving average method is still a universal way to determine the trend in the asset market. Ease of use and unambiguous interpretation of the result allow the investor to determine the prevailing trend with a high degree of probability. This minimizes the risk of making unprofitable deals. The use of the method as an independent tool when deciding on a transaction is controversial, since all possible successful combinations of the intersection of moving averages or the average and the asset price are subject to cyclicity and sometimes give false or ambiguous signals.
❤️ Please, support our work with like & comment! ❤️

Waving beautifullyTriangles are a holding price pattern that separate 2 Impulsive moves. They are very reliable and you can profit hugely from them. They only appear in wave 4 or B in a Correction.

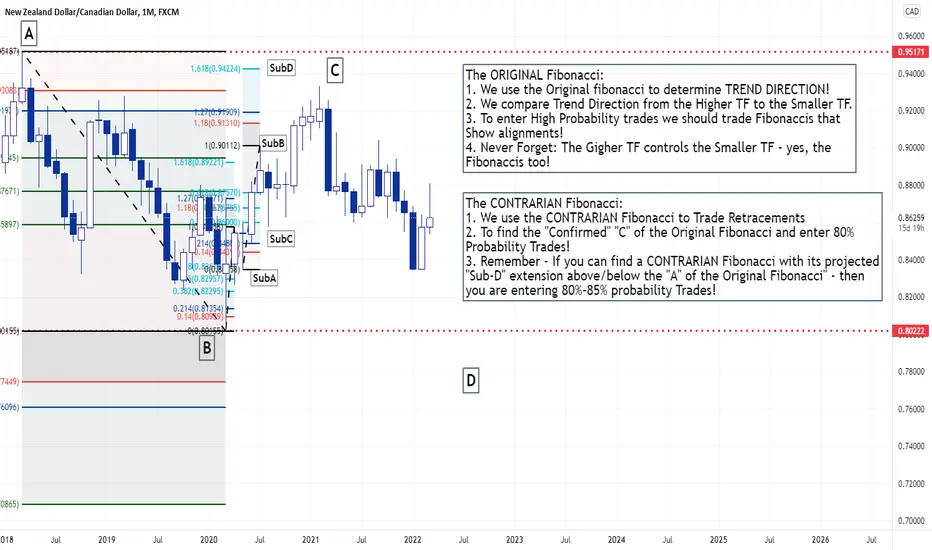
FOREX-The Original Fibonacci versus the CONTRARIAN Fibonacci FROM the FOREX COURSE 101 - Weekly Lesson:
Points to remember about the 2 Fibonaccis:
The ORIGINAL Fibonacci:
1. We use the Original fibonacci to determine TREND DIRECTION!
2. We compare Trend Direction from the Higher TF to the Smaller TF.
3. To enter High Probability trades we should trade Fibonaccis that show alignments!
4. Never Forget: The Gigher TF controls the Smaller TF - yes, the Fibonaccis too!
The CONTRARIAN Fibonacci:
1. We use the CONTRARIAN Fibonacci to Trade Retracements
2. To find the "Confirmed" "C" of the Original Fibonacci and enter 80% Probability Trades!
3. Remember - If you can find a CONTRARIAN Fibonacci with its projected "Sub-D" extension above/below the "A" of the Original Fibonacci" - then you are entering 80%-85% probability Trades!
***Tomorrow - 16-3-2022*** - in our WEEKLY LESSON (2021 Students) we are going to go through some charts and take a closer look on how to trade the two Fibonaccis and talk about Probabilites!
Hope this helps % See you in Class
FXP
Elliott Wave Theory - Motive WavesElliott Wave Theory , developed by Ralph Nelson Elliott, proposes that the seemingly chaotic behaviour of the different financial markets isn’t actually chaotic. In fact the markets moves in predictable, repetitive cycles or waves and can be measured and forecast using Fibonacci numbers.
The very basics of Elliott Wave Theory ;
The Elliott wave principle at its core consists of motive waves, movement in the direction of the larger trend, and corrective waves, any correction against the main trend. Market prices alternate between a motive phase, and a corrective phase on all time scales of trend.
Wave analysis offers insights into trend dynamics and helps you understand price movements in a much deeper way and offers the trader a level of anticipation and/or prediction when searching for trading opportunities
Motive Waves
Motive waves in general can be categorized as Impulse and Diagonal waves
a- Impulse Waves
Impulse waves consist of five sub-waves in the same direction as the trend of one larger degree.
Elliott proposed that financial price trends, the waves, are created by investor psychology or sentiment and the waves can be measured and forecast using Fibonacci numbers . In adition to using fibonacci retracments and extetion to forcast probable targets, channeling technique is also presented, where channeling technique is used to forecast wave formations and targets using price action .
Disclaimer: besides the rules, the below presented figures displays guidelines that elliott waves may form. Guidelines are tendencies, not set in stone rules
b- Diagonal Waves (Wedges)
Another form of motive waves are diagonals, they appear in the beginning of a larger trend, called leading diagonal and at the end of the larger trend, called ending diagonal
They are five-wave structures in the direction of the main trend within which wave 4 almost always moves into the price territory of (overlaps) wave 1, breaking the rule of impulse motive wave
Diagonals take a wedge shape within two converging lines
Elliott was careful to note that these patterns do not provide any kind of certainty about future price movement, but rather, serve in helping to order the probabilities for future market action. They can be used in conjunction with other forms of technical and fundamental analysis, including technical indicators, to identify specific opportunities.
Technical Indicators
Using various technical indicators among elliott wave practitioners is not so common, except few, probably the common one used is a kind of momentum indicator, such as RSI or MACD , to detect divergencies
Fibonacci retracement and extension drawing tools are essential for elliott wave practitioners. In todays computerized era many of the darawing tool's auto indicator versions are availabe on the trading platforms, such as Auto Fib ( where and how tp apply )
Elliott Wave Oscillator ( EWO ) , is inspired by the Elliott Wave principle and helps counting the waves
Volume and Volume Profile ( Vol / Vol Profile ) combined with price action is esential in technical anlaysis and for elliott wave practitioners helps to identify impulse and correction phases
Other indicators that are referred among elliott wave practitioners
Pitchforks ( how to apply ), Pitchfans , FibFans ( how to apply ), FibChannels ( how to apply ), FibTime , LinReg Channel ( what it is ), Raff Regression Channel ( what it is ), etc

Learn Trend Analysis | Impulse & Retracement Legs 📈
Hey traders,
As you asked me, in this educational post we will discuss some price action basics.
No matter whether you are a fundamental trader or a technical trader you should be able to execute trend analysis.
You should always know where the market is going; if it is bullish or bearish.
One of the simplest ways to execute trend analysis is to perceive a price chart as a sequence of impulses and retracements.
➖The impulse leg is a trend-following move.
It is characterized by heightened movement dynamics and speed.
Usually the completion point of the impulse:
sets a new lower low in a bearish trend,
sets a new higher high in a bullish trend.
➖A retracement leg is a correctional movement within the trend.
Its’ initial point is the completion point of the impulse or retracement leg and
its completion point might be an initial point of a new retracement leg or of a new impulse leg.
Usually, a retracement leg is characterized by a slow zig-zag movement.
Usually the completion point of the impulse leg:
sets a lower high in a bearish trend,
sets a higher low in a bullish trend.
Perceiving the price chart as the set of impulses, one can easily and objectively identify a global, mid-term and short-term market trend, price action trend-following, reversal and correctional patterns.
What do you want to learn in the next educational articles?
❤️Please, support this idea with like and comment!❤️

SPY Elliott Wave 3-11Hello all!
Just posting this for education purposes, maybe for myself as well. Post comments about your disagreements or thoughts.
Looks like a full impulse wave, happened on 3-11, I have not plugged this into the overall Elliott Wave trend so I can not point you in one way or the other. I was working on this for a friend and thought I would post here too.
