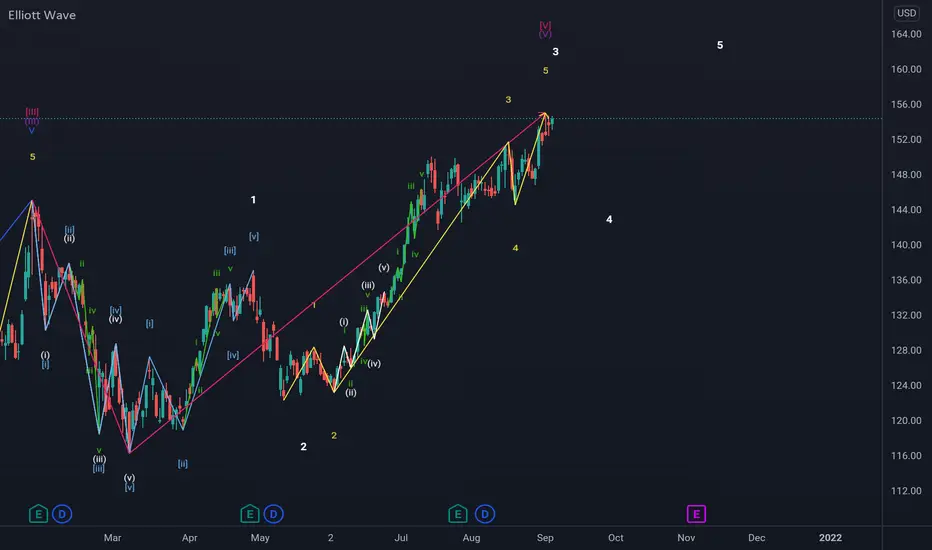
Elliot Wave (Failed Breakout) creates long-term growth potentialTGTX made an Elliot Wave but it failed to continue the trend after the Correction Wave and it collapsed.
However, The Elliot Impulse Wave did create potential for TGTX because it built up a good Trend Channel.
To continue to grow, it would need to enter Trend Channel first and then stabilize within it.
The green dotted line is where it needs to go.
Note: This is for Educational Purposes Only.
Wave Analysis

✨ The Dejavu Effect ✨What is Dejavu?
Dejavu is a term used to describe a feeling that one has lived through the present situation before.
How does this tie in with the markets?
Technical analysis is based on patterns repeating itself over and over again. Technical analysts believe past trading activity and price action can be valuable indicators to future price movement.
How can we prepare ourselves?
Some of the ways we can prepare ourselves is by doing the following:
- Learning patterns that reoccur over and over again such as bull flags, wedges etc.
- Identifying candlestick formations and understand what they mean e.g. shooting star candles means there’s a possible trend reversal from bullish to bearish
- Learning to identify structure levels where price can react in the future
- Understanding fibonacci and learning how to use it effectively.
[Once we’ve identified a possible market dejavu moment, what next?
Following identification, the next step is confirming whether this is in fact a similar move to historic price movements. The types of confirmations that can be used are the following:
- Trendline breakout
- Fibonacci rejection
- Lower timeframe patterns
- Moving average strategies
__________________________________________________
EURUSD - The Dejavu Effect
1. Bullish Correction. We identified a falling wedge which resulted in price moving higher.
2. Bear Correction. The bullish move was short lived with a bearish correction which resulted in…
3. Three Wave Falling Wedge. This falling wedge pushed price up to the double top region.
4. Ascending Correction. The move up to the double top could be monitored using an ascending trend line to monitor the correction.
5. Minor drop. Once price broke down, we had a minor drop.
6. Major drop. After another small correction we had a major drop.
Notice how we didn’t specify whether we were talking about the Blue phase or Red red phase… Dejavu.

The 3D Quality of Truth, Crypto Allure XMR TotMCap
How does one communicate in text, the purely visual.
Scale is Auto though non logical, because subject beyond logic.
These are programmed outcome assets.
Programmed outcome.
CRYPTOCAP:XMR
CRYPTOCAP:BTC
Do you understand ? Do you see ? Help me help you lol
dMR96

Supply and Reversal | EducationalSupply and Reversal on uptrend Market. Always trade the right supply.

POWER OF CHART PATTERNSHi,
If you know the pattern & can identify it correctly during the formulation. You can easily enter & target a proper level. Just like in the previous XAUUSD idea in which we targeted the Previous move which was inside the pattern and banked 170+ pips. If you had an eye on it you could have easily targeted our next target which is 3x of the last one. So this h
See ya!

whats the differance between these 2 trend ?Hello guys
this is educational post and most important for any Traders
these two movement have same move As the making HH and HL but in the first one the power of buyers and bullish are diminishing because for the condition of movement , if you see this movement is going like this and its near the support or resistance zone it means the chance of change trend is more than continuing the last trend .
But in second condition we are making HH and then pullback and make HL then HH and ... but in this movement the price rise then some rest and after that Buyer power is accumulated and jump the price
These two movement are making HH and HL but these differance and condition of movement is important , be careful for the movement and you can see it like in BTCUSDT movement in 1D time frame before fall down from 65k to 30k and more example in any chart you can see
Good Luck
Abtin

Market Maker Method 🎯The market has cycles, bullish and bearish . How can I identify a bullish cycle and when a possible cycle changes? Well, for your concerns there is the market maker method, which is used for the forex market, with this method you can identify the up and down cycles of the price and when it can possibly change trend or make a correction, this method called "Market maker" It is one of my favorite price indicators to know how to identify the

HOW-TO: Use multi time frame Analysis with the MTP ScriptsIn this How-To video, we take a look at how to use a Multi time frame approach when using the MTPredictor Script. As an example we take a look at a recent Chart of BTCUSD on 15min / 1hr Charts
As you will see from the video, the idea is that we look to only trade on the "Shorter time frame", when we get a clear picture, using reversals at our MTPredictor Decision Point DP) levels on the higher time frame charts. At other times, we deem that the market is in a Random picture and as such the picture is not clear, therefore no Analysis should be attempted.
Remember, MTPredictor is not a "Black Box" system, where all signals should be taken, we only suggest considering trade setups, when there is a clear picture on the Higher time frame charts, as shown in this example.
Please also remember, that no matter how clear the picture may seem, losses can and always will unfold when trading, that is why Stops are vital. Please keep your losses small, and then look to run your Profits. The aim is, over time, to have Profits that are larger than the losses, which does not mean a high % of winners, just that the winners are larger than the losses over time. Size does really matter in this case.
Lastly, please note: this is not a trade recommendation, you should all perform your own Analysis. Losses can and will unfold when Trading, please always use Stops and keep your losses small.

The five elliott wave structures 😁💸These 5 patterns can be used to detect a trend, a change in trend and trend continuation. This is educational for the tardingview community.

Triangular Wave PatternsThis is an educational idea that represents the types of corrections that the triangular marking makes, either bearish or bullish depending on the trend. This can go a long way in various markets so that you can identify where the market is likely to go.

Trends-Waves-Momentum-Patterns "Key concepts of trading"I am writing this idea to document my learnings in wave analysis. Your thoughts and comments on this document are welcomed for discussion.
Identification of waves and wave patterns is critical in wave analysis. I have seen that MOMENTUM is a key indicator in wave analysis.
There are four main concepts I use in my analysis:
1. Trend – It is defined as the direction in which the price is moving. Trend can be a downtrend or an uptrend. Downtrend shall be marked by a series of lower highs and lower lows. Uptrend shall be marked by a series of higher highs and higher lows.
2. Momentum – It can be defined as the pace at which the price moves i.e distance / time or the rate of change in price. Momentum is a relative measurement. it is measured with reference to the previous move and accordingly the momentum can be strong or weak compared to the previous move.
3. Wave – It is defined as a price move through time in a specific direction either up or down. Period should cover at least 2 candles or bars in a timeframe to form a wave.
4. Pattern is defined as a group of up and down waves formed in a specific manner. Patterns can be motive or corrective.
EURINR chart which I am following shall be used to explain the concepts. Price action in daily chart within the box shown in Chart 1 shall be in scope of analysis.
Chart 1:
The direction of price action within the box is downwards and hence the trend is down trend. Marking highs and lows within the trend is too early right now without applying the concept of wave moves. Accordingly, the following chart is marked with waves lines based on direction of price move.
Chart 2:
In the above chart there is a blue box marked with a purpose to explain why the price action in the box is marked as 1 single wave. Box is zoomed into and alternate possibility of marking waves within the box is represented below.
Chart 3
It could be seen above that the last candle in the box makes both the new low and high of the wave and there is no other possibility to mark it. However according to the definition of wave it cannot be formed with 1 period (candle) in a time frame. Hence the whole move is marked as a single move.
Now that the highs and lows in the trend are clearly visible, chart 2 shall be taken for further analysis. Based on clarity of waves movements the price action can be ripped apart as directional and corrective periods and represented in chart 4
Chart 4
Now getting into the logic behind identification of directional and corrective periods. Let’s analyse directional period-1 given in chart 4. Chart 5 is incorporated with momentum to analyse directional period-1.
Chart 5
Momentum of upward movement of price is marked in blue and downward movement in red. It can be seen from the above chart that the price movement to the downside (in red boxes) retraces the upward moves faster i.e. on the left hand side, price moved up by 0.8540 in 1 bar but at the same time it retraced the whole price and moved down by 0.8970 in 1 bar the next day and continued downwards. Similar momentum correlation can be found on the right-hand side of chart 5. Accordingly, the momentum is towards the downside and the price movement is directional during this period.
Now let’s analyse the momentum of price moves in correction period marked in chart 4. Chart 6 shows the analysis.
Chart 6
In chart 6 the momentum of downward price move is weaker than the upward price move. Momentum in chart 6 is in contrast with momentum in chart 5. This means the momentum of directional (downward and trending) move is weaker than the counter trend moves (upward move) hence this period contains corrective price action to the directional period-1.
Now let’s find the end of correction period-1 and resumption of directional moves in directional period-2. See chart 7.
Chart 7
Box marked with bold black border in chart 7 is the area where correction period ended. Change in momentum getting stronger towards the downside can be seen in bold black bordered box. 0.9414 up move which happened in 4 bars was engulphed by 1 bar to the downside marking the end of correction period and start of directional period-2.
Concepts of waves, momentum and trend being applied, now let’s get into marking the waves with Elliot wave counts. Chart 8 shows the Elliot wave counts and the patterns.
Chart 8
Chart 8 without minor waves
Now the query is how the move in box with bold black bordered box became wave 4 in Directional wave -2. Lets see it in Chart 9.
Chart 9
This is again due to the bias in momentum of up and down moves. The up move on the left-hand side(blue area) is with strong momentum than the down (directional) move (red area). The pattern within the box forms a C-failure flat pattern which upon completion resumes directional down move with strong momentum.
And finally the directional and corrective periods can be labelled with higher degree Elliot waves and the chart gets represented in Chart 10
Chart 10
Yes, it’s a ABC zigzag correction. Its labelled ABC instead of 123 because the momentum of Wave C is weaker than Wave A. In contrast if it is wave 3 it is expected to have strong momentum than wave 1. Conclusion: It’s an ABC correction.
Use momentum to identify the nature of future moves and enjoy trading.
This is how the messy chart 1 was simplified as chart 10 to identify the direction of price action, wave counts, patterns. There is no trade plan shared in this document but identification of directional and correction moves, identification of end of directional and correction periods, identification, counting and labelling wave patterns with this approach shall provide an objective insight in taking trades.
Once again HAPPY TRADING😊!!!!!!!!

Elliott Waves 12345 (How To Trade)Elliott Waves (How To Trade):
Rules and Guidelines
Rule 1: Wave 3 Is Never the Shortest
This rule means that Wave 3 is always longer than at least one of the other two waves (Waves 1 or 2). Usually, Wave 3 is longer than both these waves.
You should never look for Wave 3 to be shorter than both the other two waves. At times, Wave 3 may end up to be equal in length, but never the shortest. There is no exception to this rule.
Rule 2: Wave 4 Should Not Overlap Wave 1
This means the end of Wave 4 should not trade below the peak of Wave 1. This rule cannot be violated in Cash markets.
Elliott Wave Corrections
Corrections are very hard to master. Most Elliott Traders make money during an impulse pattern and then lose it back during the corrective phase.
An impulse pattern consists of five waves. The corrective pattern consists of 3 waves, with the exception of a triangle. An Impulse pattern is always followed
by a Corrective pattern. Corrective patterns can be grouped into two different categories: 1) Simple correction 2) Complex correction
Note: would stick with only trading impulse waves of a 12345 Elliott wave pattern r/t better profits and correction waves are hard to master.

Is BTC entering the grand super cycleI have always been bullish with cryptocurrency, especially in BTC even though many will argue that it has not much of a usage apart from just transaction. But BTC has and will be the leader since it has garnered the most attention from the institutions and even countries like El Salvador.
Mores o, Citibank has come out with the current report on cryptocurrency, last being in 2014 stating the potential of the currency itself. Remember, wave 1 is always the time where it gets attention from the people. Many eager eyes from the insitutions and big players might have been accumulating the currency during the correction, namely Cathie Wood, JP Morgan etc....The usage of blockchain technology is spreading like wildfire.
I remember during the 2017 bullrun it was brought on by ICO and the crypto millionaire frenzy. But this time is different. The years long of development in the technology has successfully garnered the attention of many tech players and businesses. Players like VET has successfully penetrated the commercial world. You name a few coins and you will see businesses are beginning the use the service. It is becoming mainstream sooner or later.
It's quite interesting to look at BTC chart in a longer time frame such a weekly or even monthly. What has really struck me was the bullishness of the currency itself. Be it weekly or monthly, it just shows the signs of bull. The uptrending in price between August 2020 till April 2021 might be just the 1st wave it has done. The correction until August might be the end of wave 2 which correlates with the falling to the support of 0.618.
if this holds true, the 3rd wave is just beginning to form. The third wave is where most people will catch on the rocket and is always the longest wave form. The third wave usually achieves 1.618, 2.618 or even 3.618 of the 1st wave. But bear in mind in each wave, there will be a smaller wave of correction. Meaning, the saying of hold and buy the dip still holds true. Since it's long term bullish, traders just have to buy the dip and sell according to the resistance using fib and patterns in the chart (please correct me)
Whether should we compare to the price chart in 2013/14 or 2017/18 is not relevant to me because they are just reference.
Many people have been commenting about bubble. Yes, anything that is too hot will have to take some chiller. But not this time. I strongly believe as long as the currency has not gone mainstream and adopted by most companies, there bubble is still not yet to burst.
If BTC can achieve even half of the market cap of gold, then it might reach the height of 300k or even 500k. Mind you it's the circulating supply that matters. We know that there are BTC that are missing forever due to certain reasons.
I am here to provide some perspective of the currency if anyone is still in doubt of the potential of cryptocurrency. Cryptocurrency is here to stay. I will not say it will bubble for the next few years. BTC might be having a bullrun for the longest period of time
I would appreciate if anyone can comment on the idea to give more perspective.

Trading phycology Elliot Wave 12345If you are interested in charting elliotwave where many thinks its a holy grail of making profit in the market like me I have here to share the knowledge.

Order Blocks live Discuss with Bangla Order blocks really amazing for day trading - we are sharing order blocks system setup ..

Weak BullsBulls lost pressure. To many Buyers in wait but it could be another day for any signs of champion

Elliot wave with Diagonal Ending Elliott Wave Count in Bitcoin Daily Chart
In most cases, if wave 5 is formed as a diagonal triangle, it will cause severe falls after the end of the process.
So after recognizing these diagonal triangles in wave 5 - you can close your long trades at the right point and make good profits from short trading in corrections waves.
Please like our tutorial and follow us
------------------------------------------------------------------------------------------------------------------------------------------
You can see our analysis and signals in the following links :

How to Target wave 3 and wave 5 of Elliott waveElliott wave target is quite accurate target zone help you a lot in trading
As this chart and thumbnail chart I expecting price come down wave 4 or continue go to yellow target then make wave 4
So how can we target, firstly to target wave 5 we have to identify which wave is extension
• If wave 1 is extension
We use Fibonacci extension 012
With 0.618(major), 1, 1.618 level
In this chart price had reached 0.618 next target is 1
• If wave 3 is extension
We use Fibonacci extension 014
With 0.618, 1(major), 1.618 level
• If wave 5 is extension
We use Fibonacci extension 034
At this point we draw we don't know it is ext 5 or not but if price keep going we need to watch this level
With 0.618, 1, 1.618(major) level
To Target wave 3 first We use Fibonacci extension 012
With 1, 1.618, 1.786, 2.618
Video - Relationships Between Corrective WavesEducational video on how to anticipate the end of corrective waves so you can rejoin the trend.

Learning Parallel Channel TrapsSometimes we can get so caught up in the fear of missing out on the breakout that we forget it could be a trap.
It is always crucial to listen to your intuition when you see these easy setups because more often than not they are more complex than they seem.
In this example, a breakout occurred and buyers put stops below the last structure, a few days later this structure got raided for liquidity.
Once the liquidity was gathered we began to see the true move to the upside.
Do you see this often in the markets?

The importance of the STOPLOSS protective orderThe importance of the STOPLOSS protective order
Our protective stops are vital to managing our risk, and just a single position you open without a stop can lead to the suicide of your trading account.
The uniqueness of stop orders lies in the fact that they, being pending orders, await their execution at a predetermined price. When stop orders are triggered, their important function is that they add momentum to the market and at the same time use the liquidity present in the market.
1)
Many have probably heard such information as: "When entering a trade, place a protective stop just below the high / low of the price." The reason is that this level has been identified as an important support level .
What else is posted in the support area? Limit orders of traders to buy, who have identified the support area and are waiting for the time to open a position when retesting the level.
Is there a large number of stops under each level? It depends on the size of the timeframe and how quickly the price leaves the given zone at the time of purchase.
2)
When the price gets to this level, traders are still interested in long positions, but this time the price does not bounce off that level as one would expect. It does not break it, does not make lower lows, but displays lower highs.
If you were interested in going long right now, what would you do? The average trader who bounces off the support level would enter a long position with a stop just below the support level . If you had a limit order that hadn't been filled yet, I would have postponed the order.
Candlesticks / Bars displays lower highs; The price does not rise as fast as one might expect; You know that just below the support area there are a lot of stop orders.
3)
What happens next? The price moves downward under pressure and breaks the stops of traders who have long positions, and, as we remember, when buy stops are triggered, these are market sell orders, and they force the price to move further down.
And traders, who are waiting for the opening of short positions, open them because the price breaks the support level , but then the market takes them out, “eats” them, because the price goes higher.
4) Those traders who were initially set for long positions and who were thrown out of the market by broken stops help push the price up. Now the graph looks like this:
New stops are placed below the new level, in front of us is Groundhog Day. And everything that has just been played will be played over and over again ... only at different price levels.
STOPLOSS is a way to limit losses when managing an open trading position or portfolio of positions. In fact, a stop loss is an order to close a position in the event of an unfavorable price movement.
The trader sets a stop loss to limit his own losses and trade within his own money management rules.
Find me on:

Identifying Impulses and correctionsHerein is a simple way of identifying motive/impulse moves. The motive moves are where the price is moving sharply in the direction of the trend. Price thereafter starts struggling on the opposite direction and then continues in the direction of the motive move.
Looking at the MACD indicator we expect the price to correct from the current point until it comes close to the trendline.

Fibonacci projection possibilities for wave 3Graphical representation for possible wave 3 projections under ideal conditions.
100% of wave 1 is the minimum projection limit for wave 3 with no limitation for its further projection
