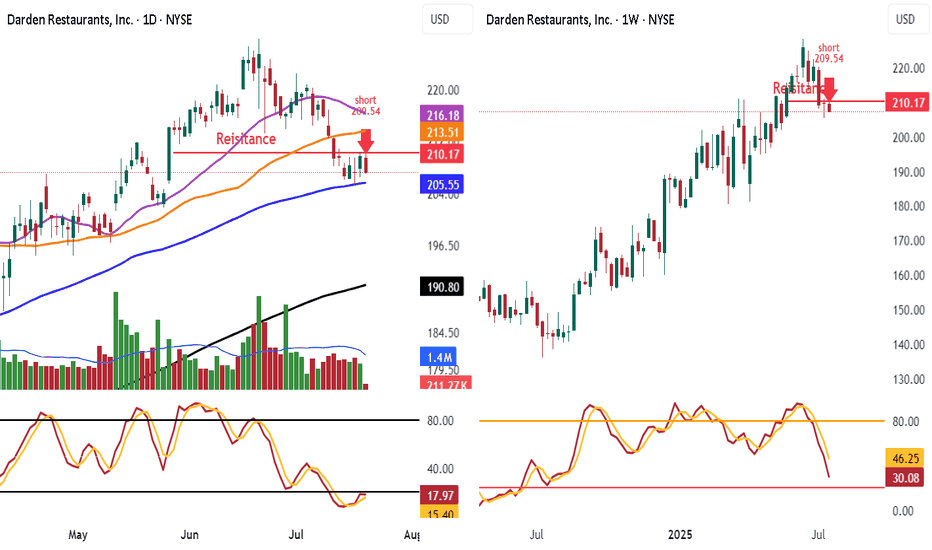
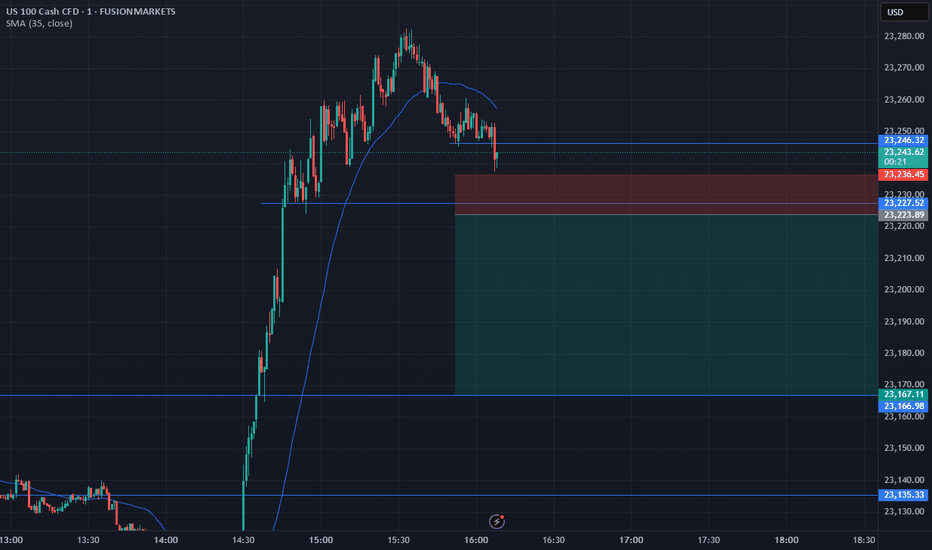
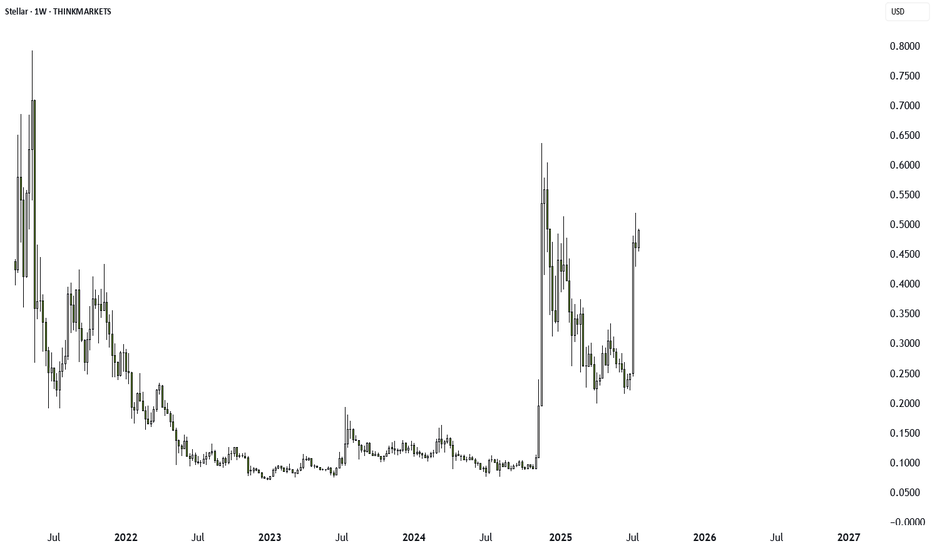
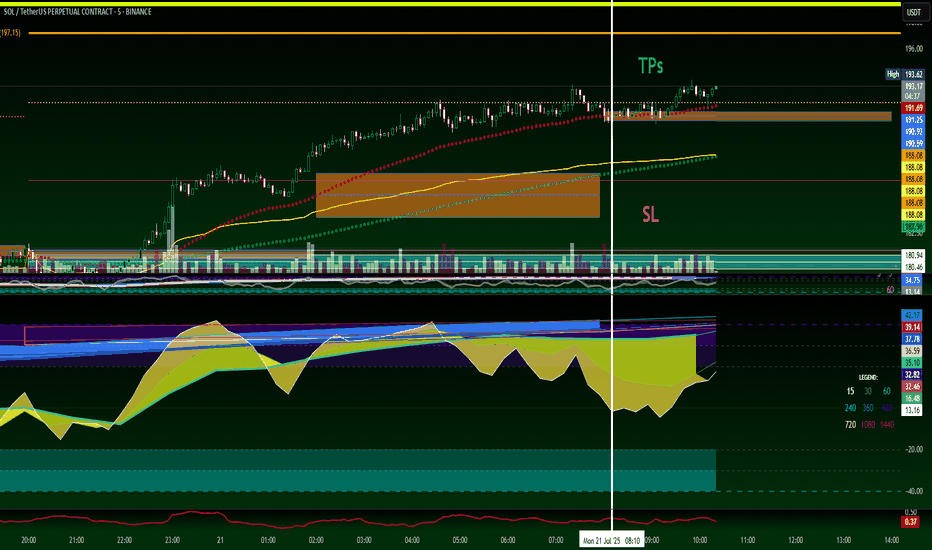
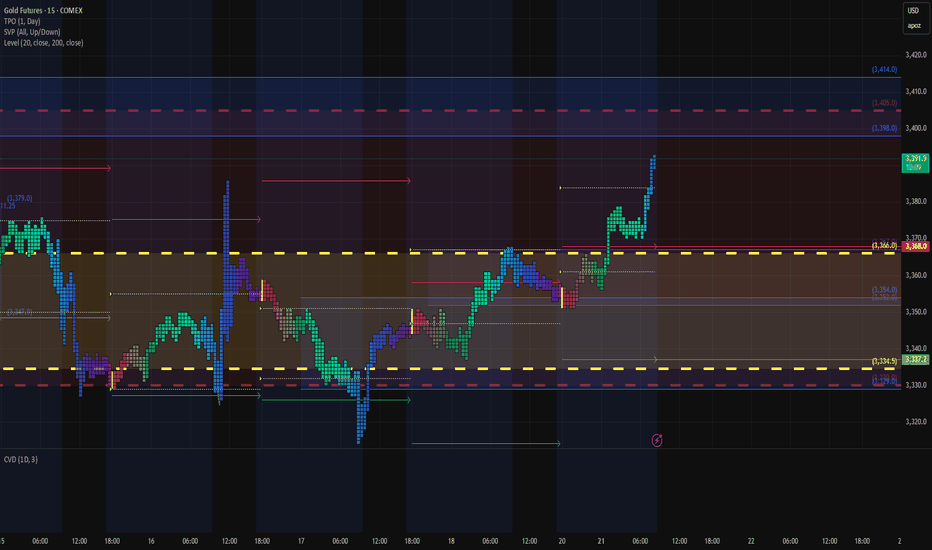
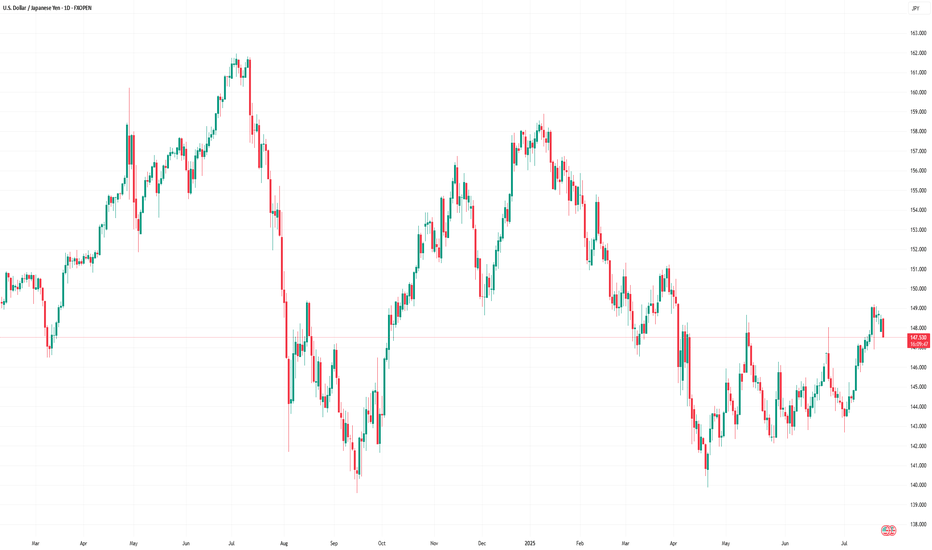
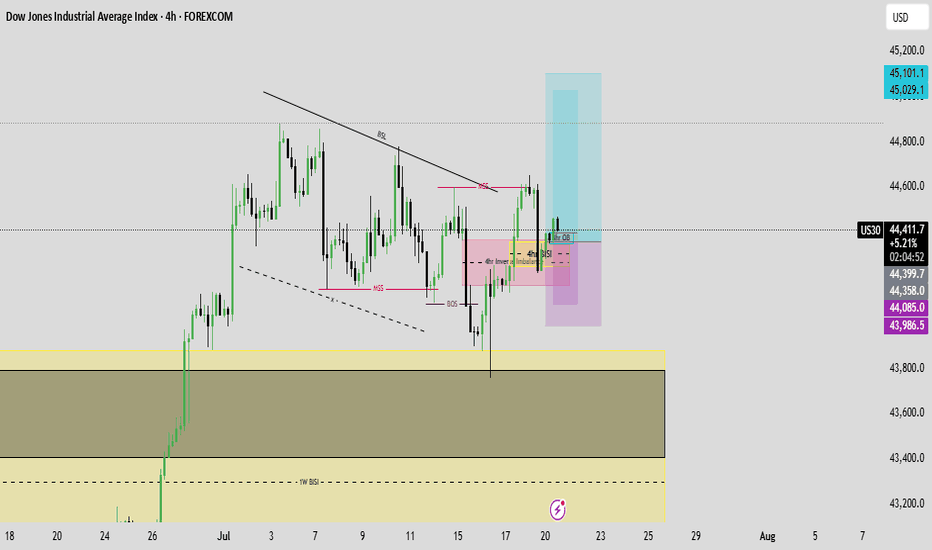
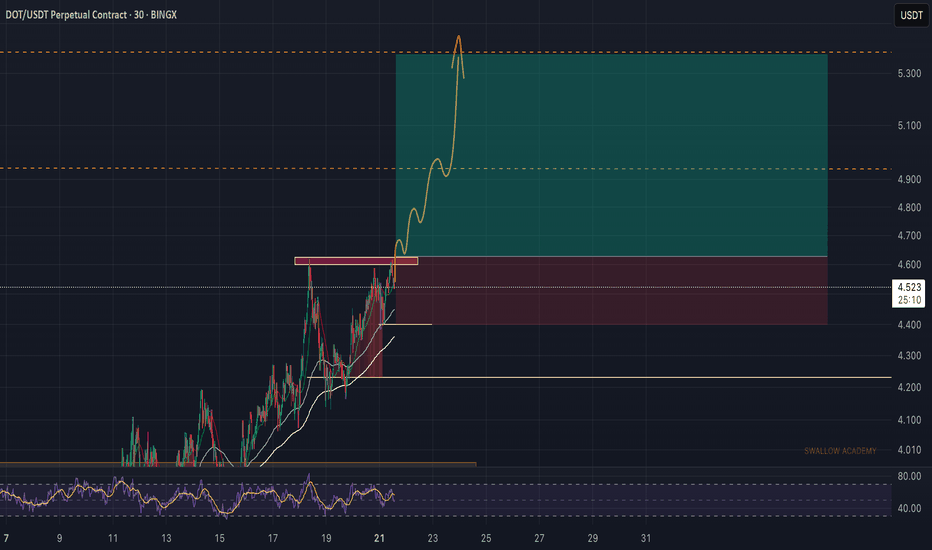
Nice Healthy 1:1 In DALThis is just a trade review of my DAL trade that I placed on Thursday. I walk through my thought process and what I saw that made me enter this trade. Thinking about this, at about 15 seconds in I froze up and that is because I realized that the reason I took the trade wasn't all that great but, I did have a great outcome.
Community ideas
Possible Second Entry Long In the SPYToo long to watch recap:
Bull Case:
Hit the top of the keltner
Bounce off the 20 ema
Second entry possible formation on todays candle
Inside bar formed today
Bear Case:
Strong selling
Bulls sold to break even but, they need a reason to come back
Modified MACD showing strong bear volume
Watch Me Make $600,642 Backtesting in 20 MinutesMastering Backtesting with TradingView's Replay Feature: Your Target Practice for Trading Success
In the world of trading, practice makes perfect, and one of the best ways to hone your skills is through backtesting. TradingView’s replay feature serves as an invaluable tool for traders looking to test strategies, refine their skills, and improve their overall performance. Think of it as target practice—a way to simulate real market conditions without the pressure of live trading. This article will delve into how to effectively use the replay feature, challenge yourself, and why practice is essential for every trader.
The Power of Backtesting
Backtesting is the process of testing a trading strategy on historical data to determine its viability. It’s like a dress rehearsal for traders, allowing you to assess how a strategy would have performed in different market conditions. With TradingView’s replay feature, you can step back in time and play out the price movements of any market you choose.
Using TradingView's Replay Feature
Setting Up the Replay Feature:
Open TradingView and select the asset you want to backtest.
On the chart, locate the “Replay” button in the toolbar (usually represented by a play icon).
Click the button and select the date from which you want to start your replay. You can drag the slider to move through the historical data at your own pace.
Simulating Live Trading Conditions:
As the replay plays out, you can apply your trading strategy just as you would in real-time. Take note of price action, support and resistance levels, and your entry and exit points.
Use this opportunity to test different indicators and strategies, adjusting parameters as you see fit.
Documenting Your Trades:
Keep a journal of your trades during the replay. Note what worked, what didn’t, and any adjustments you made. This reflection is crucial for developing your trading skills.
Target Practice: Challenging Yourself
To truly benefit from backtesting with the replay feature, consider implementing challenges that simulate the pressure of live trading. Here are some ways to push yourself:
1. Risk Management Challenges:
Decide on a specific risk amount for each trade—say $1,000. After reaching a target profit, like $15,000, challenge yourself to avoid losing a predetermined amount, such as $2,500.
This mimics real-life scenarios where maintaining profits can be just as challenging as making them. It forces you to practice discipline and stick to your risk management rules.
2. Trade Frequency Goals:
Set a target for the number of trades you want to execute during the replay. For example, aim to make 10 trades in a single session. This encourages you to be decisive and consistent with your strategy.
3. Time Constraints:
Limit yourself to a specific time frame when executing trades. For instance, challenge yourself to make all trades within a 30-minute window during the replay. This helps you practice decision-making under pressure, enhancing your ability to react quickly in real-market situations.
The Importance of Practice for Traders
As traders, we must remember that consistent practice is key to mastery. The replay feature allows you to simulate different scenarios without the risk of real money, giving you the freedom to learn from your mistakes. Here’s why practice is crucial:
Building Confidence:
The more you practice your strategy in a controlled environment, the more confident you’ll become in your abilities. This confidence translates into more decisive actions when trading live.
Identifying Strengths and Weaknesses:
Regularly backtesting enables you to pinpoint areas where your strategy excels and where it falters. This awareness allows you to adapt and evolve your approach over time.
Understanding Market Dynamics:
Each market behaves differently. By practicing across various assets and timeframes, you’ll develop a deeper understanding of market dynamics, helping you make better-informed decisions.
TradingView’s replay feature is a powerful tool for backtesting and honing your trading strategies. By treating this process as target practice, you can simulate real trading scenarios, test your strategies, and build the skills necessary for successful trading. Don’t shy away from challenging yourself with risk management goals, trade frequency targets, and time constraints. Remember, consistent practice is the pathway to mastery, and with the right tools and mindset, you can elevate your trading game to new heights. So dive into that replay feature, test your strategies, and watch your trading skills flourish!
Coca Cola - A Clear Trading Setup!Coca Cola ( NYSE:KO ) will provide a textbook setup soon:
Click chart above to see the detailed analysis👆🏻
Coca Cola is one of these "under the radar" stocks which is just trending higher and higher but nobody is really paying attention. However currently Coca Cola is retesting a resistance trendline of the governing rising channel pattern so a short term retracement is quite likely.
Levels to watch: $72, $65
Keep your long term vision,
Philip (BasicTrading)
Silver - Just Starting The Parabolic Rally!Trading update on Silver ( TVC:SILVER ):
Click chart above to see the detailed analysis👆🏻
Silver just perfectly completed the bullish break and retest and is about to reject the next horizontal resistance level. However everything is still significantly bullish and I honestly do expect a breakout soon. Following the previous cycle, Silver might rally another +35% from here.
Levels to watch: $34, $45
Keep your long term vision,
Philip (BasicTrading)
$MBLY : MASSIVE SHORT SQUEEZE INBOUND! 28% SHORT FLOAT!!! NASDAQ:MBLY MASSIVE SHORT SQUEEZE INBOUND! 28% SHORT FLOAT!!!
This company went from a Short Float of 17% in September to a Short Float of over 28% as of 15 October, as I talked about in the video from my X post. This name is about to have a much larger move than NASDAQ:SOUN , the stock that met my "High Five Setup" trading strategy on Friday, and they had an 18% move just today! I am more BULLISH on this company and their technology in FSD and Autonomous Vehicles than I was BULLISH on $SOUN. They also have a much better setup with a much larger move looming.
3 REASONS WHY YOU SHOULD NOT IGNORE THIS NAME:
1⃣ SHORT FLOAT OVER 28%
2⃣ "HIGH FIVE SETUP"
3⃣ TOP 3 IN AUTONOMOU VEHICLES/ FSD TECHNOLOGY WITH NASDAQ:GOOGL NASDAQ:TSLA
Comment below with your thoughts on this trade. Will it squeeze this week? What other stocks do you think can check all the boxes on my "High Five Setup" trading strategy?
Stay tuned for more!🔔
Like ❤️ Follow 🤳 Share 🔂
Not financial advice.
Plan for 29th October 2024Nifty future and banknifty future analysis and intraday plan in kannada.
Result analysis.
This video is for information/education purpose only. you are 100% responsible for any actions you take by reading/viewing this post.
please consult your financial advisor before taking any action.
----Vinaykumar hiremath, CMT
QUESTION 2SUBJECT: INVITATION TO A SUBSTANCE ABUSE SEMINAR
The Department of Health will be visiting the college to educate students about
substance abuse. This decision was influenced by the rapidly rising number of
substance abuse cases and the associated health and socio-economic burdens in South
Africa.
Remember, substance abuse is a contributing factor to health-related conditions such
as death, injuries, violence, HI/AIDS, tuberculosis and chronic diseases like
cardiovascular disease, cancer and mental disorders.
Being there will helps you learn as much as possible to avoid such a situation and
enable you to support a friend who is already in danger.
The speaker will address the following questions/topics and distribute pamphlets:
1. What is Addiction
2. The different types of addiction
3. How can you tell when someone is addicted
4. The effects of addiction
5. Organisations you can go to for help
If you are uncertain, put your holdings in a stable coinIf you have been holding for a long period of time and you're uncertain of where the markets will swing due to the elections, the safe thing to do is sell your holdings into a stable coin, then wait for the markets to stabilize before getting back in
Also, if you plan on riding the swings of the volatile market remember to put your system first and your emotions second. There's nothing more disheartening than making big losses during a bull run
Spotting EUR/USD Rebound Potential with Key Technicals!Today, we’re analysing the EUR/USD daily chart to see how key technical indicators align to impact trading decisions. Here’s what’s shaping up:
➡️ Current Support: We have an uptrend in place since April which is coinciding with a 78.6% retracement around the 1.0760/75 level (spanning June lows to September peaks). Adding strength to this support zone is the RSI divergence, signalling a potential corrective rebound.
➡️ Resistance Levels to Watch: For potential rebound targets, I start with Fibonacci retracements and key resistances:
• First Resistance: The 200-day moving average aligns with the 23.6% retracement at 1.0872.
• Second Resistance: The 38.2% retracement around 1.0950, showing multiple resistance touches, making it a significant challenge for further price movement.
Disclaimer:
The information posted on Trading View is for informative purposes and is not intended to constitute advice in any form, including but not limited to investment, accounting, tax, legal or regulatory advice. The information therefore has no regard to the specific investment objectives, financial situation or particular needs of any specific recipient. Opinions expressed are our current opinions as of the date appearing on Trading View only. All illustrations, forecasts or hypothetical data are for illustrative purposes only. The Society of Technical Analysts Ltd does not make representation that the information provided is appropriate for use in all jurisdictions or by all Investors or other potential Investors. Parties are therefore responsible for compliance with applicable local laws and regulations. The Society of Technical Analysts will not be held liable for any loss or damage resulting directly or indirectly from the use of any information on this site.
Bitcoin the Dominatrix: Leading the Crypto Charge💥👑 Bitcoin the Dominatrix: Leading the Crypto Charge 📈⚡️
Hello everyone! Bitcoin is asserting its dominance yet again! Following a period of geopolitical turmoil, Bitcoin has not only held steady but has begun pushing through resistance near $69,000, underscoring its strength and growing market share compared to altcoins.
Dominance Highlights:
Bitcoin vs. Altcoins: Bitcoin is up 1.43%, while Ethereum lags at 0.49%, and altcoins overall are down 0.9%. This trend reflects Bitcoin’s expanding “dominatrix” role in the crypto space, capturing a larger slice of the market with every price rally.
Safe Haven Status: Like gold, which is also hitting new highs, Bitcoin is behaving as a safe-haven asset, especially appealing in volatile times. Investors continue to favor it for stability, and its price action is suggesting a potential next target of $79,000, with further levels to monitor.
Future Price Potential: As we look toward 2024, Bitcoin’s path may lead it to all-time highs, with targets of $115,000 and even $160,000 on the horizon, as post-election market movements often fuel further growth.
Bitcoin’s strength is undeniable, but resistance levels should be watched closely for those trading this wave. With each step, Bitcoin solidifies its role as the leader in crypto.
One Love,
The FXPROFESSOR 💙
Charts:
Bitcoin Dominance 15m :
Bitcoin Dominance 4h:
Bitcoin:
Alts Total3:
BTCUSD - Above all important DAILY moving averagesGreetings friends!
Happy to see you after a few weeks hiatus. Here to do a quick 5 minute update on BTCUSD. Plain and simple, we're about to have a major break in structure as btc is coiling right below the major pivot from July 29th at ~$71,000 - if we break that high, the flood gates are likely to open and we could see a move up to ATH and if we break that, the next target is roughly $84,000. There's no price discovery above ATH so it's possible we make volatile moves and things can move quickly.
FYI - alts are currently lagging behind but they'll have their day - you may just need to wait a little longer.
More details in the video, obviously, but thanks for reading / watching and I hope you're having a great day!
ES SUnday night to 0800 EST price ReviewGoing over the price action from sunday night to 0800 monday. looking for clues as to what the market is telling us and how we'll lean and trade today. no setups no trades for us. only A++ trades while we get back into the flow of the market. Tampa Hurricanes are no joke not for the weak of mind. thats for sure.
SPY/QQQ Plan Your Trade For 10-28 : Top Resistance PatternToday's SPY Cycle Pattern is a Top Resistance pattern in Countertrend mode.
I believe this pattern will represent a moderate early topping price action in the SPY/QQQ - resolving slightly to the downside, then rolling into an upward price trend near the end of the day.
The reason I believe this to be the case is because of two factors.
A. The Countertrend mode suggests the top will actually be a moderate bottom in price (a pullback resolving as a base/bottom).
B. The continued bias for the markets is slightly upward, thus I believe the SPY/QQQ will attempt to reach new intermediate ATHs before we start to move into the pre-election downtrend.
Gold and Silver will struggle today as both appear to be consolidating in a FLAGGING formation.
Bitcoin is still consolidating in the Phase #3 sideways consolidation pattern of the Excess Phase Peak pattern.
Everything is playing out generally very well aligned to my research and cycle patterns. Last week I warned that market price would likely be very difficult in comparison to my SPY Cycle Patterns and that traders should begin to move to protect capital.
This week is the last week you have for any upside opportunities. You need to plan to protect capital (if you plan to) before the pre-election correction. I believe skilled traders will be able to move back into the strongest sectors at a 5.5 to 8.5%+ pullback just after the elections.
That is a smart move if you can pull it off.
Also, don't hold any Gold/Silver futures contracts through the 2-3+ days around the election day. Volatility will be EXTREME and unless you can take the lumps (margin calls), I don't advise anyone trying to trade metals on November 5-6. If you do, get in and get out QUICKLY.
Here we go...
Get some.
#trading #research #investing #tradingalgos #tradingsignals #cycles #fibonacci #elliotwave #modelingsystems #stocks #bitcoin #btcusd #cryptos #spy #es #nq #gold