AUDUSDAUD/USD Analysis: Bond Yields, Interest Rate Differential, Carry Trade, and Upcoming Fundamentals
1. 10-Year Bond Yields and Interest Rate Differential (May 25–30, 2025)
Australian 10-Year Bond Yield: ~4.42% (as of May 23, 2025) .
US 10-Year Treasury Yield: ~4.51% (as of May 21–23, 2025) .
Interest Rate Differential:4.51% (US)−4.42% (AUD)=+0.09%
so the IRD is 4.51% (US)−4.42% (AUD)=+0.09%
The US held a slight yield advantage, though the spread narrowed due to RBA rate cuts and weaker Australian data.
2. Policy Rate Differential and Carry Trade Advantage
RBA Cash Rate: 3.85% (cut by 25bps in May 2025) .
Fed Funds Rate: 4.25% (lower bound) .
Interest Rate Differential:4.25% (US)−3.85% (AUD)=+0.40%
The USD held a carry trade advantage, incentivizing investors to borrow AUD (lower rate) and invest in USD assets (higher rate).
3. AUD/USD Price Action (May 25–30)
AUD/USD fell to 0.6425, down 1% weekly, pressured by:
Weak Australian retail sales (-0.1% MoM) and building permits .
RBA’s dovish pivot, signaling potential further cuts amid trade tensions and slowing inflation .
Reinstated US tariffs under Trump’s policies, boosting USD safe-haven demand .
4. Key Fundamentals for June 1–7, 2025
Australia:
Retail Sales (May 30): Weakness could reinforce RBA easing expectations .
Building Approvals (June 3): Further declines may pressure AUD .
RBA Rhetoric: Dovish guidance likely to persist, with markets pricing rates to 3% by early 2026 .
US:
Nonfarm Payrolls (June 6): Strong data may revive Fed rate hike bets, widening the USD yield advantage.
Tariff Developments: Escalating US-China/EU trade tensions could strengthen USD .
Global Risks: Stagflation fears and bond market volatility may amplify AUD/USD swings .
Summary Table
Metric Australia (AUD) United States (USD)
10-Year Bond Yield ~4.42% ~4.51%
Policy Rate 3.85% 4.25%
Interest Rate Differential +0.40% (USD over AUD) —
Carry Trade Bias USD favored —
Conclusion
May 25–30: AUD/USD weakened due to RBA dovishness and USD strength, with a +0.40% rate differential supporting USD carry trades.
June 1–7: Focus on Australian retail sales, building approvals, and US jobs data. A soft AU data mix and resilient US economy may extend AUD/USD’s downtrend toward 0.6360
Monitor RBA/Fed rhetoric and trade policy shifts for volatility.
#audusd
Community ideas
NVDA Short time is Now using fractal geometry calculations This analysis suggests that NVDA may be entering a bearish phase based on recent price action. After an extended bullish run, the stock appears to be losing momentum, with signs of distribution emerging on the chart
. This could mark the beginning of a short-term or intermediate correction.
BTCUSD Price action analysis on HTFHi, I’m from Phoenix FX, and today I’ll be sharing my perspective on Bitcoin (BTC) price action based on the higher timeframes.
I’ll also give you my outlook on potential trade setups for today and tomorrow. Please remember that this is not financial advice—use this information as a guide only. If you find it helpful, don’t forget to like and share it with your like-minded communities.
Higher Timeframe Analysis
In my view, BTC tends to follow clear bullish and bearish cycle zones. Typically, we see a pump to new all-time highs (ATH), followed by the formation of resistance and a retracement down to a key support level. Our trading approach focuses on identifying those critical support and resistance levels, with some interim trades based on shorter-term analysis—occasionally even counter-trend, depending on the day’s market bias.
Over the past eight years, BTC has respected a major trend resistance line. The most recent ATH, around $112K, reconfirmed the relevance of this trendline. This makes it a valuable tool for projecting future ATH levels.
Looking ahead, I expect a move towards the $115K level in the coming weeks. This would likely act as a point of resistance, at which stage we might see a reversal and a drop back down to a key support zone.
Trade Setup
The chart I'm referencing highlights what I would consider the first premium buy zone, identified using a 4-hour Fair Value Gap (FVG).
The 50% level of this zone sits at $99,450. If this zone fails to hold, we may drop further to the secondary premium buy zone, which aligns with our higher timeframe (HTF) trend support and a weekly FVG. The 50% level of this deeper zone is around $89,150.
A potential long entry at $92,550, with a stop loss around $88,000, offers an excellent risk-to-reward (RR) ratio, targeting a move up to the $115K level.
Intraday Outlook
For today, I see bearish price action, with potential rejection around the $104,300–$105,000 range. Go short around the $104,750 to $105,000 zone
This could lead to a move down toward the lower key zones highlighted in the HTF analysis.
I recommend taking partial profits (TP) at every $1,000 increment and setting your stop loss to breakeven (BE) after hitting the first target.
Final Thoughts
Price action analysis is always subjective, so I’d love to hear your thoughts and ideas in the comments—each one, teach one.
Thanks for giving me some of your time.
From the Phoenix FX team, have a great weekend!
Market Update - 5/31/2025• Breadth is still flat/declining, lots of breakouts have failed and I got shaken out of all my positions so I'm flat
• Money is still flowing into safe assets like XLP and XLU, now also TLT, and the market is held up by large cap growth stocks, but the majority of the market is not going anywhere -> chop
• This is the worst environment for me so I decided to scale down and closed even some positions that were okay, go flat and take a break. Next week I'm on vacation, I don't expect anything exciting anyway
URANIUM Uranium Correlation with Dollar Index (DXY), 10-Year Bond Yield, and Interest Rates, and Its Industrial Use Cases
1. Correlation with Dollar Index (DXY), 10-Year Bond Yield, and Interest Rates
Uranium and Dollar Index (DXY):
Uranium, like many commodities priced in US dollars, generally exhibits an inverse correlation with the dollar. A stronger dollar (DXY↑) tends to make uranium more expensive for holders of other currencies, potentially reducing demand and putting downward pressure on prices. Conversely, a weaker dollar supports uranium prices by making it cheaper internationally.
Uranium and 10-Year Bond Yields / Interest Rates:
Uranium’s price correlation with bond yields and interest rates is less direct than financial assets but still relevant:
Rising interest rates and bond yields often signal tighter monetary policy, which can slow economic growth and reduce demand for industrial commodities, including uranium.
However, uranium’s demand is strongly tied to the nuclear energy sector and geopolitical factors, which can decouple it from traditional interest rate dynamics.
Inflation expectations and real yields influence uranium prices indirectly through investment demand and energy market dynamics.
2. Use Cases of Uranium in Industry
Nuclear Energy Generation:
The primary use of uranium is as fuel in nuclear power plants. Uranium-235 undergoes fission, releasing heat used to produce steam that drives turbines for electricity generation. Nuclear energy is a significant source of low-carbon power worldwide.
Commercial reactors typically use uranium enriched to about 3% uranium-235.
Uranium also powers naval vessels, including submarines and aircraft carriers.
Medical Applications:
Uranium isotopes are used to produce medical isotopes for cancer treatment (radiotherapy) and diagnostic imaging. Depleted uranium (DU) serves as radiation shielding in medical equipment and teletherapy units.
Military Uses:
Depleted uranium is used in armor plating and armor-piercing ammunition due to its high density and hardness. It also serves as counterweights in military aircraft.
Industrial Applications:
Uranium is used in radiation shielding for transporting radioactive materials and in scientific research. It has historical uses in ceramics and glass coloring, though these are now largely obsolete.
Agriculture:
Uranium compounds have been used in soil sterilization and as inert components in fertilizers, though these uses are limited and carefully controlled due to radioactivity.
Scientific Research and Space Exploration:
Uranium isotopes are used in geological dating and as fuel for deep-space missions.
#METAL #GOLD #COPPER #SILVER # ALUMINUM
ALUMINUM ALIUSDCorrelation Between Aluminum, Dollar Index (DXY), Gold, and 10-Year Bond Yields
1. Aluminum and Dollar Index (DXY)
Inverse Correlation: Aluminum prices generally move inversely to the US dollar. A stronger dollar (DXY↑) makes aluminums more expensive in other currencies, reducing demand and putting downward pressure on prices. Conversely, a weaker dollar supports aluminum prices by making it cheaper globally.
This relationship is common among dollar-denominated commodities, including aluminum, due to currency translation effects on international buyers.
2. Aluminum and Gold Correlation
Moderate Positive Correlation: Both aluminum and gold can reflect broader macroeconomic trends such as inflation and industrial demand.
Gold is primarily a safe-haven and inflation hedge, while aluminum is an industrial metal sensitive to economic growth and manufacturing activity.
During periods of rising inflation or stagflation, gold tends to rally as a store of value, while aluminum may also rise due to increased industrial demand or supply constraints.
However, in risk-off scenarios, gold often outperforms aluminum as investors seek safety.
3. Aluminum and 10-Year Bond Yields
Inverse to Mixed Correlation: Rising 10-year US Treasury yields often indicate higher interest rates and stronger economic growth expectations, which can support industrial metals like aluminum through increased demand.
However, higher yields also increase borrowing costs and can slow economic activity, potentially dampening aluminum demand.
The relationship can vary depending on whether yields rise due to growth optimism or inflation fears.
Generally, aluminum prices may fall when yields rise sharply due to monetary tightening, reflecting concerns about slower growth.
4. Gold and 10-Year Bond Yields
Inverse Relationship (Real Yields Matter Most): Gold prices tend to move inversely to real 10-year Treasury yields (nominal yield minus inflation).
When real yields fall (or turn negative), gold becomes more attractive as a non-yielding asset, pushing prices higher.
Rising nominal yields can pressure gold in the short term, but if inflation expectations rise faster, gold can still rally.
Recent trends show gold sometimes rising alongside bond yields due to stagflation fears and geopolitical risks.
5. Dollar Index (DXY) and 10-Year Bond Yields
Generally Positive Correlation: Higher US Treasury yields attract foreign capital, strengthening the dollar.
However, during risk-off periods, the dollar can strengthen even as yields fall, as investors seek safe-haven assets.
Summary Table
Asset Pair Typical Correlation Key Drivers / Notes
Aluminum & DXY Inverse Dollar strength affects commodity affordability
Aluminum & Gold Moderate Positive Inflation, stagflation, industrial demand
Aluminum & 10-Year Yields Mixed/Inverse Growth expectations vs. borrowing costs
Gold & 10-Year Yields Inverse (real yields focus) Real interest rates and inflation expectations
DXY & 10-Year Yields Generally Positive Capital flows, Fed policy expectations
Conclusion
Aluminum prices are sensitive to the US dollar strength and economic growth expectations reflected in bond yields, with an inverse relationship to DXY and a mixed relationship to yields.
Gold is more influenced by real interest rates and inflation expectations, often moving inversely to bond yields and the dollar.
The interplay between these assets reflects broader macroeconomic conditions such as inflation, growth, and monetary policy shifts, making them important indicators for investors tracking commodity and currency markets.
#ALUMINUM #GOLD #DOLLAR #BONDYIELD #SILVER
COPPER XCUUSDCopper Price Action, Dollar Correlation, Bond Yields, and Global Reserves
1. Copper Price Action and Dollar Index (DXY) Correlation
Inverse Relationship: Copper prices typically move inversely to the US Dollar Index (DXY). A weaker dollar (DXY↓) makes copper cheaper for foreign buyers, boosting demand and prices. For example, in early 2025, a DXY drop from 109 to 103.2 (May 2025) lifted copper prices from $4.72 to $4.82 per pound .
Mechanism: Dollar-denominated commodities like copper become more affordable in other currencies when the USD weakens, driving global demand .
Exception: Geopolitical risks or supply constraints (e.g., Chilean production disruptions) can decouple this relationship temporarily .
2. Copper and Bond Yields
Real Yields Drive Prices: Copper’s performance is influenced by real interest rates (nominal bond yields minus inflation). Lower real yields reduce the opportunity cost of holding non-yielding commodities, supporting copper prices.
Fed Policy Impact: Rising bond yields (e.g., 10-year Treasury yields at 4.54% in May 2025) pressure copper if driven by hawkish Fed policies, but inflation expectations can sustain demand for copper as a hedge .
Recent Example: Despite elevated nominal yields in 2025, copper rallied due to supply deficits and inflation hedging, mimicking gold’s behavior in stagflationary environments .
3. Country with the Highest Copper Deposits
Chile dominates global copper reserves with 170 million metric tons (27% of the world’s total), home to the largest mines like Escondida and Collahuasi .
Other Key Producers:
Australia: 88 million MT reserves.
Peru: 81 million MT reserves.
Russia and Mexico: 62 million MT and 53 million MT, respectively .
Summary Table
Factor Impact on Copper Prices Key Data Points
DXY ↑ ↓ (stronger USD reduces global demand) DXY 103.2 → Copper $4.82/lb (May 2025)
Real Yields ↓ ↑ (lower opportunity cost for holding copper) Fed rate cuts in 2025 supported copper
Top Copper Reserves Chile (170M MT), Australia (88M MT), Peru (81M MT) Chile’s Escondida: largest mine globally
Copper Use Cases in Real Life
Copper is a highly versatile metal with numerous applications across various industries due to its excellent electrical and thermal conductivity, corrosion resistance, malleability, and antimicrobial properties. Here are the main real-life uses of copper:
1. Building Construction
Nearly half of all copper supply goes into the construction sector.
Used extensively in electrical wiring, plumbing, roofing, HVAC systems, refrigeration lines, and water pipes.
One average home contains about 439 pounds of copper, used in wiring, tubing, and appliances.
2. Electronics and Electrification
Copper’s superb electrical conductivity makes it essential for electrical wiring and printed circuit boards in consumer electronics like smartphones, laptops, TVs, and power tools.
Vital for data centers, supercomputers, AI platforms, and cryptocurrency mining hardware.
Increasingly important in battery energy storage systems, which are growing rapidly.
3. Transportation and Electric Vehicles (EVs)
Used in manufacturing ships, trains, airplanes, and automobiles.
Found in motors, brakes, connectors, radiators, bearings, and wiring in vehicles.
EVs require two to four times more copper than conventional vehicles, including for charging stations.
Copper demand from green energy and EV sectors is expected to grow five-fold by 2030.
4. Industrial Machinery and Equipment
Used in electrical motors, heat exchangers, valves, condensers, and piping for petrochemical, desalination, and offshore oil and gas platforms.
Corrosion-resistant copper alloys are critical for undersea installations and clean energy technologies like wind turbines and solar panels.
5. Medical Applications
Copper’s antimicrobial properties are used in medical devices, surgical tools, orthopedic implants, and radiotherapy equipment to reduce infection risks.
6. Telecommunications
Copper cables are used in telephone lines, coaxial cables, and some fiber-optic systems to transmit voice, data, and video signals.
7. Household and Kitchen Appliances
Copper is used in sinks, pots, pans, electrical fittings, and lighting fixtures due to its durability and heat conductivity.
8. Marine and Shipbuilding
Copper alloys resist seawater corrosion and biofouling, making them ideal for ship components like bolts, rivets, propellers, and condenser pipes.
Summary
Copper’s unique combination of electrical and thermal conductivity, corrosion resistance, and malleability makes it indispensable in:
Construction (wiring, plumbing)
Electronics and data infrastructure
Transportation, especially EVs
Industrial machinery and clean energy
Medical devices
Telecommunications
Household appliances
Marine applications
Copper is often called “Dr. Copper” for its role as an economic indicator due to its widespread industrial use.
Conclusion
Copper’s price action is shaped by dollar strength, real interest rates, and supply-demand dynamics. While a weaker dollar and lower real yields typically boost copper, structural factors like Chile’s supply dominance (27% of global production) and green energy demand underpin its long-term bullish case. Traders should monitor DXY trends, Fed policy shifts, and geopolitical risks in key mining regions for directional cues.
#METAL #COPPER # GOLD #SILVER #ALUMINIUM
GOLD Gold Correlation with DXY, 10-Year Bond Yields, Bond Prices, Interest Rate Differentials, and Carry Trade Advantage
1. Gold vs. DXY (Dollar Index)
Typical Inverse Relationship: Gold prices generally move inversely to the US dollar (DXY). A weaker dollar (DXY↓) makes gold cheaper for foreign buyers, boosting demand, while a stronger dollar (DXY↑) pressures gold prices .
Exception in Crises: During extreme market stress (e.g., 2008 financial crisis), gold and the dollar may rise together as both act as safe havens .
Recent Context (2025): The inverse correlation weakened, with gold showing resilience despite dollar strength due to geopolitical risks and central bank buying .
2. Gold vs. 10-Year Bond Yields
Real Yields Drive Gold: Gold has a strong inverse relationship with real interest rates (nominal yield - inflation). Lower real yields reduce the opportunity cost of holding non-yielding gold, boosting prices .
Example: From 2008–2012 and 2019–2021, gold surged as real yields turned negative amid quantitative easing .
Recent Divergence: In 2022–2023, gold held steady despite a 270bps rise in 10-year real yields, driven by central bank accumulation and inflation hedging .
3. Gold vs. Bond Prices
Indirect Link via Yields: Bond prices and yields are inversely related. Rising bond prices (yields↓) often correlate with gold strength, while falling prices (yields↑) pressure gold .
Safe-Haven Overlap: Both gold and Treasuries are considered safe assets, but their correlation is weaker during stagflation (gold outperforms bonds) .
4. Interest Rate Differentials and Carry Trade Impact
Carry Trade Mechanics: Investors borrow low-yield currencies (e.g., JPY) to invest in high-yield currencies (e.g., USD), boosting demand for the latter and strengthening the DXY .
Example: A 4.25% spread between AUD (4.35%) and JPY (0.10%) incentivizes AUD/JPY carry trades, affecting currency valuations and gold indirectly .
Impact on Gold: A stronger dollar (from carry trades) typically pressures gold, but narrowing rate differentials (e.g., Fed cuts) can reverse this dynamic .
Key Exceptions and Recent Trends
Policy Divergence:
The Fed’s aggressive 2022–2023 rate hikes (10-year yields↑) did not suppress gold, highlighting the role of geopolitical demand and de-dollarization trends .
Real Rates vs. Nominal Yields:
Gold’s 2025 rally to $3,500+ occurred despite elevated nominal yields, as negative real rates (-1.2% after inflation) supported demand .
Central Bank Influence:
Record central bank gold purchases (1,081 tonnes in 2024) decoupled gold from traditional drivers like the DXY .
Summary Table
Factor Relationship with Gold Key Drivers & Exceptions
DXY ↑ Typically ↓ (inverse) Exceptions: Risk-off events (both rise)
10-Year Yields ↑ ↓ (if real yields rise) Real yields matter more than nominal rates
Bond Prices ↑ ↑ (yields↓, gold吸引力↑) Weakens during stagflation
Widening Rate Spreads Indirectly ↓ (strengthens DXY) Carry trades amplify USD demand
Conclusion
Gold’s price dynamics are shaped by a complex interplay of real yields, DXY movements, and carry trade flows, with notable deviations during crises or structural shifts (e.g., central bank buying). While the inverse correlation with the dollar and real yields remains foundational, recent years underscore gold’s evolving role as a geopolitical and institutional asset. Traders should prioritize monitoring real interest rates, central bank policies, and risk sentiment to navigate gold’s trajectory effectively.
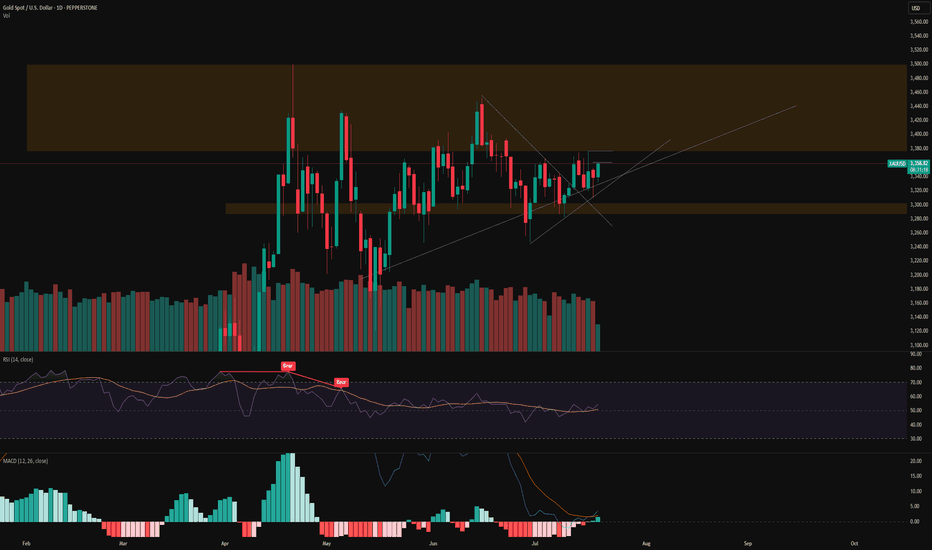
forecast 02/06/2025XAUUSD Forecast | VSA & Trend Line Analysis | Gold Price Prediction
In this video, I share my detailed forecast for XAUUSD (Gold vs. USD) using Volume Spread Analysis (VSA) and trend line strategies. Watch as I break down the market structure, identify key levels, and explain the logic behind potential moves in gold.
bitcoinBitcoin (BTC) Correlation with DXY, Bond Yields, and Interest Rates
1. Bitcoin vs. Dollar Index (DXY)
Inverse Correlation: Bitcoin and DXY typically move in opposite directions. A stronger dollar (DXY↑) reduces demand for risk assets like BTC, while a weaker dollar (DXY↓) boosts BTC as a hedge against fiat depreciation.
DXY↑: Investors flock to USD safety, pressuring BTC.
DXY↓: Capital rotates into BTC as a risk-on asset or inflation hedge.
2. Bitcoin vs. Bond Yields
Evolving Relationship:
Historical Inverse Link: Rising 10-year Treasury yields often pressured BTC (e.g., 2022 Fed hikes).
Recent Decoupling: In 2025, BTC and 10-year yields hit a record-low correlation (-0.8), signaling BTC’s independence from traditional bonds.
Key Drivers:
Inflation Hedge: BTC gains appeal as bonds struggle with rising yields (e.g., 30-year yields at 5.07% in May 2025).
Portfolio Diversification: Investors increasingly treat BTC as “digital gold,” reducing bond allocations.
3. Bitcoin vs. Interest Rates
Fed Policy Impact:
Rate Hikes: Strengthen USD (DXY↑) and bond yields, pressuring BTC
Rate Cuts: Weaken USD and lower yields, boosting BTC’s appeal
Real Yields Matter: BTC thrives when real yields (nominal yield - inflation) fall, as seen during stagflationary environments.
Summary Table
Correlation Relationship Key Drivers
BTC ⇄ DXY Inverse (DXY↑ → BTC↓) Risk sentiment, USD strength as safe haven
BTC ⇄ Bond Yields Increasingly negative (2025) Inflation hedging, portfolio diversification
BTC ⇄ Interest Rates Indirect via DXY and yields Fed policy, real yield dynamics
Critical Trends in 2025
BTC-DXY Decoupling: BTC’s rally to $105,268 and hit 111k amid DXY volatility shows growing independence.
Bond Market Shift: Investors rotate from Treasuries to BTC amid fiscal deficits and inflation.
Fed Policy Pivot: Expected rate cuts could weaken DXY and bolster BTC’s bullish case.
Conclusion
BTC-Yields: Negative correlation strengthens BTC’s role as a bond alternative in inflationary regimes.
Macro Strategy: Use DXY and bond yields as leading indicators for BTC’s risk-on/risk-off cycles.
Trade Implications:
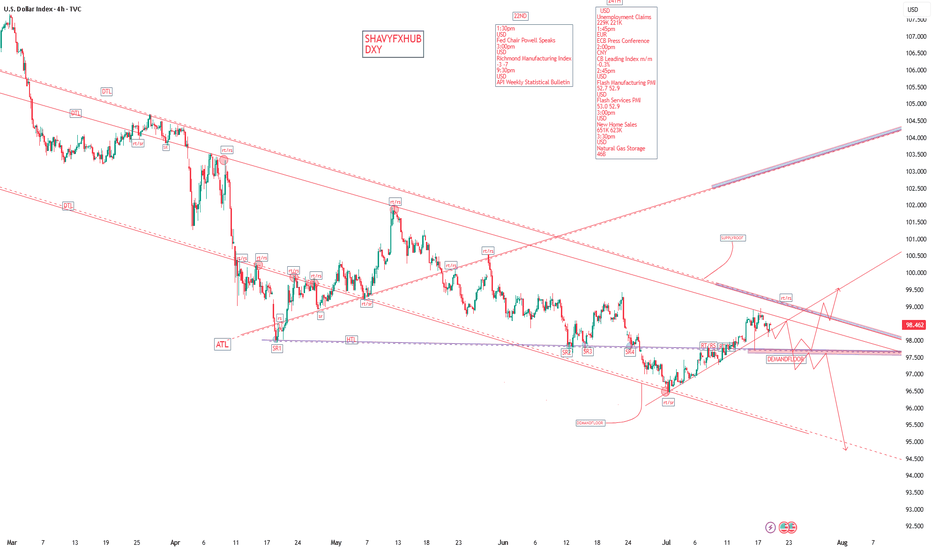
A DXY drop below 98.4 could signal BTC bullish momentum.
Rising bond yields may temporarily pressure BTC but reinforce its long-term hedge appeal.
#btc #bitcoin #crypto
BITCOIN Bitcoin (BTC) Correlation with DXY, Bond Yields, and Interest Rates
1. Bitcoin vs. Dollar Index (DXY)
Inverse Correlation: Bitcoin and DXY typically move in opposite directions. A stronger dollar (DXY↑) reduces demand for risk assets like BTC, while a weaker dollar (DXY↓) boosts BTC as a hedge against fiat depreciation.
DXY↑: Investors flock to USD safety, pressuring BTC.
DXY↓: Capital rotates into BTC as a risk-on asset or inflation hedge.
2. Bitcoin vs. Bond Yields
Evolving Relationship:
Historical Inverse Link: Rising 10-year Treasury yields often pressured BTC (e.g., 2022 Fed hikes).
Recent Decoupling: In 2025, BTC and 10-year yields hit a record-low correlation (-0.8), signaling BTC’s independence from traditional bonds.
Key Drivers:
Inflation Hedge: BTC gains appeal as bonds struggle with rising yields (e.g., 30-year yields at 5.07% in May 2025).
Portfolio Diversification: Investors increasingly treat BTC as “digital gold,” reducing bond allocations.
3. Bitcoin vs. Interest Rates
Fed Policy Impact:
Rate Hikes: Strengthen USD (DXY↑) and bond yields, pressuring BTC
Rate Cuts: Weaken USD and lower yields, boosting BTC’s appeal
Real Yields Matter: BTC thrives when real yields (nominal yield - inflation) fall, as seen during stagflationary environments.
Summary Table
Correlation Relationship Key Drivers
BTC ⇄ DXY Inverse (DXY↑ → BTC↓) Risk sentiment, USD strength as safe haven
BTC ⇄ Bond Yields Increasingly negative (2025) Inflation hedging, portfolio diversification
BTC ⇄ Interest Rates Indirect via DXY and yields Fed policy, real yield dynamics
Critical Trends in 2025
BTC-DXY Decoupling: BTC’s rally to $105,268 and hit 111k amid DXY volatility shows growing independence.
Bond Market Shift: Investors rotate from Treasuries to BTC amid fiscal deficits and inflation.
Fed Policy Pivot: Expected rate cuts could weaken DXY and bolster BTC’s bullish case.
Conclusion
BTC-Yields: Negative correlation strengthens BTC’s role as a bond alternative in inflationary regimes.
Macro Strategy: Use DXY and bond yields as leading indicators for BTC’s risk-on/risk-off cycles.
Trade Implications:
A DXY drop below 98.4 could signal BTC bullish momentum.
Rising bond yields may temporarily pressure BTC but reinforce its long-term hedge appeal.
#btc #bitcoin #crypto