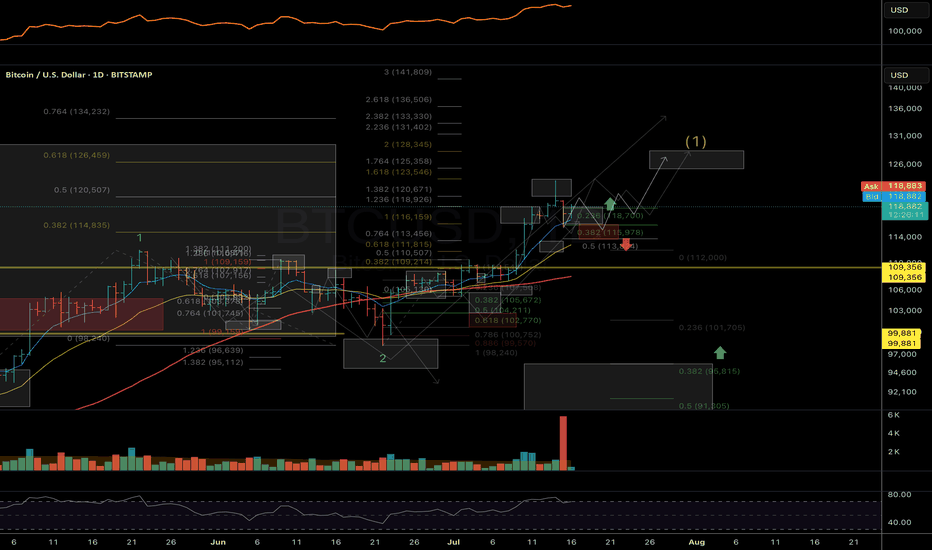
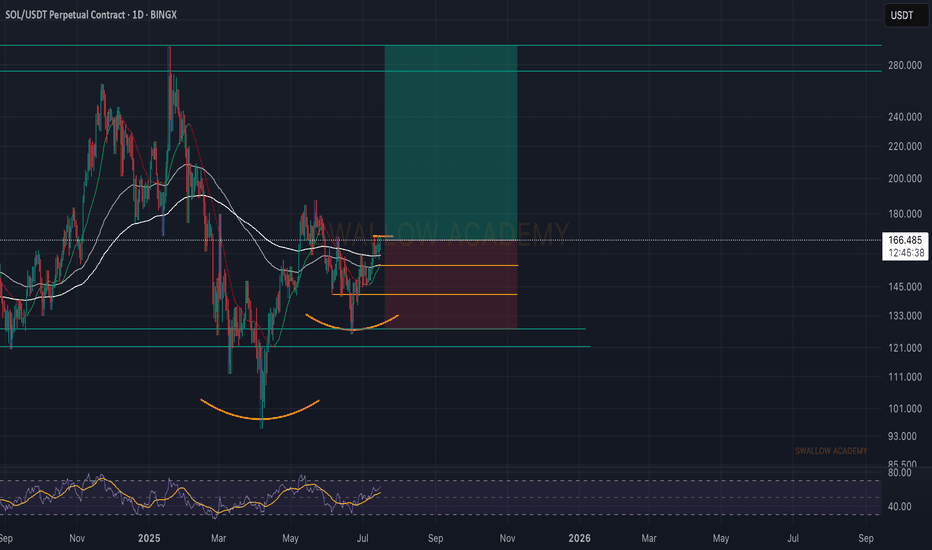
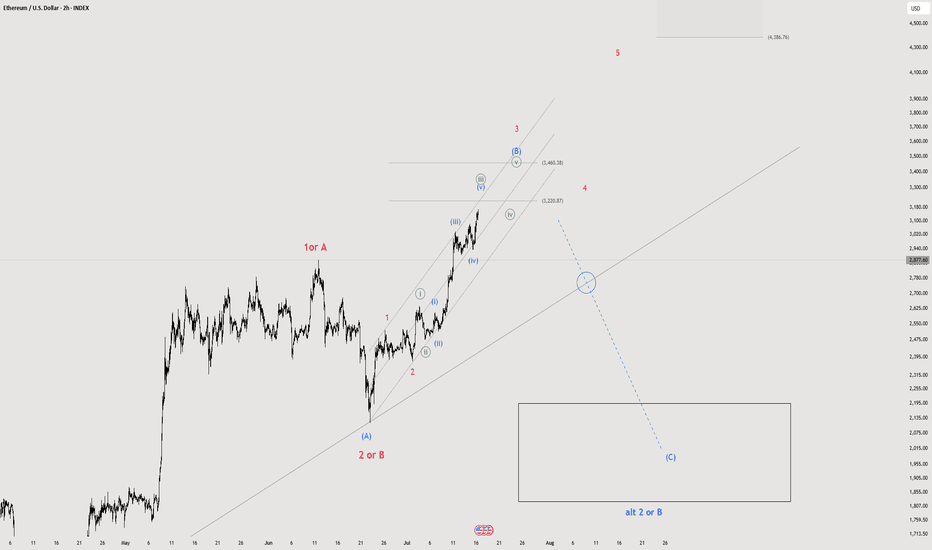
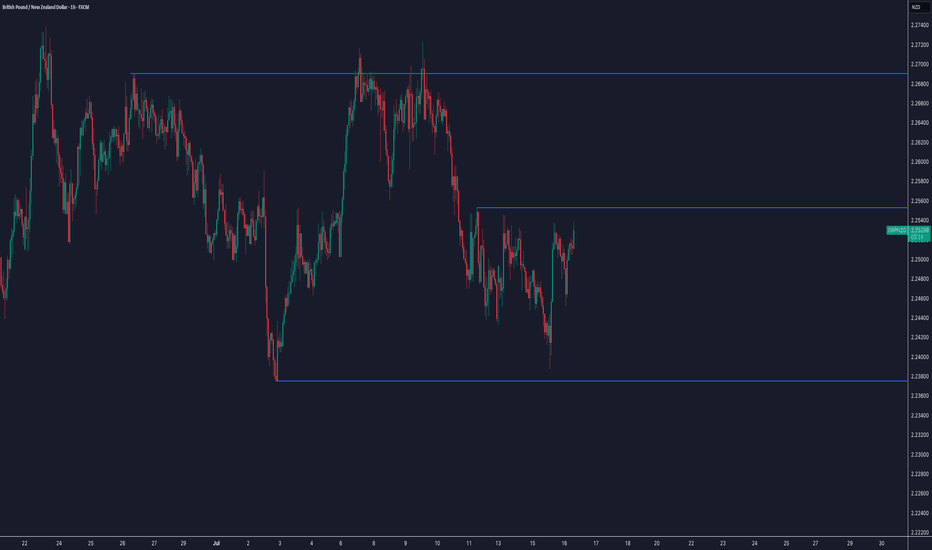
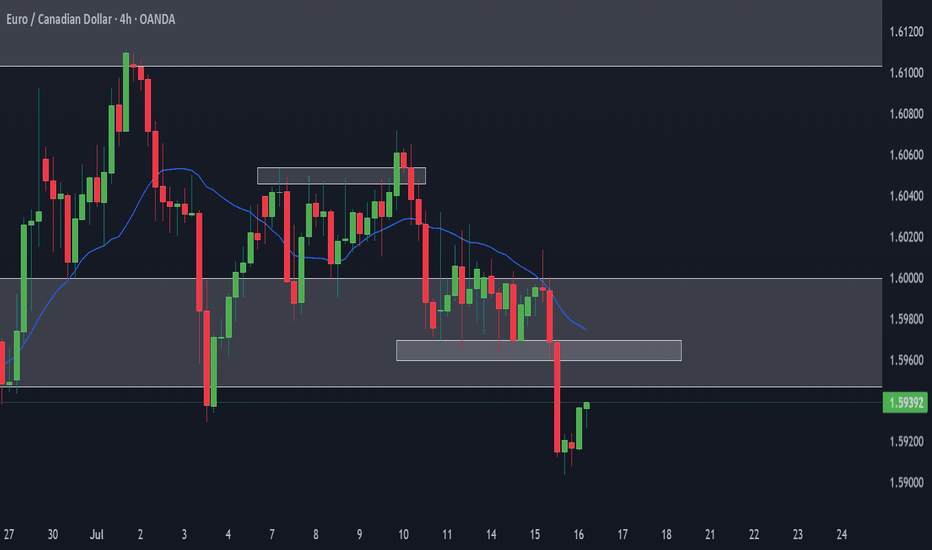
[UPD] BTC / ETH / XRP / SOL / HYPE and other alt and mem-coins A new video update with insights on the intermediate trend structure with key support and resistance zones to keep on radar in the coming sessions
Coins discussed in the video: CRYPTOCAP:BTC / CRYPTOCAP:ETH / CRYPTOCAP:XRP / GETTEX:HYPE / CRYPTOCAP:SOL / CRYPTOCAP:LINK / CRYPTOCAP:SUI / $BRETT / SEED_DONKEYDAN_MARKET_CAP:FLOKI and others
Hope this is helpful in guiding you through the crypto market. Thank you for your attention and I wish you successful trading decisions!
If you’d like to hear my take on any other coin you’re tracking - feel free to ask in the comments (just don’t forget to boost the idea first 😉).
Community ideas
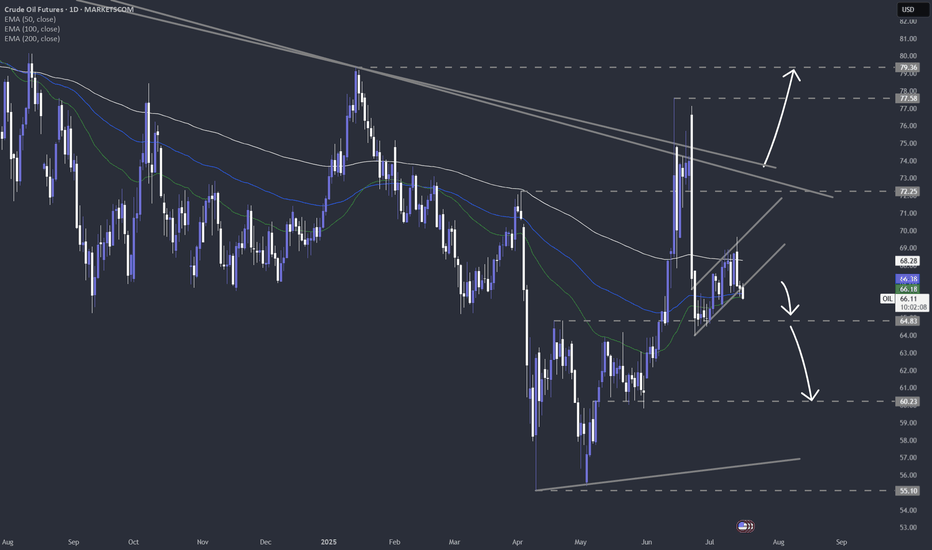
Could we see the WTI oil bears getting pleased any time soon?The technical picture of MARKETSCOM:OIL is showing a possible bearish flag formation, which may lead WTI oil to some lower areas. Is that the case? Let's dig in.
NYMEX:CL1!
Let us know what you think in the comments below.
Thank you.
75.2% of retail investor accounts lose money when trading CFDs with this provider. You should consider whether you understand how CFDs work and whether you can afford to take the high risk of losing your money. Past performance is not necessarily indicative of future results. The value of investments may fall as well as rise and the investor may not get back the amount initially invested. This content is not intended for nor applicable to residents of the UK. Cryptocurrency CFDs and spread bets are restricted in the UK for all retail clients.
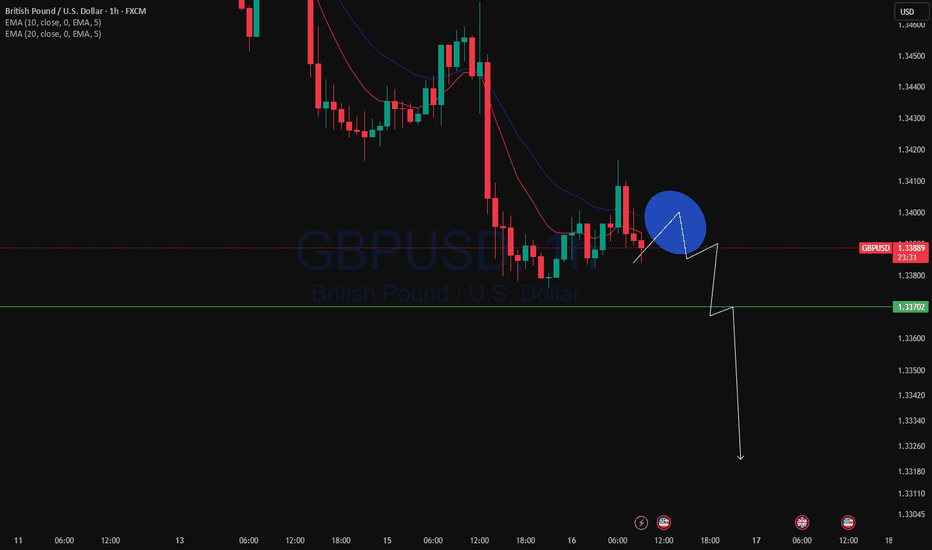
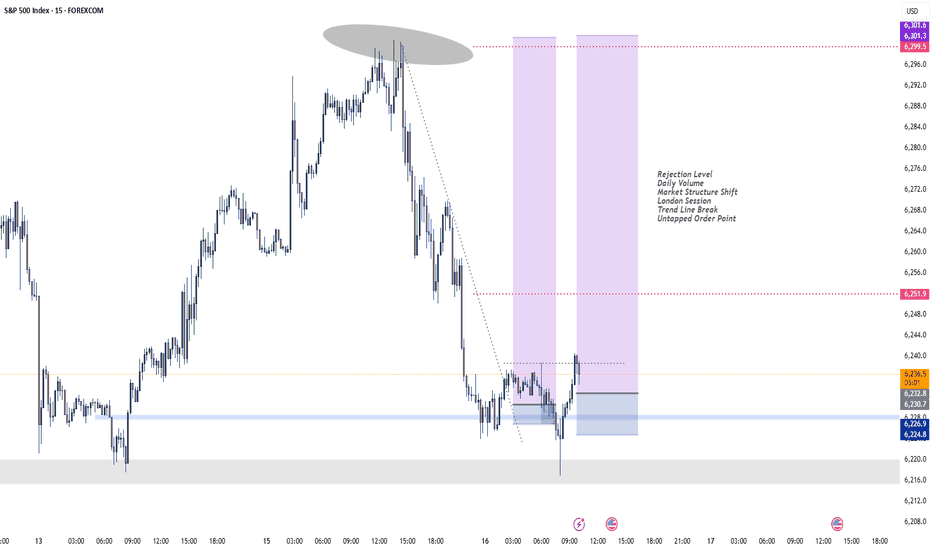
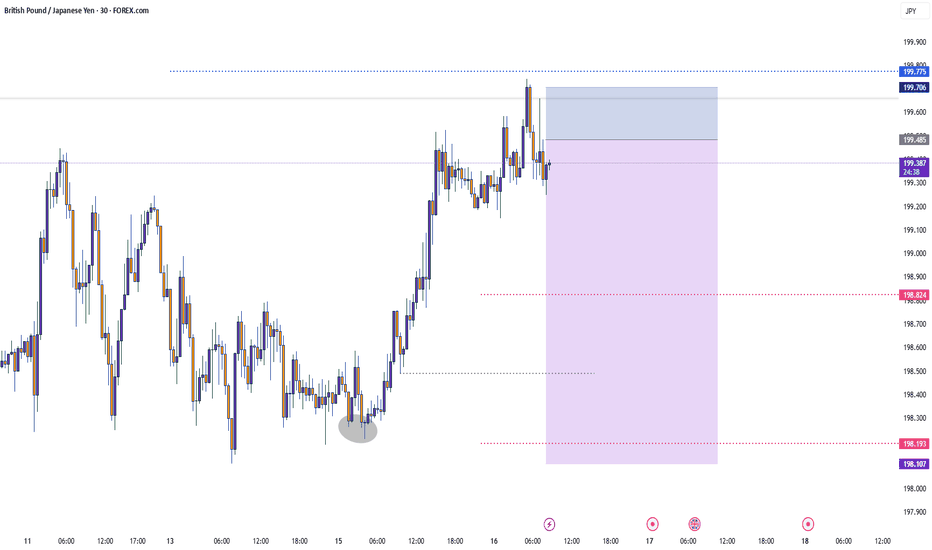
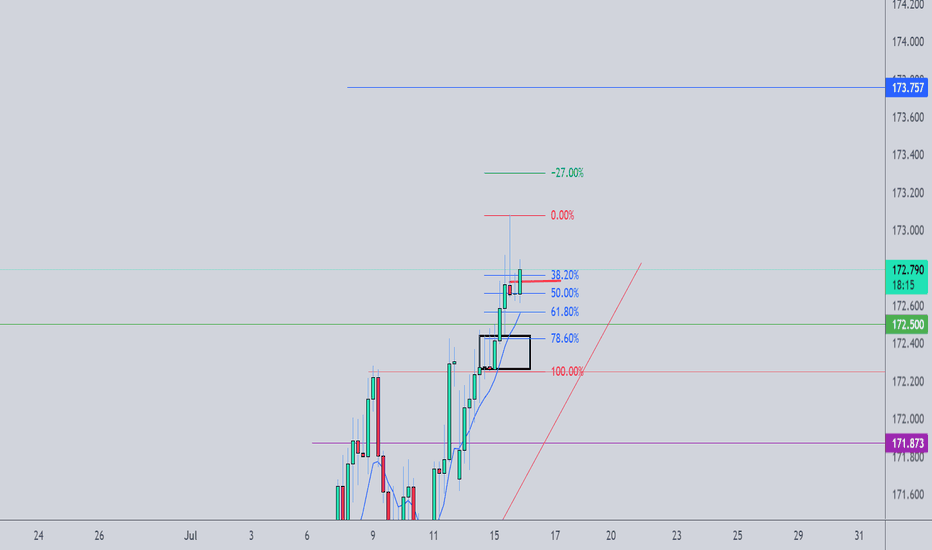
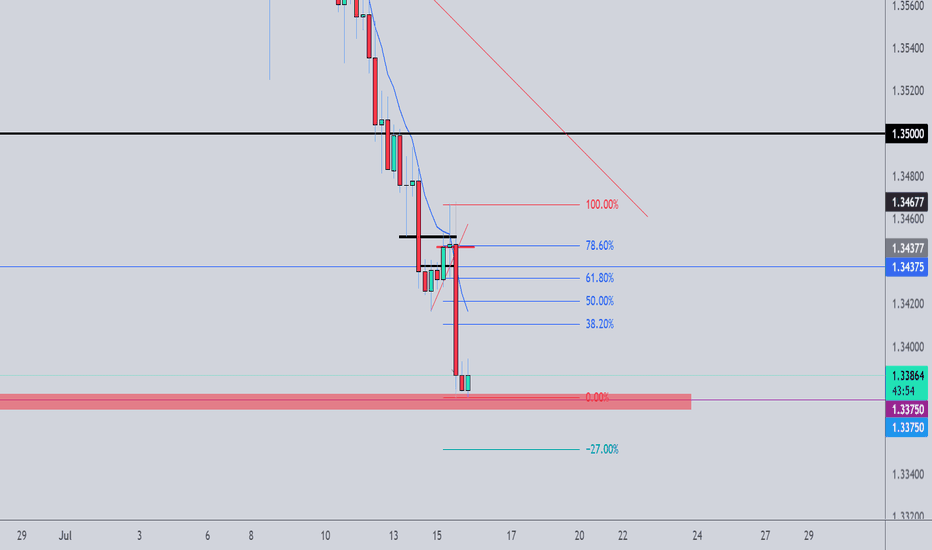
GBPUSD and EURUSD Analysis todayHello traders, this is a complete multiple timeframe analysis of this pair. We see could find significant trading opportunities as per analysis upon price action confirmation we may take this trade. Smash the like button if you find value in this analysis and drop a comment if you have any questions or let me know which pair to cover in my next analysis.
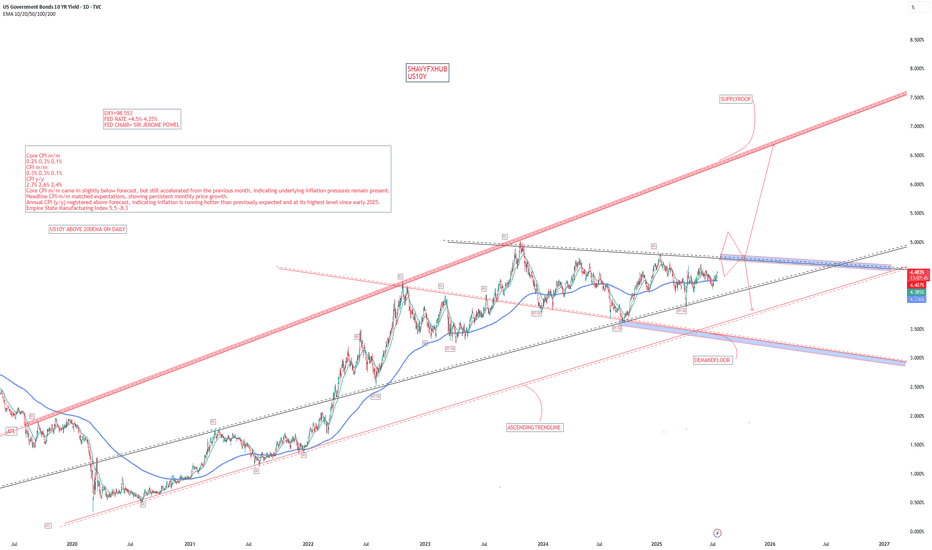
US10Y UNITED STATES GOVERNMENT 10 YEAR BOND YIELD .US 10-Year Treasury Yield Reaction to July 15, 2025 Economic Data
Key Economic Data (July 15, 2025)
Indicator Actual Forecast Previous
Core CPI m/m 0.2% 0.3% 0.1%
CPI m/m 0.3% 0.3% 0.1%
CPI y/y 2.7% 2.6% 2.4%
Empire State Mfg Index 5.5 — -8.3
Market Reaction: US 10-Year Treasury Yield
Yield Movement:
The US 10-year Treasury yield rose sharply to 4.495% on July 15, 2025, up from 4.43% the previous market day—a gain of 7 basis points.
Immediate Cause:
This jump occurred as the inflation data, while showing softer core CPI than forecast, delivered a higher-than-expected annual CPI (2.7% y/y vs. 2.6% forecast) and robust CPI m/m. Additionally, the Empire State Manufacturing Index rebounded strongly, further supporting concerns over persistent price pressures and economic momentum.
Market Interpretation:
Investors increasingly scaled back expectations for near-term Federal Reserve rate cuts, causing a sell-off in Treasuries and pushing yields higher.
Persistent inflation—especially with annual CPI running above consensus—suggests the Fed may need to keep rates higher for longer, amplifying bond market volatility.
The improved manufacturing sentiment also fueled the belief that the US economy remains resilient, reinforcing the hawkish read on interest rates.
Summary Table: US 10-Year Yield
Date Yield Daily Change
July 15, 2025 4.495% +0.07%
July 14, 2025 4.43% —
Key Takeaways
US10Y jumped by 7 bps to its highest level in five weeks after the mixed inflation report and strong manufacturing data.
Investor sentiment shifted toward fewer and later Fed rate cuts as inflation proved more stubborn than forecast.
The yield reaction underscores ongoing sensitivity to inflation surprises and economic resilience in 2025.
The bond market’s move highlights that even minor upsets to the inflation outlook can quickly ripple through rates, especially when compounded by positive growth signals.
#US10Y
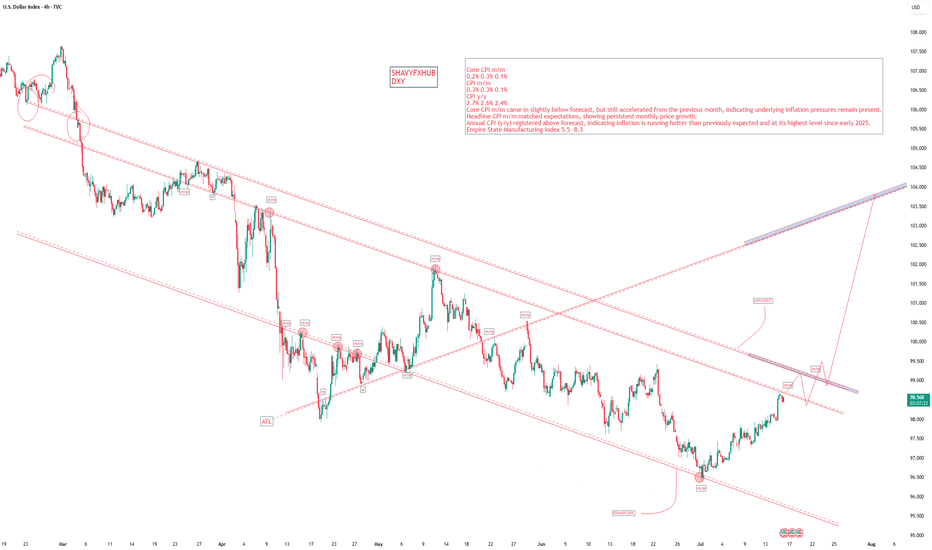
DOLLAR INDEX U.S. Economic Data Release on the July 15th
Key Inflation Indicators
Indicator Current Forecast Previous
Core CPI m/m
0.2% 0.3% 0.1%
CPI m/m
0.3% 0.3% 0.1%
CPI y/y
2.7% 2.6% 2.4%
Core CPI m/m came in slightly below forecast, but still accelerated from the previous month, indicating underlying inflation pressures remain present.
Headline CPI m/m matched expectations, showing persistent monthly price growth.
Annual CPI (y/y) registered above forecast, indicating inflation is running hotter than previously expected and at its highest level since early 2025.
Empire State Manufacturing Index
Indicator Current Previous
Empire State Manufacturing Index 5.5 -8.3
The sharp rebound from negative territory signals a marked improvement in manufacturing sentiment in the New York region, pointing to possible resilience in U.S. industrial activity.
Market Implications
US Dollar (USD):
Inflation coming in at or above forecast (annual and headline monthly), along with better-than-expected manufacturing data, has support the USD in the short term. Stronger inflation weakens the case for near-term Federal Reserve rate cuts.
Treasury Yields:
Yields edged higher as bond traders weigh persistent inflation against a resilient economy, with less urgency for monetary easing.
Equity Markets:
Slightly hotter inflation and improved factory activity brings mixed reactions. Investors could become cautious over reduced chances of Fed rate cuts, but healthy manufacturing data may fuel selective equity support.
Commodities:
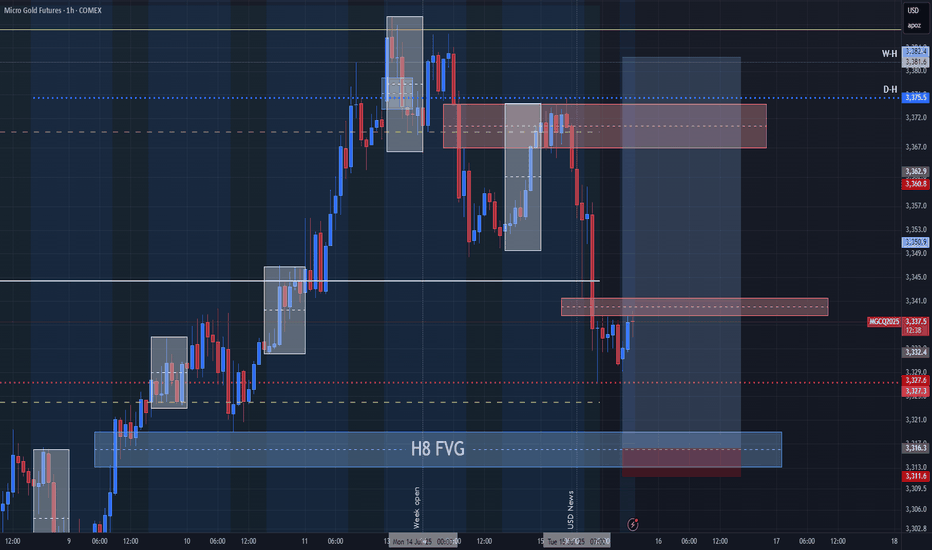
Gold and other non-yielding assets faced modest headwinds from a stronger USD and rising yields.
In summary:
U.S. inflation data for June shows headline and annual CPI above forecast, and core inflation still rising, suggesting persistent price pressures. The Empire State Manufacturing Index rebounded sharply, signaling improved business sentiment. These surprises likely reinforce expectations for a cautious Federal Reserve, with possible USD gains and ripple effects across equity, bond, and commodity markets.
#DXY #DOLLAR
YOU MUST BE A CONFLUENCE FINDER, let me explain.......All the information you need to find a high probability trade are in front of you on the charts so build your trading decisions on 'the facts' of the chart NOT what you think or what you want to happen or even what you heard will happen. If you have enough facts telling you to trade in a certain direction and therefore enough confluence to take a trade, then this is how you will gain consistency in you trading and build confidence. Check out my trade idea!!
www.tradingview.com
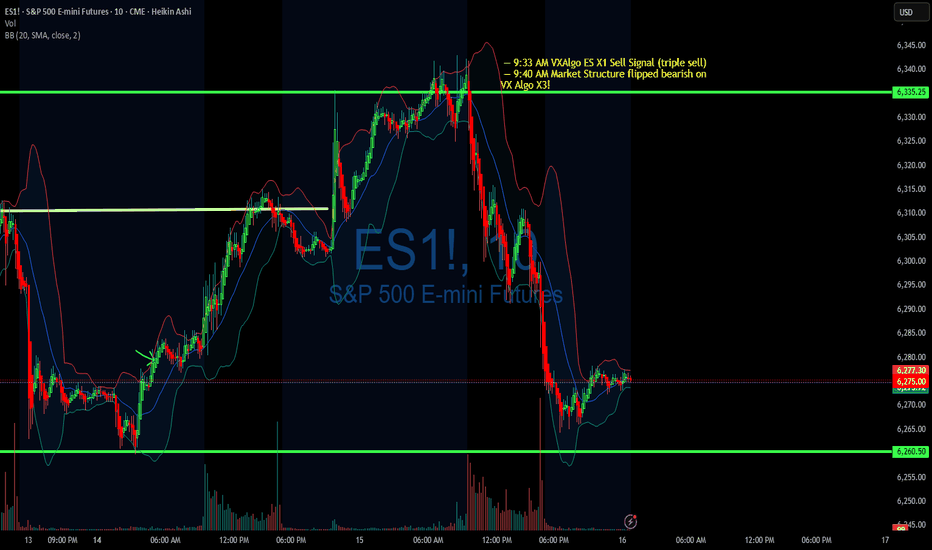
Using 1 min time frame for entries on VX algo & day tradingwhat time frames do you use to confirm entries outside of a buy signal?
If I am day trading, I will mainly use the 1 minute time frame to look for moving average support and resistance, and read the candle stick patterns as well from that chart.
However, there are times I'll switch to a 5 minute and 10 minute time frame to take a look at levels for moving averages and see what the candle stick patterns are from there.
So for example, today we had 3 of the x1 sell signals around 9:31, so we pull up the 1 min chart, we are getting confirm break of the 1st moving average support = bearish confirmation #1, follow by DHC = Bearish confirmation #2 , and the sell signal is already 3 confirmations, so we need to short ASAP.
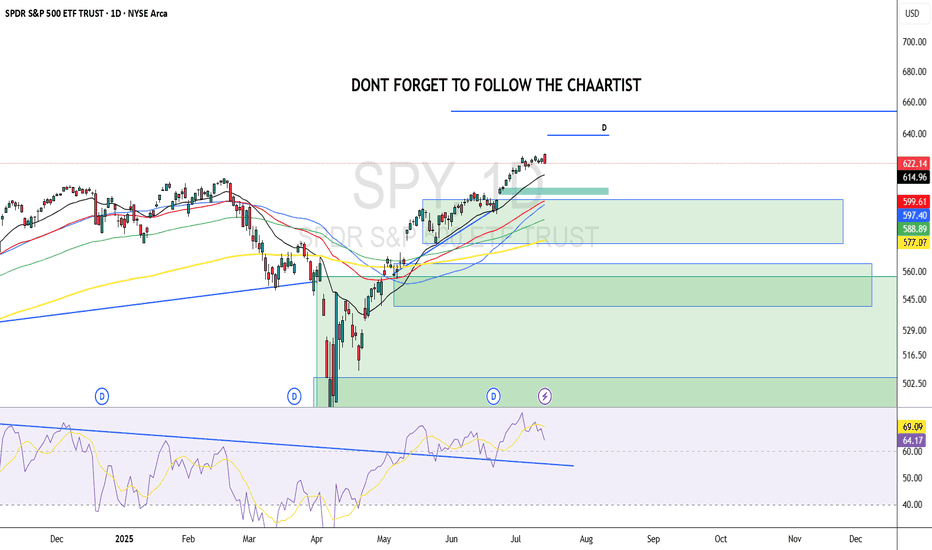
SPY/QQQ Plan Your Trade Special Update : BUCKLE UPThis video is a special update for all TradingView members. I felt I needed to share this information and present the case that I believe poses the most significant risk to your financial future - and it's happening right now.
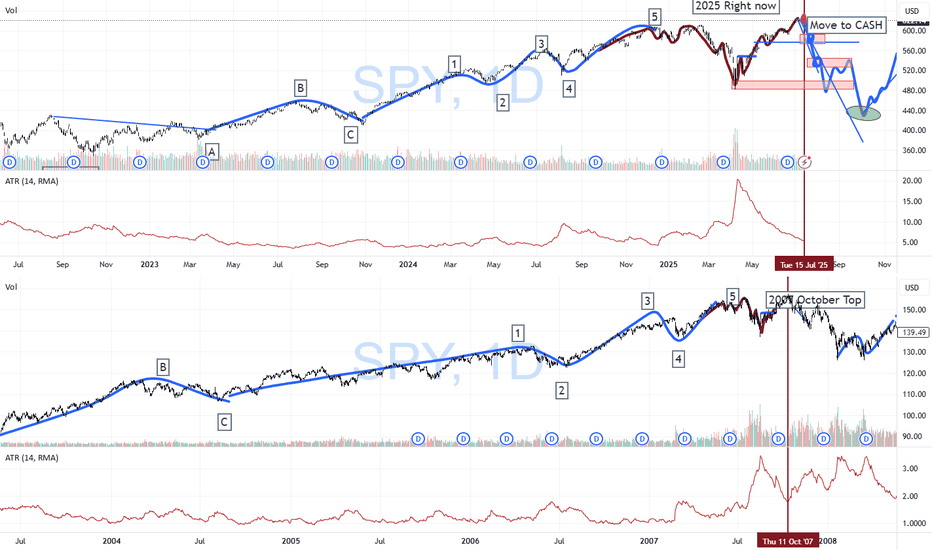
Several weeks ago, I identified a very unique mirror setup in the SPY and kept an eye on how it was playing out. I needed to see confirmation of this setup before I could say it had any real likelihood of playing out as I expected.
As of today, I'm suggesting that we now have excellent confirmation that the US/Global markets are about to enter a deep consolidation phase, lasting through the rest of 2025 and possibly into 2026 and early 2027.
The interesting thing about this price pattern/structure is that it is almost exactly the same as the 2003-2007 structure, which I believe is the origin of this mirror setup. Almost down to the exact type of price bars/patterns I'm seeing.
Many of you are already aware that I've been calling for a critical low cycle in the SPY on July 18 for many months. What you may not realize is that the pattern is based on Weekly price data. The July 18 cycle low can have a span of +/- 1-3 weeks related to when and how the cycle low pattern plays out.
Watch this video. If you have any questions, message me or comment.
I'm still here, doing my best to identify and unlock the secrets of price action and to help as many traders as I can.
Price is the Ultimate Indicator.
Get some.
#trading #research #investing #tradingalgos #tradingsignals #cycles #fibonacci #elliotwave #modelingsystems #stocks #bitcoin #btcusd #cryptos #spy #gold #nq #investing #trading #spytrading #spymarket #tradingmarket #stockmarket #silver
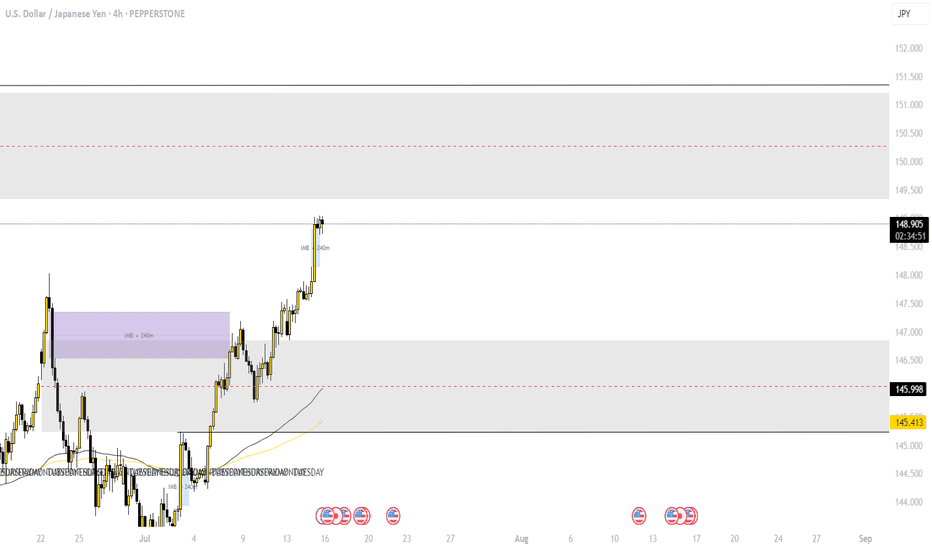
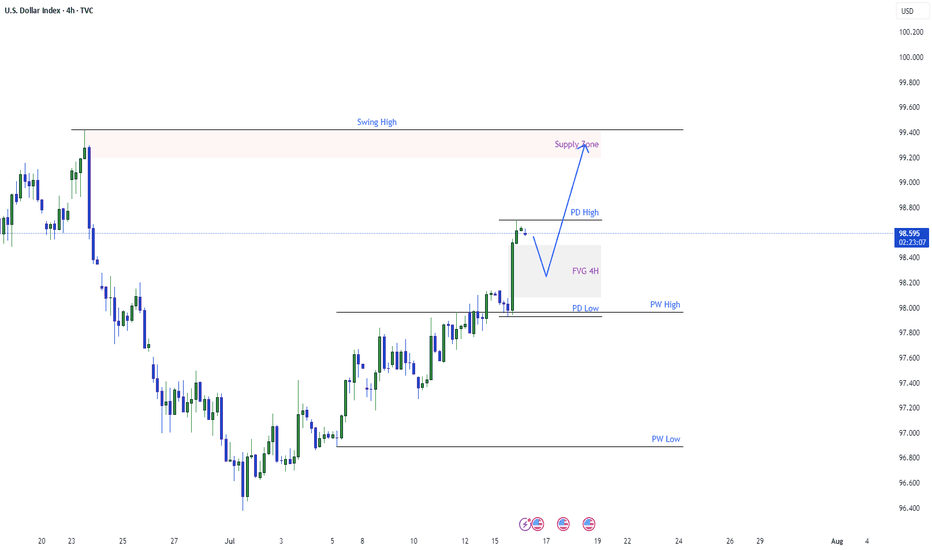
Dollar Index Having Bullish MomentumDollar Index shown good bullish momentum on previous day as we analyzed it earlier. Index has created a imbalance now the possibility for the index is to retrace back to imbalance and continue the bullish momentum and target towards the supply zone and swing high.
