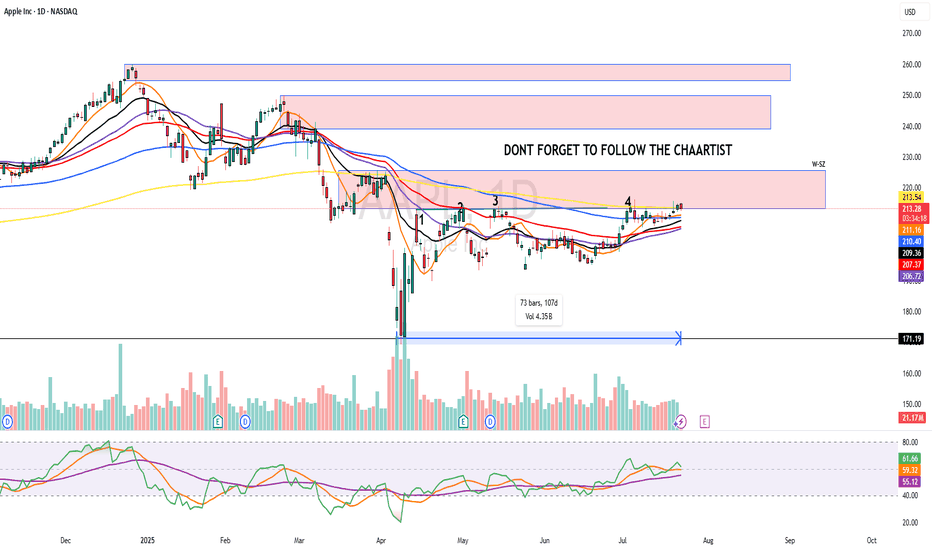
Apple - The next major push higher!🍎Apple ( NASDAQ:AAPL ) will head for new highs:
🔎Analysis summary :
Apple has been underperforming markets for a couple of months lately. However technicals still remain very bullish, indicating an inherent and substantial move higher soon. All we need now is bullish confirmation and proper risk management and this setup looks very decent.
📝Levels to watch:
$200, $300
🙏🏻#LONGTERMVISION
Philip - Swing Trader
Community ideas
Bullish Continuation on Silver. 4 Areas To TargetWhen we last visited Silver we were looking at a Bullish Daily Chore opportunity. That opportunity played out nicely and now that we've officially violated the most recent structure high, it should be relatively smooth sailing to our next level of structure from back in 2011.
I say relatively, because the most conservative target area is right above current price, but don't worry, because in this video we'll discuss how there will still be plenty of trading opportunities, even if you choose to wait for a sign after that initial level.
If you have any questions or comments, please leave them below. Also, if you want to share your analysis that's always helpful for the community.
Akil
Review and plan for 24th July 2025Nifty future and banknifty future analysis and intraday plan.
Quarterly results.
This video is for information/education purpose only. you are 100% responsible for any actions you take by reading/viewing this post.
please consult your financial advisor before taking any action.
----Vinaykumar hiremath, CMT
AW1 analysisIgnore the below write-up and watch the video.
Lorem Ipsum is simply dummy text of the printing and typesetting industry. Lorem Ipsum has been the industry's standard dummy text ever since the 1500s, when an unknown printer took a galley of type and scrambled it to make a type specimen book. It has survived not only five centuries, but also the leap into electronic typesetting, remaining essentially unchanged. It was popularised in the 1960s with the release of Letraset sheets containing Lorem Ipsum passages, and more recently with desktop publishing software like Aldus PageMaker including versions of Lorem Ipsum
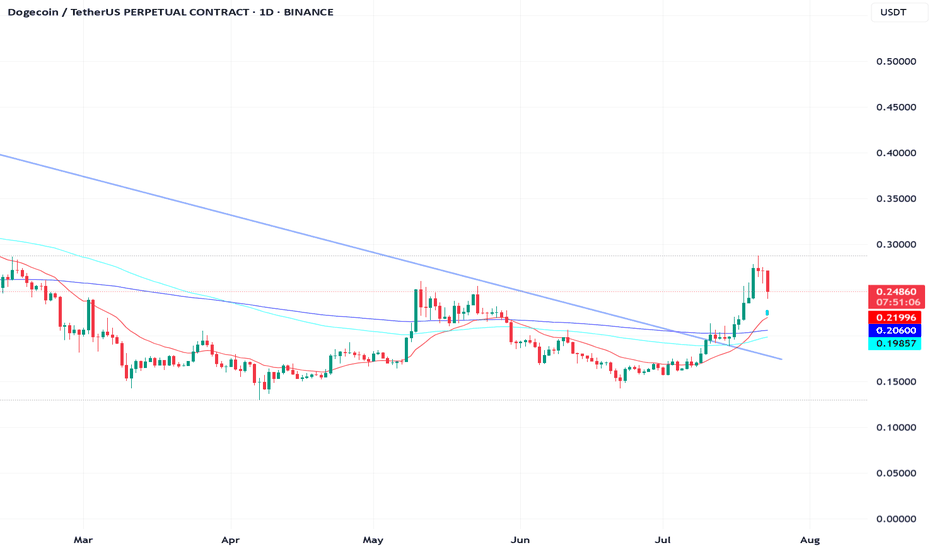
accumulation phase means bullish sentiment We are seeing a bullish scenario in an accumulation phase, we should be seeing doge test the 200 ema before bouncing back or test the 20 ema before bouncing back. we see a change in character which as short lived after a day's breakout. After a 7 day's rally after breaking out of the 200 ema, we see a pull, I THINK WE SHOULD BE SEEING MORE OF THAT UNTIL BUYERS ARE CONVINCED THE MARKET IS NOT JUST FOLLOWING THE SUMMER RALLY TREND
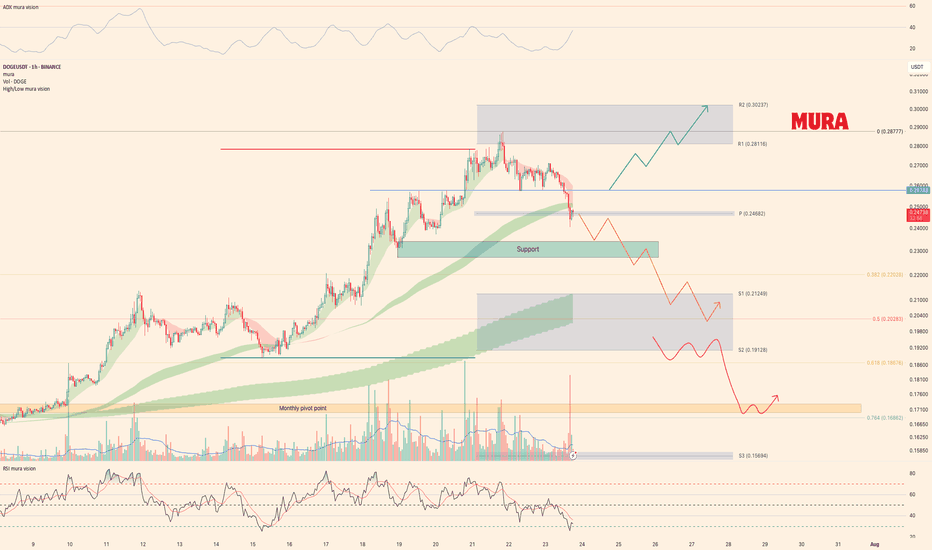
Trading plan for DOGELast week, BINANCE:DOGEUSDT rode the market wave with solid gains. Now we're in a correction phase, sitting right at the weekly pivot point. Here's the breakdown:
Upside potential: Needs to cleanly break and hold above $0.257 to target new local highs
Current reality: While below the weekly pivot, odds favor more downside toward $0.20
Trade the reality until the market proves otherwise. Watch those levels and let price lead the way.
Weekly trading plan for XRP BINANCE:XRPUSDT Last week played out perfectly - price followed our green scenario, broke through resistance, and hit all targets. Now we're clearly in a correction phase. Here's what I'm watching:
$3.16 level - Waiting for this to break before expecting consolidation in that former resistance zone
$3.30 pivot - This week's key reversal level
$3.45 resistance - If we break $3.30 but can't push past $3.45, we'll likely see the correction extend down to $3
Not making predictions here - just setting the levels that'll tell us what's next.
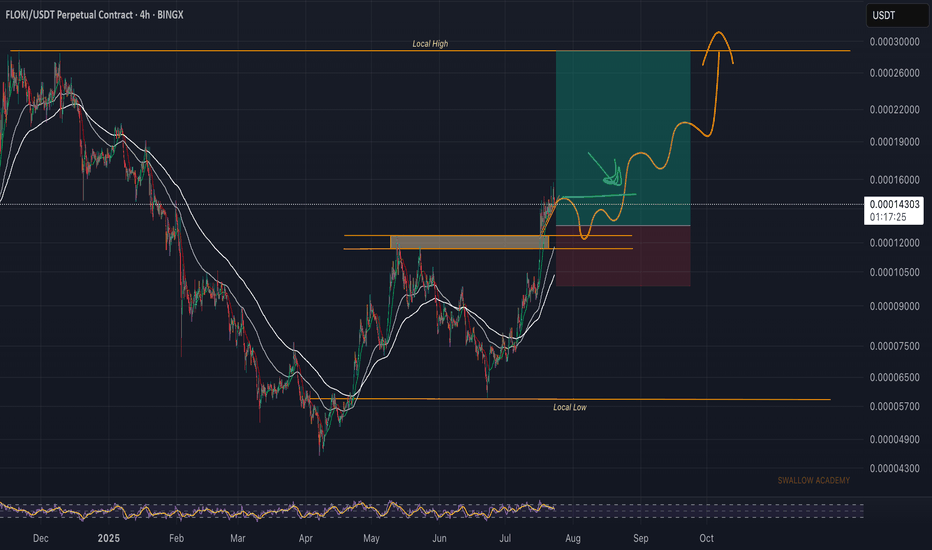
Floki (FLOKI): Good Buying Opportunity After Break of StructureFloki coin has good potential after the recent BOS, which is followed by a sharp bullish trend. There are 2 styles too long in this situation so we shared both of them. Either way, there is a good chance to get 2x on this coin!
More in-depth info is in the video—enjoy!
Swallow Academy
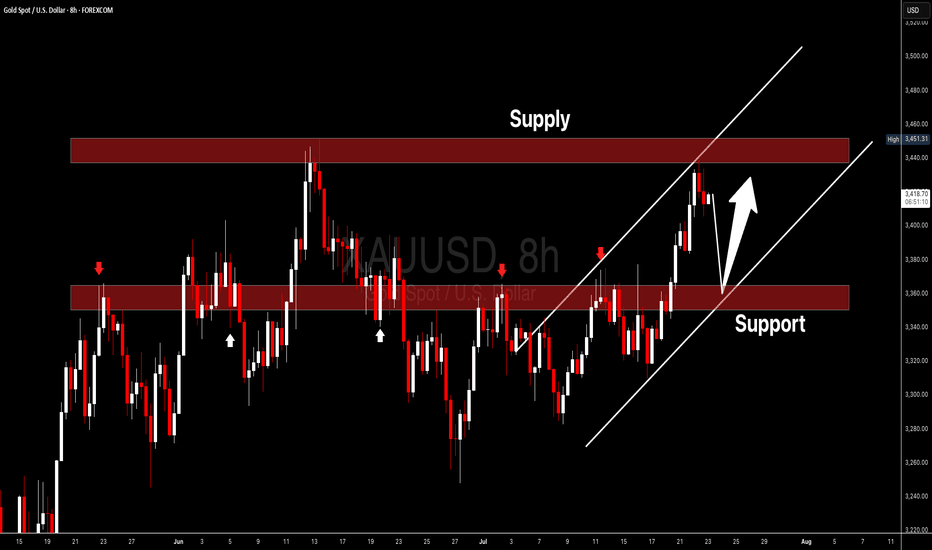
XAUUSD I Potential Pullback and More GrowthWelcome back! Let me know your thoughts in the comments!
** XAUUSD Analysis - Listen to video!
We recommend that you keep this on your watchlist and enter when the entry criteria of your strategy is met.
Please support this idea with a LIKE and COMMENT if you find it useful and Click "Follow" on our profile if you'd like these trade ideas delivered straight to your email in the future.
Thanks for your continued support!
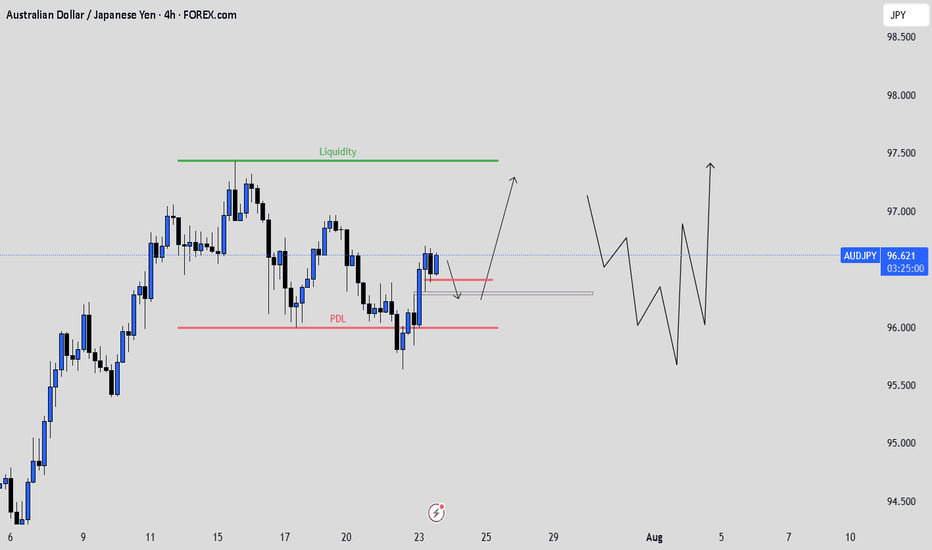
AUDJPY: Waiting to BUYIn this video I walk through my full thought process on how I plan to approach this setup. I’m not rushing in or trying to predict what price will do. Instead, I’m staying reactive. I’ve identified a clean FVG that price is currently approaching, and my plan is to wait patiently for price to tap into that zone.
But tapping the FVG alone is not enough for me to jump in. What I really want to see is a clear bullish reaction, something like a strong bullish engulfing candle or a shift in structure that confirms the buyers are stepping in. If that happens, then I’ll look to take a long position targeting another liquidy zone.
This isn’t about guessing the bottom. It’s about letting price tell the story and only acting when there’s a clear signal. That’s the discipline behind this trade.
XAU/USD🔴 LIVE NOW – Monitoring STRG → Gold ORB setup 🔄
Just marked the 15‑minute opening range on Gold… levels set, alerts on. No breakout yet, but I'm watching closely. Will it break high for a long, or break low for a short? Tune in live and catch every move as it unfolds. Trade with me in real time! ⏳📊"
#LiveTrading #GoldORB #STRGtoGold #OpeningRangeBreakout #XAUUSD #DayTrading #FollowAlong
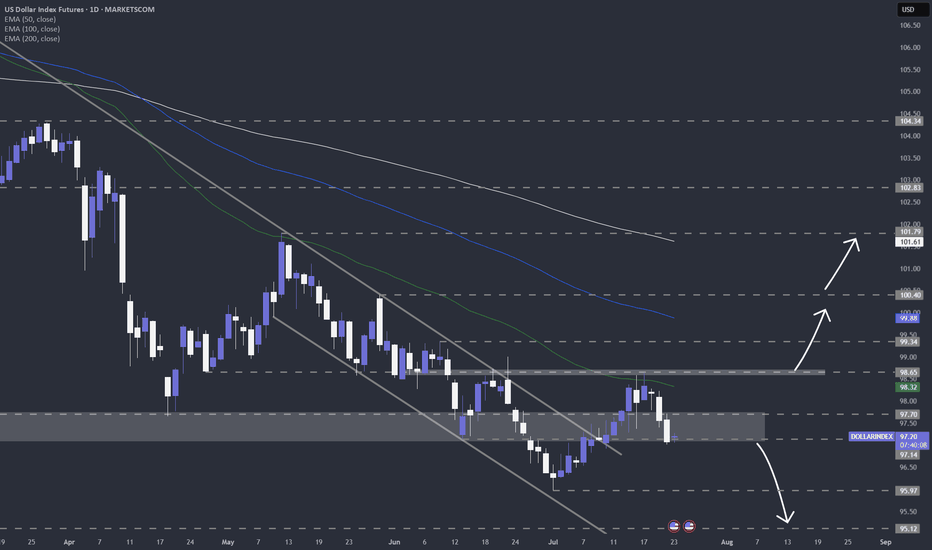
US dollar index (DXY) still looks weakAfter finding resistance near my 50-day EMA on the daily chart, TVC:DXY is now showing signs of continued weakness. Let's dig in.
MARKETSCOM:DOLLARINDEX
Let us know what you think in the comments below.
Thank you.
75.2% of retail investor accounts lose money when trading CFDs with this provider. You should consider whether you understand how CFDs work and whether you can afford to take the high risk of losing your money. Past performance is not necessarily indicative of future results. The value of investments may fall as well as rise and the investor may not get back the amount initially invested. This content is not intended for nor applicable to residents of the UK. Cryptocurrency CFDs and spread bets are restricted in the UK for all retail clients.
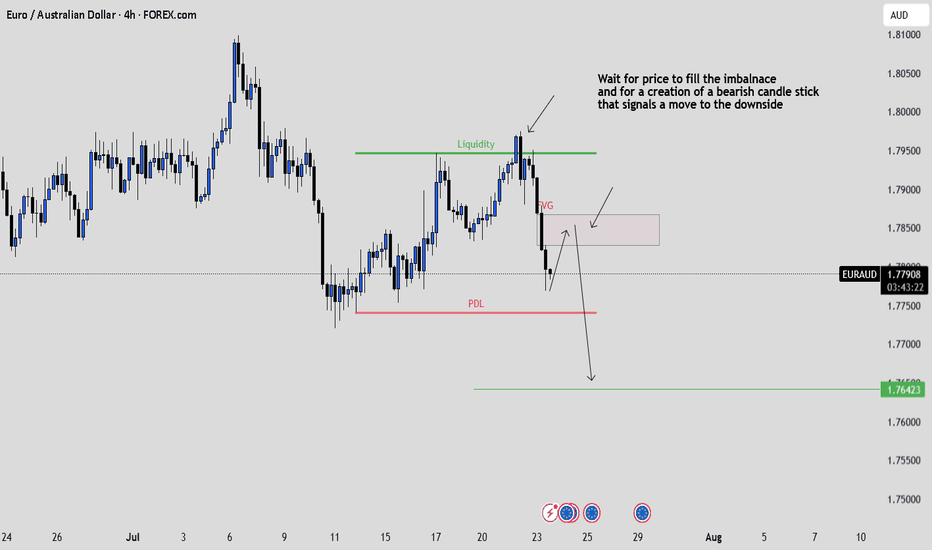
EURAUD: Waiting for the FVG Tap and Confirmation to ShortPrice ran previous liquidity and dropped aggressively, creating a clean FVG.
I’m now watching for price to retrace into that imbalance and form a strong bearish candle. If it does, I’ll be looking to short down
Clean structure. Just waiting for confirmation.
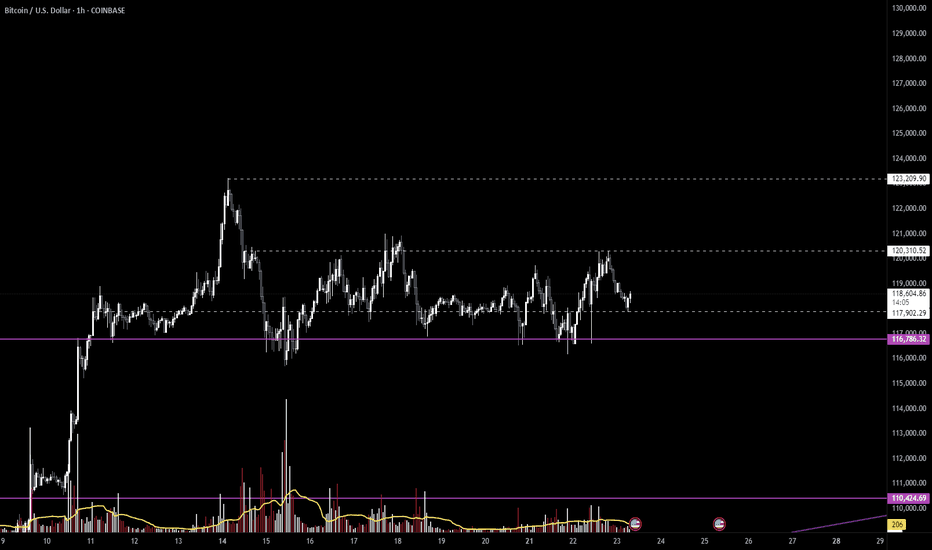
$BTC / Bitcoin Update - The Bitcoin Awakes? 7/23Hello fellow gamblers,
BTC price action has probably pissed off a lot of you, but I believe we are getting close to a breakout.
If my theory is correct, we are forming a wyckoff re-accumulation pattern that will give us an explosive move towards ATH.
- Right now will be a great buying opportunity for those with those that have nothing to lose(super risky entry), but I am suspecting that we formed a spring and the breakout happens next.
- The pattern is still valid as long as we stay above 116k.
- If we lose 116k, we will go towards 110k.
- Levels to watch: 116.7k, 117.9k, 120.3k, 123.2k
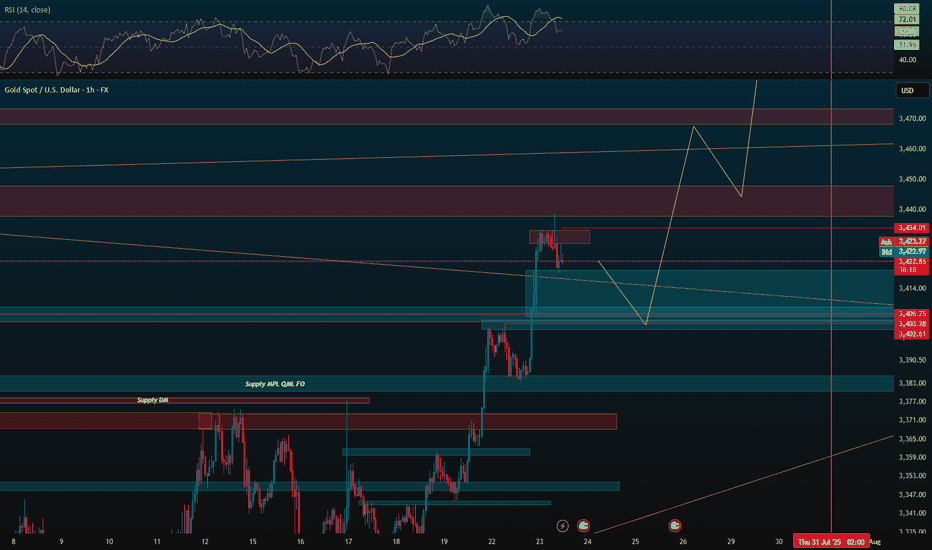
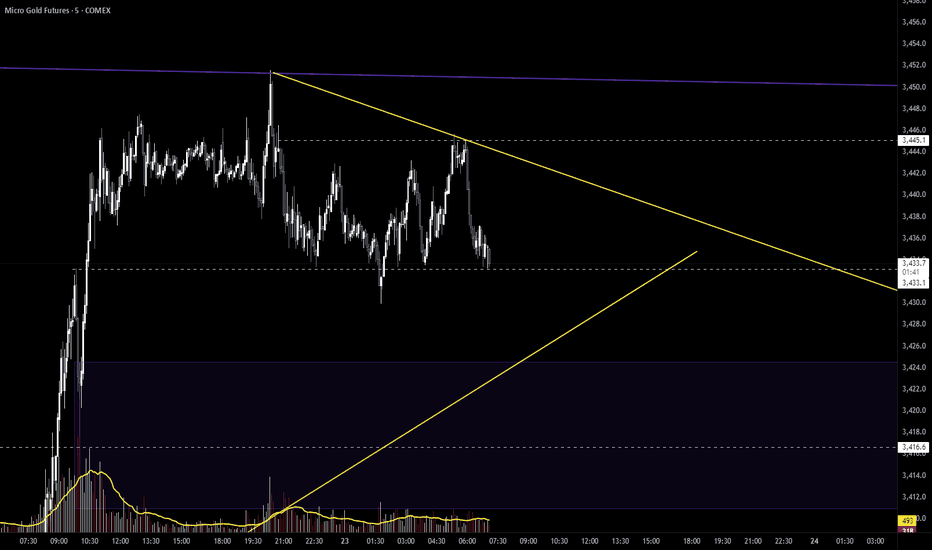
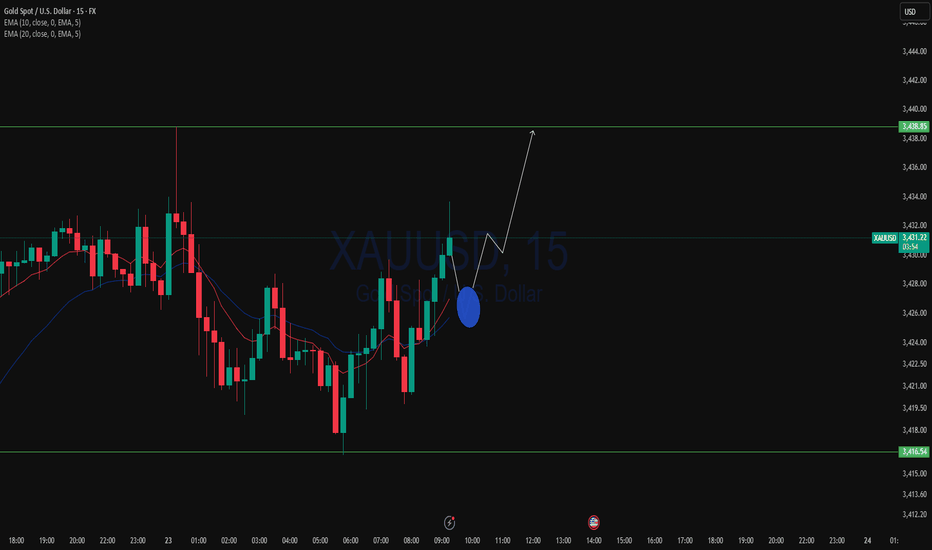
$GC / Gold Update - A New Entry - 7/23Hello fellow degenerates,
Our next target is above 3504 and we are currently in a quick ABC retracement.
- I am looking for an entry in the 3424.6-3411 range.
- This is a wave C so we could see an ABC or a ABCDE pattern forming.
- Levels to watch: 3433.1, 3424.6, 3416.6, 3408
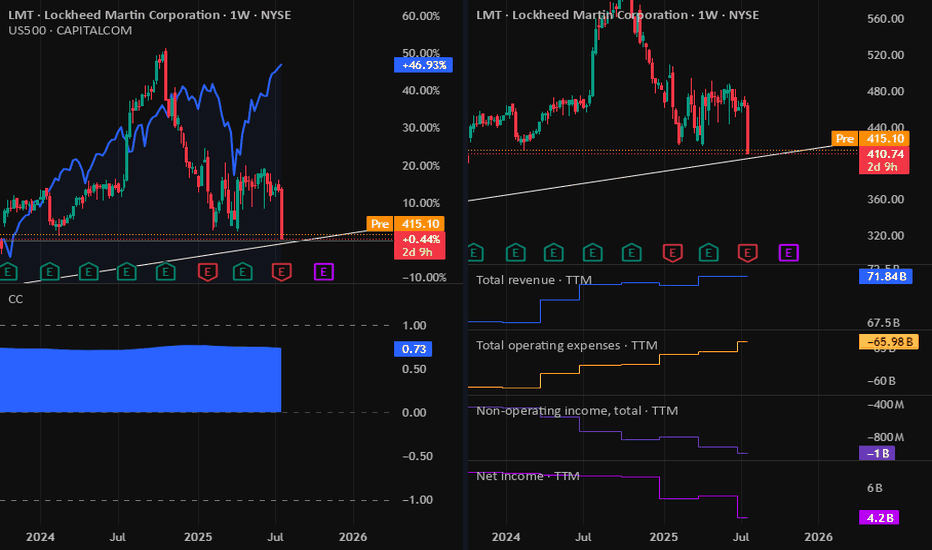
LMT: Lookheed Martin Dropped on Earnings 23-07-2025The dividends now is around 3% which is good for a strong company like Lookheed Martin. But as we are seeing a drop in company profits & Equity, and the stock price is near to a support level, we have to monitor the stock for the next few days or weeks. If all is ok, I will consider buying it.
Disclaimer: This content is NOT a financial advise, it is for educational purpose only.
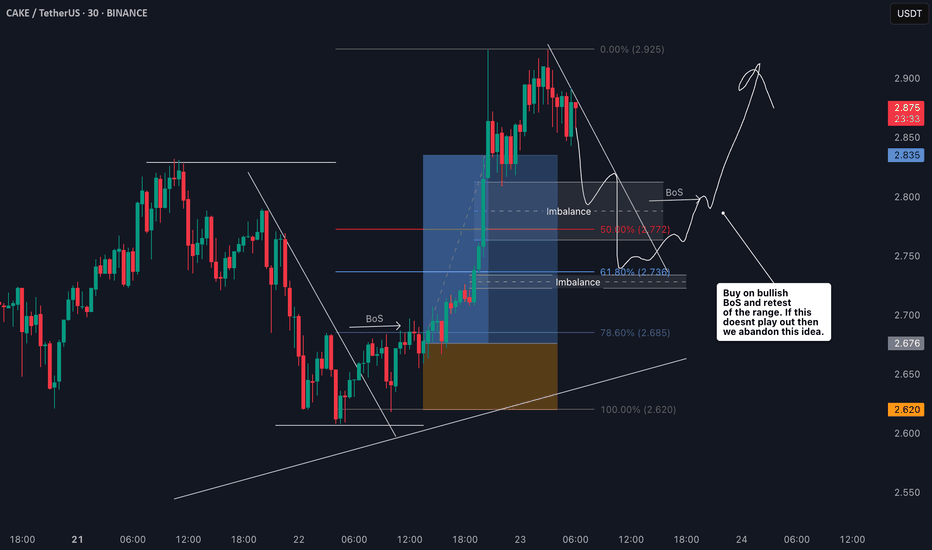
CAKE/USDT Bullish Trend Continues? Heres My Trade Plan📊 CAKE/USDT Trade Setup Overview
Taking a closer look at CAKE/USDT, price action has been moving nicely with a strong bullish trend on the 4H chart — printing consistent higher highs and higher lows 🔼📈.
Right now, it’s looking a little overextended, and I’m eyeing a potential pullback into my optimal entry zone around the 50%–61.8% Fibonacci retracement level 🎯📉.
That’s my point of interest, but it's important to keep in mind that the pullback may either be shallow or extend deeper before stabilizing 🌀. The key for me is to wait for price to find support in that zone, followed by a bullish break in market structure on the lower timeframe (15m or 30m) 🧱✅ — that would be my signal to enter long.
This is not financial advice — always do your own analysis before trading. ⚠️
XNGUSD Technical Update – What the Chart Is Telling Us NowIn this video, I break down the current XNGUSD (Natural Gas) chart using pure price action analysis on the daily timeframe.
This update builds on my previous post, where I shared a comprehensive outlook supported by fundamentals, including supply/demand imbalances, geopolitical risks, and long-term LNG export growth.
In this video, I focus purely on the technical picture—highlighting key levels, market structure, recent consolidation, and where I see potential opportunities unfolding next.
📈 If you're trading or investing in Natural Gas, this is a must-watch update to stay in tune with the current market dynamics.
Remember: This is not financial advice. Always do your own research and manage risk appropriately.
XAUUSD Analysis todayHello traders, this is a complete multiple timeframe analysis of this pair. We see could find significant trading opportunities as per analysis upon price action confirmation we may take this trade. Smash the like button if you find value in this analysis and drop a comment if you have any questions or let me know which pair to cover in my next analysis.


