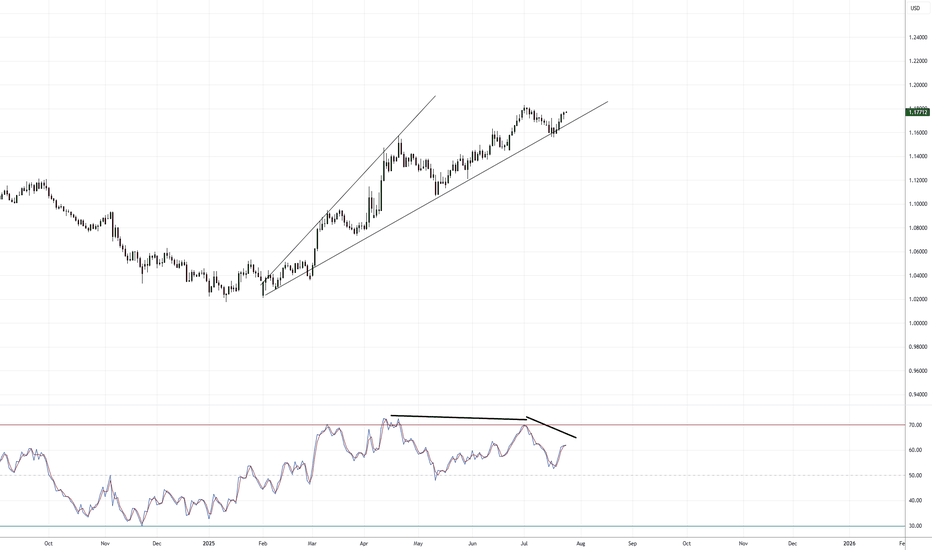
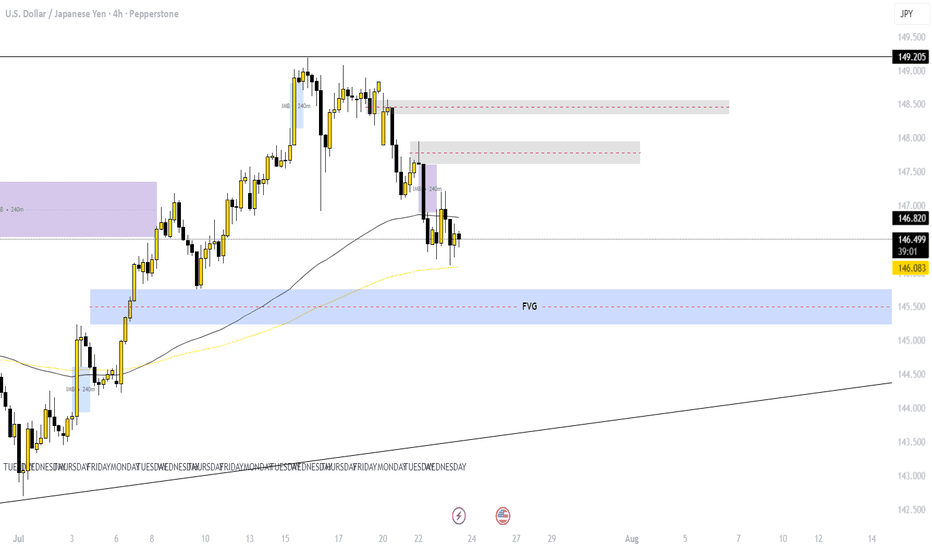
EUR/USD: The Last Bear Standing...As indicated on my previous EUR/USD idea ( that's still currently open ), I remain short EUR/USD given the technical aspect of things are still valid.
Divergences are still in play along with a rising broadening pattern and the fact that we're trading at the yearly R3 level ( which is rare ).
I suspect we will have some volatility with the ECB press conference tomorrow, so that should get things moving hopefully in the bearish direction. If we begin trading aggressively above 1.1800+, that will invalidate the short idea overall.
If we roll over, I'm still looking for 1.13000 - 1.12000 as the target range for Q3 going into Q4.
We'll see how this all develops.
As always, Good Luck & Trade Safe!
Community ideas
Intro to what I call Algo TradingAlgorithmic training can mean different things to different people what I mean when I say the term algorithmic trading is just things that happen automatically.
Some guys have like these really complex formulas and based on like all this really advanced mathematics. If I'm being 100% honest i'm essentially looking at pictures on a chart and looking at the patterns.
But the pictures on the chart themselves are based on really advanced mathematical formulas or they can be at least or a combination of multiple mathematical formulas that then that the result of our represented by a picture on a chart.
So I look at the pictures on the chart I analyzed them really carefully and if it looks good I use artificial intelligence to code the idea so it happens automatically based on the rules that I set.
07/23/25 Trade Journal, and ES_F Stock Market analysis EOD accountability report: -1243
Sleep: 4 hours
Overall health: having issues with sleep the last 2 nights
VX Algo System Signals from (9:30am to 2pm)
9:23 AM Market Structure flipped bullish on VX Algo X3!
9:34 AM Market Structure flipped bearish on VX Algo X3!
11:47 AM Market Structure flipped bullish on VX Algo X3!
12:17 PM NQ X1 Sell Signal (triple sell)
What’s are some news or takeaway from today? and What major news or event impacted the market today?
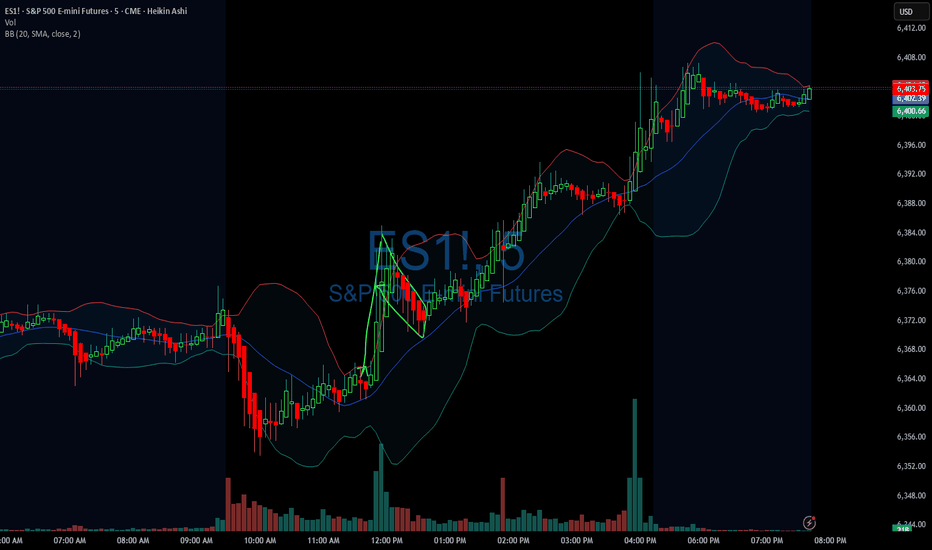
After going on a long green streak, I got a bit greedy and wanted to make a big profit and went a bit risky dicky at the end of the session, having been able to read everything pretty well, I was pretty sure $6400 was going to be a pretty tight resistance between reading the gammabot data and options data, it showed that we would stall at $6400 on ES so i decided to put a few big ES short positions there with a tight stoploss at 6405 thinking, it surely can't go wrong with only a few minutes left in the session.
and surely it did, it went completely wrong and i went from being positive for the day to negative and throwing my profits away.
News
*STOCKS SURGE AFTER US-JAPAN TRADE DEAL AS S&P 500 AND NASDAQ CLINCH FRESH RECORDS
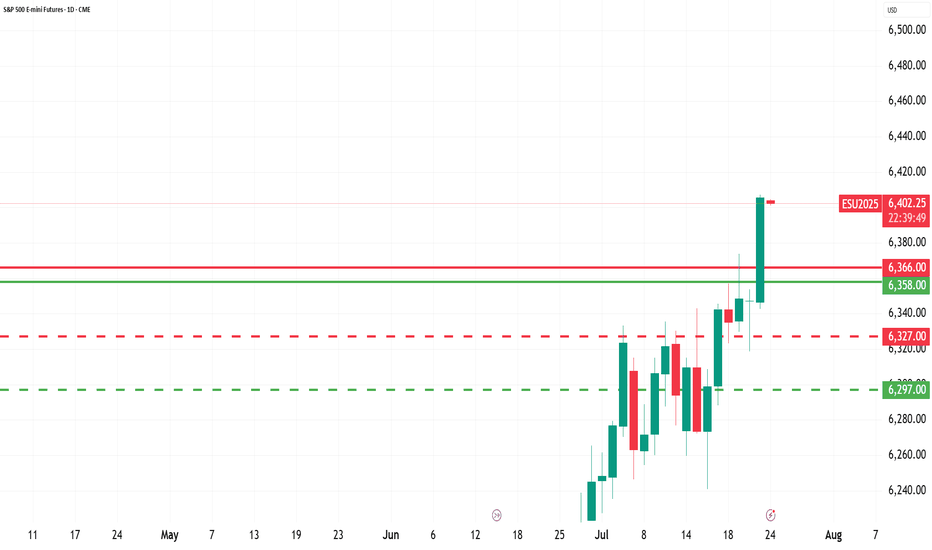
What are the critical support levels to watch?
--> Above 6339= Bullish, Under 6320= Bearish
Video Recaps -->https://www.tradingview.com/u/WallSt007/#published-charts
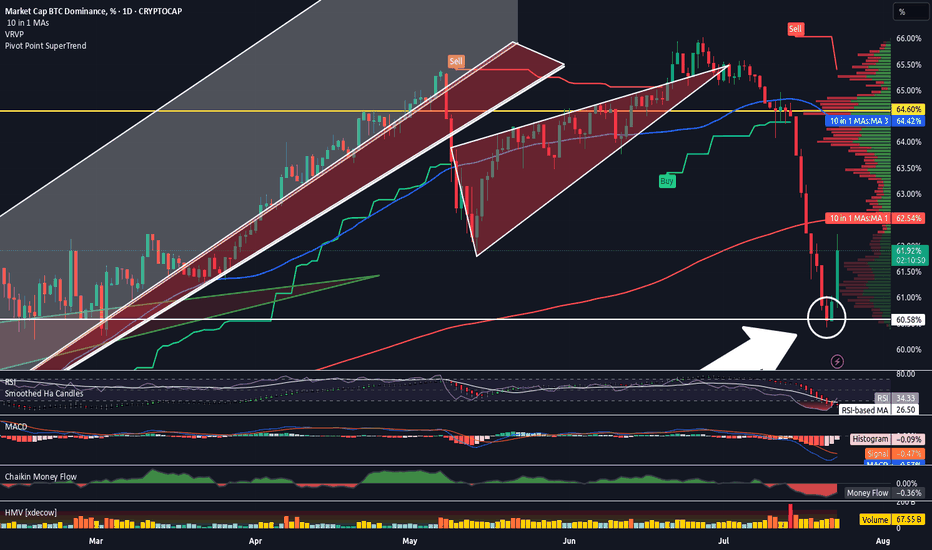
Altcoin Season Has Started. And A Quick Look At The Stock MarketHey Traders,
Time for me to catch you up on the latest price action in both the stock market and crypto as well as touch upon a few changes on my platform and subscription services and what I plan for the future.
Timestamps:
00:00 | Housekeeping - site changes, etc
04:35 | BTC Dominance
06:45 | DXY Dollar Chart
10:00 | SPY
14:25 | BTC Bitcoin Chart
15:45 | Bitcoin Liquidity Heatmap
17:30 | Solana
19:05 | Ethereum
20:20 | Crypto & Stock Trackers
24:25 | My Indicator
26:10 | Where I Went Wrong & How I Plan To Course Correct
✌️ Stew
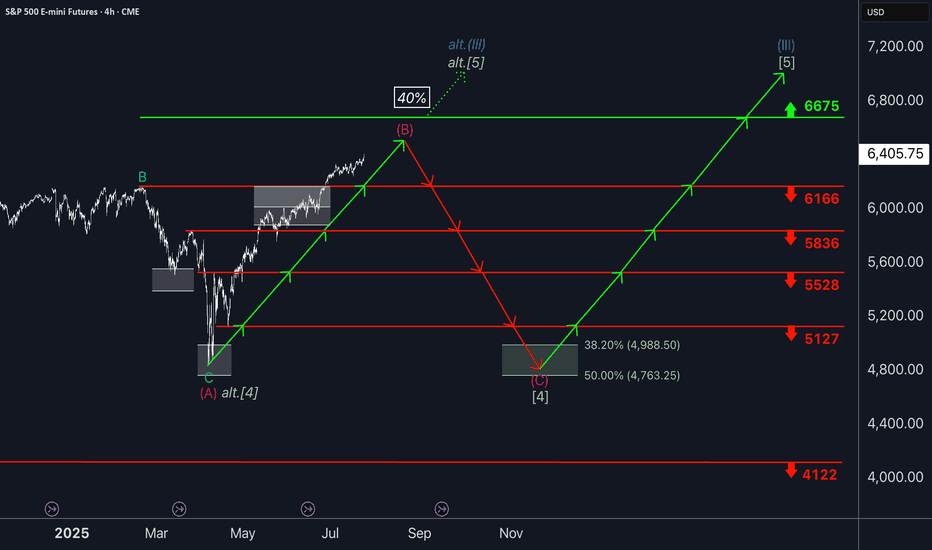
S&P500: Rally ContinuesYesterday, the S&P 500 managed to notch modest gains once again. In line with our primary scenario, the ongoing magenta wave (B) is likely to continue climbing toward resistance at 6,675 points. Once this corrective upswing reaches its peak—still below that level—we anticipate a pullback as part of wave (C), which should drive the index below support at 5,127 points. Beneath this threshold, our green long Target Zone spans from 4,988 to 4,763 points. We expect the low of wave (C) and the conclusion of the broader green wave to occur within this range. From there, a sustained rally is expected to unfold in wave , which should lift the index above resistance at 6,675 points and complete the cyclical blue wave (III). As a result, this price range can be considered for long entries. The alternative scenario, which calls for a direct breakout above the 6,675-point level without a prior pullback, remains in play with a 40% probability.
📈 Over 190 precise analyses, clear entry points, and defined Target Zones - that's what we do (for more: look to the right).
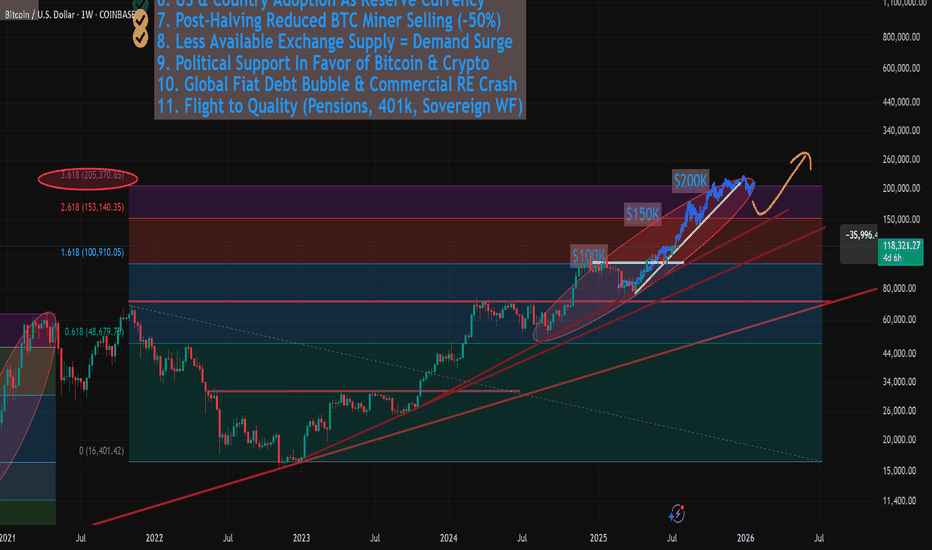
Revsiting $150k - $200k Bitcoin (AND Next Bear Market Bottom)In this video I revisit my 2-year old study showing the potential path for Bitcoin to $150k to $200k and not only how we might get there, but the 11 reasons WHY we can this cycle.
This is the same Fibonacci series that predicted the 2021 cycle high at the 3.618 (Log chart) and used the same way this cycle, with some interesting 2025 forecasts of:
1.618 - $100k
2.618 - $150k
3.618 - $200k
There are quite a few confluences that we get to $150k like the measured moves from both the recent mini bull flag, but also the larger one from earlier this year.
** Also I touch on revisiting my study from 2 years ago where I may have discovered the retracemebnt multiple that correctlty predicted and held the 2022 lowes around $16k. **
It's a VERY interesting number you all will recognize (buy may not agree with).
Let me know what you think.
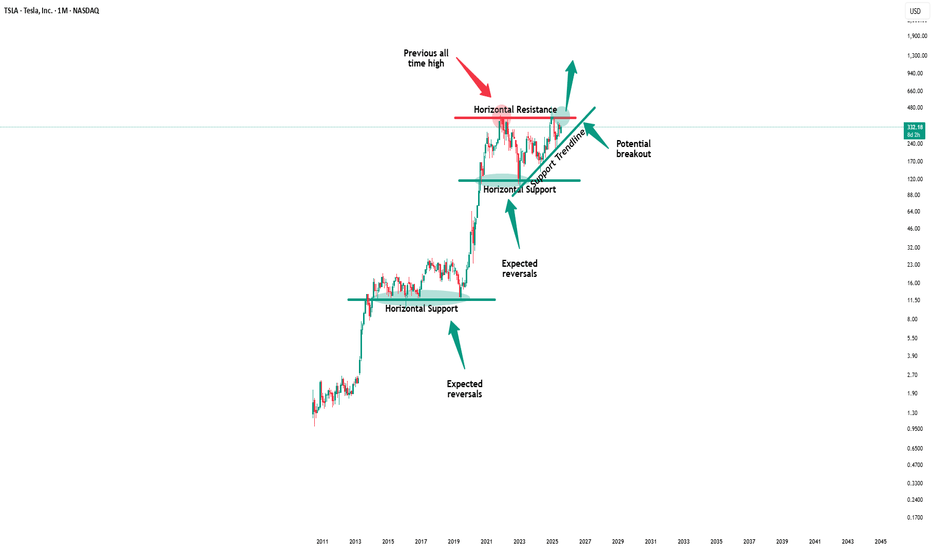
Tesla - The all time high breakout!🚗Tesla ( NASDAQ:TSLA ) will break out soon:
🔎Analysis summary:
For the past five years Tesla has overall been consolidating between support and resistance. But following the recent bullish break and retest, bulls are slowly taking over control. It is actually quite likely that Tesla will soon break above the previous all time highs.
📝Levels to watch:
$400
🙏🏻#LONGTERMVISION
SwingTraderPhil
Bitcoin - Trust the higher timeframe!⚔️Bitcoin ( CRYPTO:BTCUSD ) is still 100% bullish:
🔎Analysis summary:
For the past couple of months we have been seeing an overall consolidation on Bitcoin. But looking at the higher timeframe, Bitcoin remains in an underlying strong bullrun. Consolidations are always expected and no reason to freak out since everything is still bullish.
📝Levels to watch:
$100.000
🙏🏻#LONGTERMVISION
Philip - Swing Trader
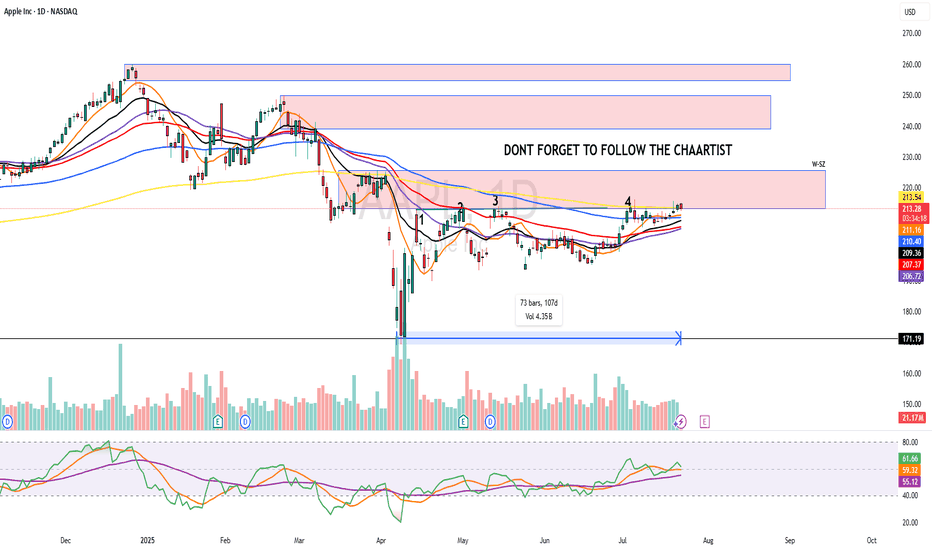
Apple - The next major push higher!🍎Apple ( NASDAQ:AAPL ) will head for new highs:
🔎Analysis summary :
Apple has been underperforming markets for a couple of months lately. However technicals still remain very bullish, indicating an inherent and substantial move higher soon. All we need now is bullish confirmation and proper risk management and this setup looks very decent.
📝Levels to watch:
$200, $300
🙏🏻#LONGTERMVISION
Philip - Swing Trader
Bullish Continuation on Silver. 4 Areas To TargetWhen we last visited Silver we were looking at a Bullish Daily Chore opportunity. That opportunity played out nicely and now that we've officially violated the most recent structure high, it should be relatively smooth sailing to our next level of structure from back in 2011.
I say relatively, because the most conservative target area is right above current price, but don't worry, because in this video we'll discuss how there will still be plenty of trading opportunities, even if you choose to wait for a sign after that initial level.
If you have any questions or comments, please leave them below. Also, if you want to share your analysis that's always helpful for the community.
Akil
Review and plan for 24th July 2025Nifty future and banknifty future analysis and intraday plan.
Quarterly results.
This video is for information/education purpose only. you are 100% responsible for any actions you take by reading/viewing this post.
please consult your financial advisor before taking any action.
----Vinaykumar hiremath, CMT
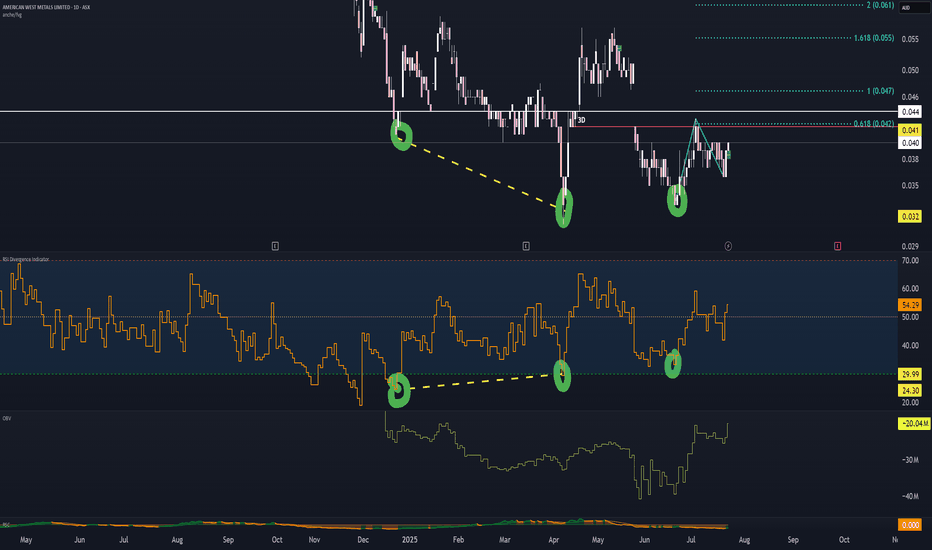
AW1 analysisIgnore the below write-up and watch the video.
Lorem Ipsum is simply dummy text of the printing and typesetting industry. Lorem Ipsum has been the industry's standard dummy text ever since the 1500s, when an unknown printer took a galley of type and scrambled it to make a type specimen book. It has survived not only five centuries, but also the leap into electronic typesetting, remaining essentially unchanged. It was popularised in the 1960s with the release of Letraset sheets containing Lorem Ipsum passages, and more recently with desktop publishing software like Aldus PageMaker including versions of Lorem Ipsum
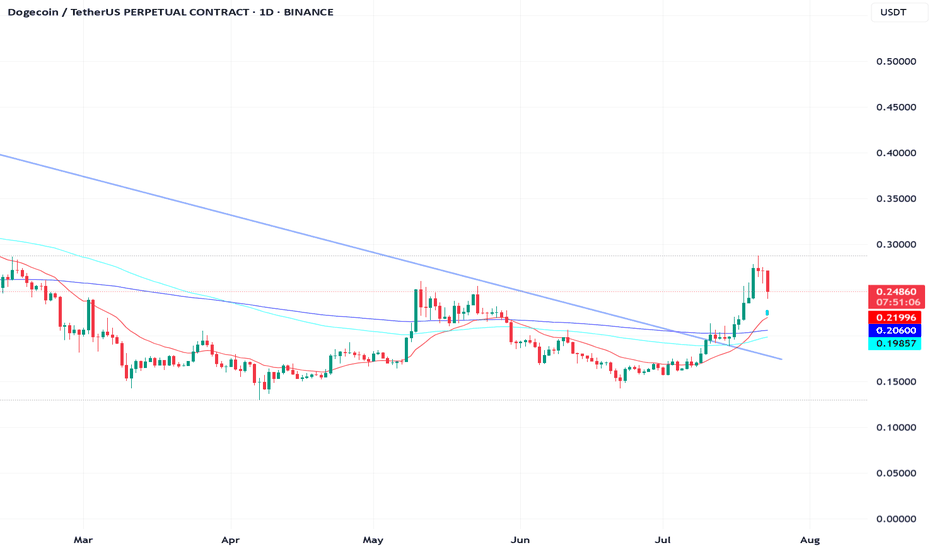
accumulation phase means bullish sentiment We are seeing a bullish scenario in an accumulation phase, we should be seeing doge test the 200 ema before bouncing back or test the 20 ema before bouncing back. we see a change in character which as short lived after a day's breakout. After a 7 day's rally after breaking out of the 200 ema, we see a pull, I THINK WE SHOULD BE SEEING MORE OF THAT UNTIL BUYERS ARE CONVINCED THE MARKET IS NOT JUST FOLLOWING THE SUMMER RALLY TREND
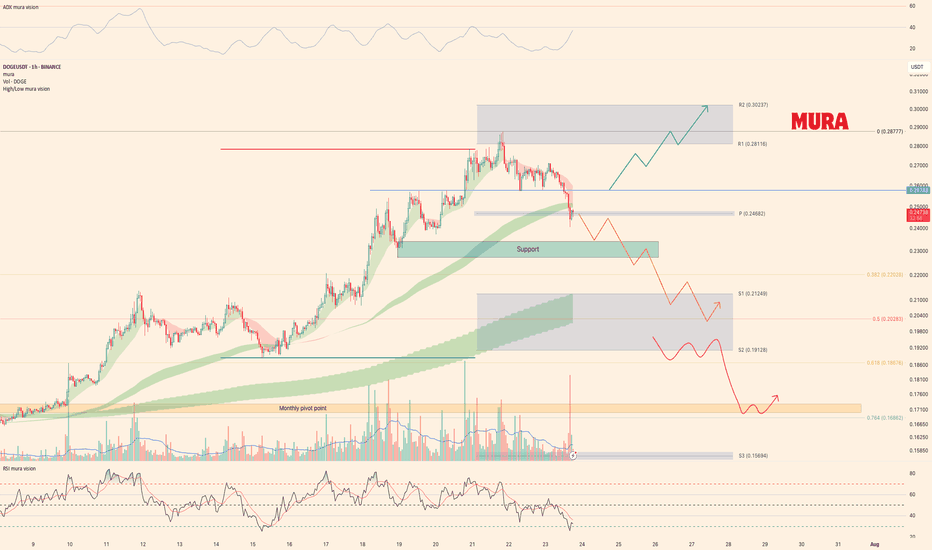
Trading plan for DOGELast week, BINANCE:DOGEUSDT rode the market wave with solid gains. Now we're in a correction phase, sitting right at the weekly pivot point. Here's the breakdown:
Upside potential: Needs to cleanly break and hold above $0.257 to target new local highs
Current reality: While below the weekly pivot, odds favor more downside toward $0.20
Trade the reality until the market proves otherwise. Watch those levels and let price lead the way.
Weekly trading plan for XRP BINANCE:XRPUSDT Last week played out perfectly - price followed our green scenario, broke through resistance, and hit all targets. Now we're clearly in a correction phase. Here's what I'm watching:
$3.16 level - Waiting for this to break before expecting consolidation in that former resistance zone
$3.30 pivot - This week's key reversal level
$3.45 resistance - If we break $3.30 but can't push past $3.45, we'll likely see the correction extend down to $3
Not making predictions here - just setting the levels that'll tell us what's next.
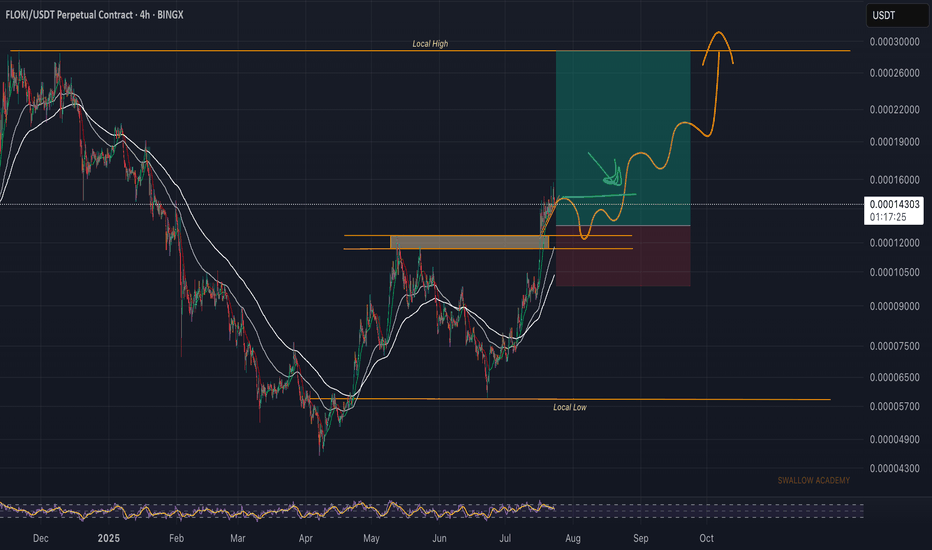
Floki (FLOKI): Good Buying Opportunity After Break of StructureFloki coin has good potential after the recent BOS, which is followed by a sharp bullish trend. There are 2 styles too long in this situation so we shared both of them. Either way, there is a good chance to get 2x on this coin!
More in-depth info is in the video—enjoy!
Swallow Academy
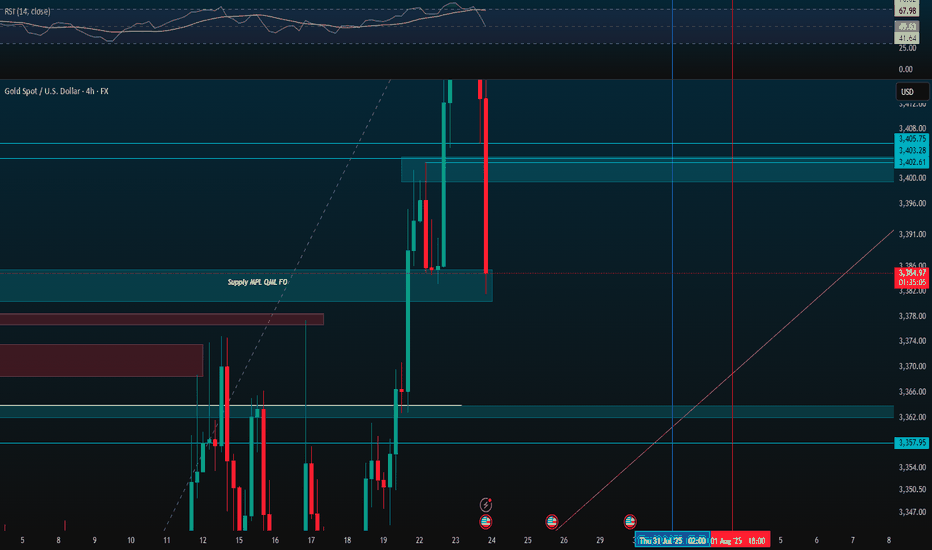
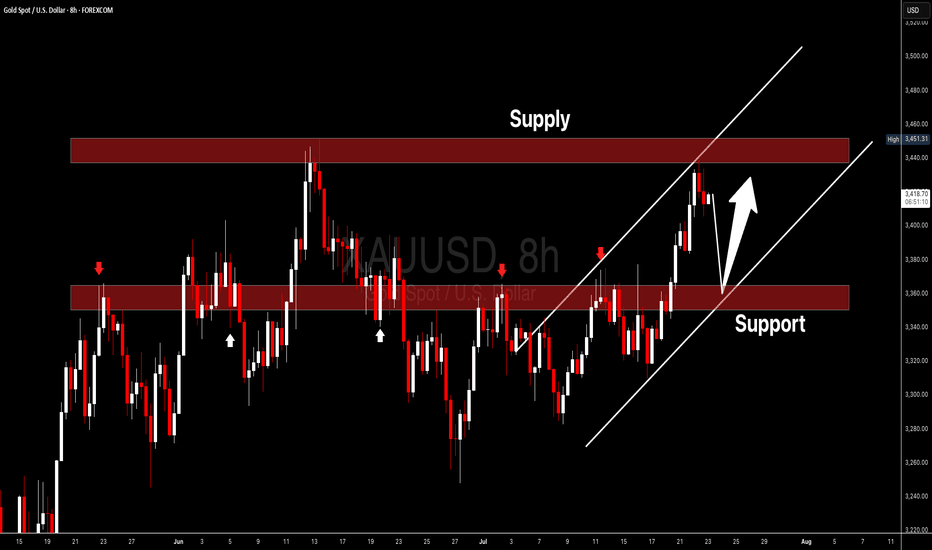
XAUUSD I Potential Pullback and More GrowthWelcome back! Let me know your thoughts in the comments!
** XAUUSD Analysis - Listen to video!
We recommend that you keep this on your watchlist and enter when the entry criteria of your strategy is met.
Please support this idea with a LIKE and COMMENT if you find it useful and Click "Follow" on our profile if you'd like these trade ideas delivered straight to your email in the future.
Thanks for your continued support!
